The original text is from TradingNEWS, authored by Itai Smidt
Translation|Courier @Odaily Planet Daily

On November 13, Beijing time, Bitcoin fell below $70,000, hitting a low of $68,307, with a 24-hour decline of 7%, marking a new low since August 19. The weekly performance is even worse, as Bitcoin has dropped 15% compared to the same day last week, expected to record a sixth consecutive week of declines.
Where is the downward trend coming from?
The trigger factors are external to the crypto world. At 8:59 AM Eastern time, Nvidia (NVDA) announced that Jensen Huang had resigned as president, CEO, and board member, effective immediately. The stock opened with a drop of 14%, and the sell-off spread to all assets priced based on AI enthusiasm and liquidity. Bitcoin immediately fell below $73,000 after the announcement, dropping below $72,000 within the first hour of trading, marking its lowest point since August.
The cross-asset pattern defined this trading session. The Nasdaq Composite Index fell 0.63% to 25,306.18 points; gold dropped 3.39% to $3,864.80; Bitcoin fell 3.41%. When both safe-haven metals and risk assets drop the same percentage on the same morning, the market is not choosing between risk preference and risk aversion. It is selling everything that does not generate returns, as the yield on the 10-year U.S. Treasury is 5.07%.
This is the argument for the current forecast. Bitcoin trades as a high-beta liquidity asset, not as digital gold. Jensen Huang's departure is the fuse, but the stable driving force is the institutional outflows from spot ETFs, shrinking stablecoin base, and the real rates that have made holding zero-yield assets expensive. At least one of these three factors needs to turn before any rebound will be sold.
The upper trajectory exists and the path is clear. Bitcoin has fallen below the lower band of the Bollinger Bands, and intraday momentum is oversold. If it can reclaim the cluster of moving averages between $76,230 and $78,905, the upper band of $82,700 becomes the target. To get there, a shift in capital flows is needed first.
The Impact of Nvidia CEO’s Departure and the Transmission of AI Liquidity to Crypto
The Nvidia situation impacted Bitcoin through three channels, all operating simultaneously on Thursday morning.
The first is pure correlation. For most of 2026, Bitcoin and Nasdaq traded as the same risk complex, with Nvidia at the center of this complex. When the world's second-highest company opens down 14%, losing over $550 billion in market cap since Sunday, every leveraged long position tied to growth assets will be simultaneously marked down in value.
The second channel is crypto-native. Tokenized stock exposure is now traded around the clock in crypto derivatives markets. Within minutes of the resignation announcement, an NVDA perpetual contract on a certain blockchain exchange plummeted 12% to $160.99. A long position holder with 9,959 NVDA contracts was liquidated, losing $1.54 million; another position valued at $31 million was suffering a floating loss. These losses were hitting margin accounts holding both Bitcoin and Ethereum. When one leg of collateral shrinks, platforms will sell off other legs to meet margin requirements.
The third channel involves funding. Nvidia has been using its balance sheet to finance infrastructure around its self-developed chips, including a $2 billion investment in new cloud provider Nebius (NBIS) in March. The market had already begun to question this cyclical financing model. After an interim CEO was appointed, investors began to ask: will these financing commitments shrink? Any shrinkage would tighten the financing for AI infrastructure, while speculative funds that have flowed heavily into crypto this year have already shifted toward AI trading. If AI falters, this money will not flow back into Bitcoin, it will exit risk assets altogether.
The numbers on Thursday matched this pattern. CoreWeave (CRWV) dropped as much as 13.6%, Nebius fell 16.2%. Storage chip maker SanDisk (SNDK) dropped 6% to $8.5. Stocks most deeply leveraged on AI capital fell the hardest, with Bitcoin following suit.
One detail is crucial for forecasting: the stock market is rotating within AI rather than moving away from AI. Broadcom (AVGO) rose 5.6%, AMD increased by 3.7%, as traders bet on Nvidia's rivals. Crypto does not have such rotation options—there’s no “Broadcom of Bitcoin” to absorb this money. The impact that stock traders can evade becomes direct selling in crypto.
Nvidia's earnings report on November 17 has now become a catalyst for crypto. A clean report under interim CEO Colette Kress could stabilize the AI complex, which will then help Bitcoin’s correlation on the upward path.
Spot ETF Outflows: $299.9 Million on November 11, $1.44 Billion Over Five Trading Days
The most stable pressure on Bitcoin is coming from Wall Street's own pipeline. The U.S. spot Bitcoin ETF saw a net outflow of $299.9 million on Wednesday (November 11), marking the fifth consecutive day of redemptions. This round of continuous outflows began on November 5, draining $1.44 billion to date. Wednesday's outflow was 3.2 times that of Tuesday—a selling pressure accelerating again after a day of slowing down, during which only $95 million was withdrawn from this category.
Losses mainly came from iShares Bitcoin Trust (IBIT). On Wednesday, it saw an outflow of $269.73 million, accounting for nearly 90% of the total. Grayscale Bitcoin Trust (GBTC) recorded an outflow of $39.13 million. The only inflow that day came from Morgan Stanley Bitcoin ETF (MSBT), at $8.96 million, an amount too small to change anything.
The continuous outflow from IBIT is longer than that of the entire category. This fund has seen net outflow for nine consecutive trading days since October 30, totaling $2 billion. The largest single-day withdrawal was $405.3 million on November 2 and $403 million on November 6. IBIT still has $58.71 billion in net assets, with a cumulative net inflow of $64.54 billion since inception. This means a large number of holders are still in play, but at the price of $71,393, an increasingly larger percentage is under water.
Weekly figures show how quickly the tide is turning. For the week ending November 7, the net outflow was $1.28 billion, the largest single-week outflow since the end of June, pushing the flow for 2026 into approximately -$914 million. This is the first time since the launch of spot products in January 2024 that this category is expected to record an annual net outflow. In October, it already lost $515 million.
The total figure of the category illustrates the stakes involved. Spot Bitcoin ETFs hold $93.7 billion in net assets, equivalent to 6.24% of Bitcoin's market cap, about 1.25 million BTC, with a cumulative net inflow of $55.1 billion. Ethereum ETFs are also bleeding, with a net outflow of $144.81 million on November 11.
The logic of the prediction is simple. ETF demand is the marginal buyer that absorbs miner supply and distributions from long-term holders during the upswings in 2024 and 2025. Now that this buyer is selling, the order book must clear at lower price levels. A slowdown in redemptions would be the first signal of a bottom; a genuine reversal into net inflows is needed for the $82,700 target to be viable.
The flow numbers released after the close of U.S. markets on Thursday will indicate whether the Huang incident pushed IBIT into its tenth consecutive day of outflows.
Liquidation: $1.46 Billion in 24 Hours, of which $1.3 Billion is Longs
The derivatives market accelerated this round of declines. In 24 hours, a total of over $1.46 billion in crypto liquidations occurred, with $1.3 billion hitting longs. During a 20-minute window after the Nvidia announcement, exchanges forcibly liquidated $125 million in long leverage just as Bitcoin pierced below $72,000.
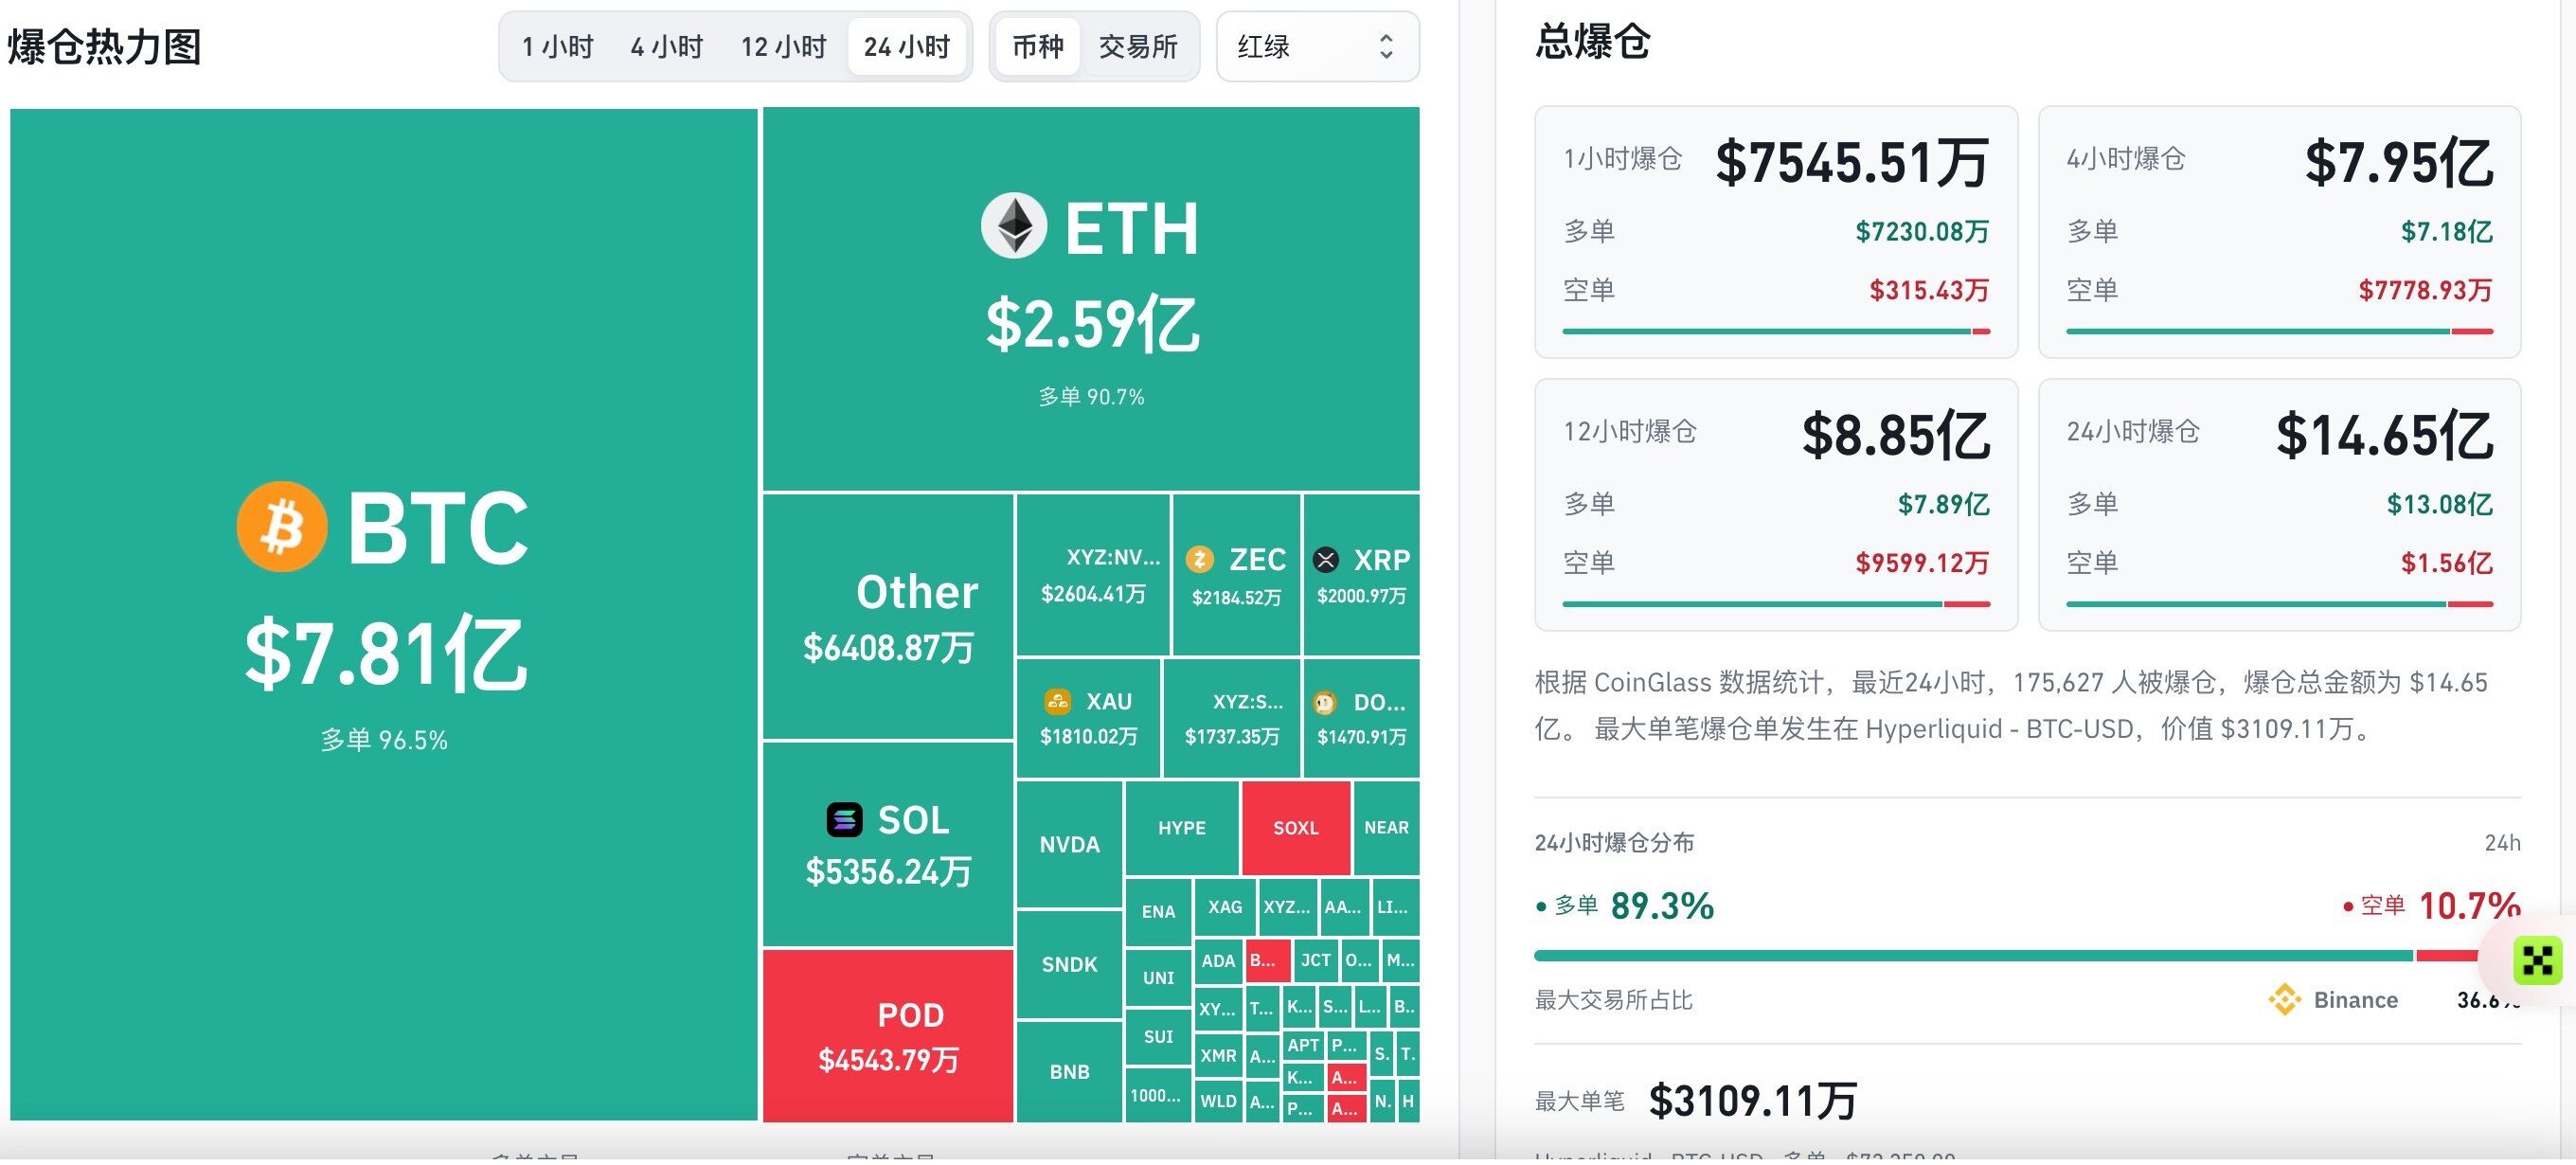
These numbers illustrate who got trapped. Traders who bought the dip to $74,000, betting that Wednesday’s AI rebound would extend into crypto, got buried right there. Leverage piled up just below $73,000—a support area the market had defended since November 10—so as soon as the price broke, stop losses were triggered one after another.
In fact, in the 24 hours before the Nvidia news, the total market liquidation amount had already decreased by 63.67% to $263.7 million, of which longs accounted for 64.5%. Bitcoin futures open interest fell by 2.9%, and trading volume dropped by 27.6%. The market was in a slow deleveraging state at that time. Thursday's shock turned this slow bloodletting into a concentrated clearing.
Even after experiencing this round of liquidations, Bitcoin futures open interest still remains above $50 billion. This keeps another round of cascading risks in play, with a substantial amount of leverage still in the system. If spot prices break below the next support level, a second wave of forced selling could happen as quickly as the first.
However, the structure is two-sided. A market that just cleared $630 million in longs has little forced selling left on the long end. Instead, the shorts accumulated during the downturn may serve as fuel for any rebound. Short liquidations within a 24-hour window are a small portion of the total longs, indicating there is still room for building short positions. If shorts crowd near $71,000, a rapid price reversal back to $74,000 is entirely possible, without needing to change a word of the macro narrative.
Funding rates tell traders which side is crowded. Negative funding rates—where shorts pay longs—have indicated local bottoms several times this year. After Thursday’s clearing, funding rates remain close to neutral, suggesting the market is clearing rather than panicking.
The practical interpretation of the prediction is: Derivatives explain the speed of this downturn, not its direction. The direction comes from spot—ETF redemptions and shrinking stablecoin balances. Leverage only determines how quickly the price reaches the level where the spot capital flows send it.
Stablecoin Supply Decreased by $14.2 Billion in 30 Days: Gunpowder Problem
Money is leaving crypto, with the clearest signal in the stablecoin data. Over the past 30 days, the total supply of stablecoins has decreased by $14.2 billion, the largest 30-day drop since 2022. Stablecoins are the cash balances of crypto. Money first enters USDT and USDC from bank accounts, then buys Bitcoin; when investors leave, the money flows out the same way.
The $14.2 billion withdrawal means investors are not just selling Bitcoin for stablecoins and waiting on the sidelines. They are redeeming stablecoins for dollars and exiting. This money can no longer be used to buy the dip. It's lying in treasury bills yielding over 4%, in money market funds, or has already flowed into stocks.
The interest rate backdrop explains the reason. In an environment where the federal funds target range is 3.75% to 4.00%, and the 10-year U.S. treasury yield is 5.07%, cash can finally yield real returns in this cycle. Stablecoins offer nothing to holders; issuers earn on treasury bill yields. When cash can earn more than 4%, the prospect of using idle stablecoins to buy Bitcoin becomes expensive, causing investors to exit with cash.
Part of the contraction can also be attributed to the Binance hack. On October 29, attackers drained $6.3 billion from Binance's hot wallet, the largest cryptocurrency theft on record. Stablecoin issuers froze about $2.8 billion of the stolen USDT and USDC. The frozen tokens effectively left circulation, contributing to the supply decrease from that freeze and subsequent redemptions in the following weeks.
The total market cap of crypto corroborates the capital outflow. On Thursday, the total market cap dropped 4.57% to $2.43 trillion. Bitcoin accounted for 59.79%. This ratio is high but has not increased, indicating that capital is not rotating from altcoins into Bitcoin as a relative safe haven; instead, it is leaving the entire asset class.
For the prediction, stablecoin supply is the key number to watch for potential bottoms. In every previous sustained Bitcoin upsurge in this cycle, it started with an increase in stablecoin supply—fresh dollars enter the system first before reaching BTC. A flattening in the 30-day change is the first sign of stopping the bloodletting; a return to positive growth will signal to traders that the $82,700 target is financeable.
Before that, every rebound will hit a pool of increasingly scarce cash buyers.
The Macro Wall: 10-Year 5.07%, Dollar Index 103.08, Gold Down 3.39%
Bitcoin's real opponent is the bond market. On Thursday, the 10-year U.S. treasury yield rose 7 basis points to 5.07%. This benchmark first crossed 5% in mid-September and is the highest since July 2007, having reached a closing high of 5.31% on October 5, before oscillating between 4.86% and 5.13%. Each time it returns above 5%, risk assets are depressed within days. Bitcoin has followed this pattern each time.
The dollar has exacerbated the pressure. On Thursday, the dollar index hit 103.08, a new high for the year, as rate hike bets continued to heat up. Bitcoin is priced in dollars; a stronger dollar depresses its price, just as it does with gold. A strong dollar also tightens global liquidity because offshore borrowers owing dollars must sell assets to repay.
The movement in gold is the cleanest evidence. Spot gold dropped $135.70, or 3.39%, to $3,864.80. It fell below $4,000 at the end of October and has not recovered since. If Bitcoin were trading as digital gold, on a day like Thursday the two should diverge—one rises while the other falls. In reality, both fell by nearly the same percentage. Both are being repriced at a 5.07% risk-free rate and a dollar index of 103.08.
Real yields determine this arithmetic. The 10-year inflation-linked treasury (TIPS) reached a real yield of 2.66% at the end of October. Investors can lock in returns above inflation for ten years at 2.66% without credit risk. Bitcoin provides no yields; its value relies completely on future price appreciation. As real yields rise, the needed appreciation for Bitcoin to outperform U.S. treasuries also rises, and the number of buyers willing to take that bet decreases.
The two-year treasury—which is the most closely tied to Fed policy—jumped above 4.69% following Tuesday’s October inflation data. The two-year has the greatest impact on crypto leverage trading rates as it dictates the costs of basis trading and margin financing. The higher short-term rates are, the lower the cash-and-carry trading profits from buying spot Bitcoin while shorting futures become, and part of the ETF outflows represents this position being liquidated.
Bitcoin's macro bottom line is at a 10-year yield of 5%. A sustained drop below 5% would relieve pressure on all zero-yield assets; returning to the October high of 5.31% would bring the lows of 2026 back into focus.
October CPI and the Fed’s Decision on December 8-9: Add 25 or 50 Basis Points
Rate pressures trace back to Tuesday's inflation data. The U.S. Bureau of Labor Statistics reported that October CPI rose 0.4% month-on-month, higher than the 0.3% consensus; core CPI rose 0.3%, above the 0.2% forecast. Core has recorded 0.3% for three consecutive months—in August, September, and October. Annualized, this translates to a core growth rate of 3.7%, far higher than the 2.6% core annual rate reported in September.
As the government shutdown in 2025 caused the BLS to be unable to collect prices for October 2025, the agency did not release year-on-year figures. The market can only rely on monthly readings, both of which are on the hot side. Energy rose 0.7%, food increased 0.5%, motor vehicle insurance rose 0.7%, and entertainment increased 0.8%. Gasoline prices surged by 37.4% year-on-year.
Bitcoin reacted in the spot market. Within five minutes after the data release at 8:30 AM on Tuesday, BTC dropped from $74,264 to $73,494, a drop of $770, and has not returned above $74,264 since. It fell below $72,000 on Thursday, continuing the trend initiated by that data.
The Fed's position makes December a real decision month. The central bank raised the target range to 3.75% to 4.00% on September 16, marking the first rate hike of 2023. On October 28, it voted 10 to 2 to keep rates unchanged, with two dissidents advocating for a rate increase. Fed Governor Christopher Waller stated on Tuesday morning that if core CPI reaches 0.3% or higher, December should consider adding 50 basis points. Several hours later, it printed exactly 0.3%.
Following the October jobs report (strong wage growth, unemployment rate dropping from 4.2% to 4.1%), the probability of a December rate hike has risen to 75% to 80%. The question is no longer whether the Fed will raise rates on December 8-9, but rather by how much. For Bitcoin, the difference between 25 and 50 basis points is substantial: a 50 basis point hike would push two-year yields even higher, further tightening dollar liquidity and squeezing the leverage trades that support crypto prices.
The next input is arriving soon. On Friday at 8:30 AM Eastern, the October Producer Price Index will be released, with economists already estimating a 0.4% rise in the Fed’s preferred core PCE index for October. The November jobs report arrives on December 4, and November CPI is set for December 10, the day after the decision. If Friday’s PPI comes in soft, the 50 basis point scenario will be removed from the table, offering Bitcoin space to rebound to $75,000.
Employment Data: Initial Jobless Claims at 200,000 Keep the Fed from Acting
Thursday’s employment data provided no relief for Bitcoin. The U.S. Labor Department reported that for the week ending November 7, seasonally adjusted initial jobless claims increased by 9,000 to 200,000, higher than the consensus of 195,000. The prior week's data was revised from 189,000 to 191,000, with the four-week moving average maintaining at 195,250.
For the week ending October 31, continued jobless claims decreased by 20,000 to 1.697 million. A decrease in those receiving unemployment benefits signals that laid-off workers are finding new jobs quickly. This indicates a solid labor market, not one that is weakening. Since mid-September, initial jobless claims have remained at or below 200,000 each week, with the 189,000 from mid-July being the lowest since 1969.
On an unadjusted basis, initial jobless claims increased by 28,870 to 206,982, below the model's expected 11% seasonal increase. A year ago in the same week, claims were 238,729. Layoff levels are over 30,000 lower than the previous year.
For Bitcoin, the connection is transmitted through the Fed. Such a tight labor market gives the central bank no reason to stop rate hikes. Every strong employment figure boosts Treasury yields, lifts the dollar, and raises the threshold for zero-yield assets. In this cycle, bad economic news is bad news for Bitcoin because it postpones the moment when the Fed can shift towards easing and liquidity can flow back into speculative assets.
This structural argument is critical for mid-term forecasting. Part of the drop in initial jobless claims might reflect a contraction of labor following tightened immigration, meaning fewer people are eligible to apply. Regardless of the cause, the policy effect is the same: a tight labor market transmits wage pressures to service inflation, which will keep core CPI printing at 0.3% monthly.
Bitcoin's bullish case needs cracks in the labor market. Consistently high initial jobless claims above 230,000 for a period, or negative non-farm employment numbers on December 4, would shift the Fed’s debate from rate hikes to holding steady, and holding steady is precisely what enables the 10-year yield to drop back below 5%. This chain from weakening employment to Fed pauses to declining yields to a weakening dollar is the macro pathway towards $82,700.
Thursday's 200,000 did not trigger this chain. It kept the Fed on the path of rate hikes and kept all zero-yield assets under pressure.
Strategy’s MSCI Exclusion and Corporate Treasury Suppression
The largest corporate holder of Bitcoin is facing its forced selling just as ETF outflows increase. MSCI has confirmed that it will remove MicroStrategy (MSTR) from its benchmark equity index in the November 2026 index review, effective at the close on November 30. The stock was down 7% on Thursday, hit by both the index decision and Bitcoin’s 3.41% drop.
This rule targets "non-operating companies" with assets primarily consisting of treasury holdings. According to MSCI's rules adopted on October 15, existing index constituents will be removed if they do not meet eligibility screening in the last two annual reporting periods. Using data from May 2026, MicroStrategy, Japan's Metaplanet, and the UK's uranium holding company Yellow Cake were flagged.
MicroStrategy estimates that funds tracking the MSCI All Investable Market Index hold about 13 million shares, accounting for 3.1% of its basic issued shares. The forced sell-off is estimated to be between $1.8 billion and $2.8 billion, and could go as high as $8.8 billion if other index providers follow MSCI. This sell-off hits MSTR stock, not Bitcoin. Index exclusion will not force MicroStrategy to sell its 848,250 BTC.
However, the indirect link to Bitcoin is real. MicroStrategy's model is to issue shares and preferred stock at a premium above its net asset value, using the raised funds to buy more coins. Passive index demand supports this premium. Losing MSCI constituent status will narrow the investor base, tighten the premium, lower the efficiency of new share offerings, and consequently slow down coin purchases. MicroStrategy has already sold Bitcoin this year to repurchase its STRC preferred stock, marking its first substantial sell-off in history.
That sell-off changed the market’s perception of treasury company models. When MicroStrategy was an insensitive price buyer, it acted as a floor for Bitcoin. A MicroStrategy that sells coins to meet cash obligations has the opposite effect. MSTR is far below its $543 peak in November 2024; its stock price relative to its coin ownership premium has compressed, and whether the company can continue buying depends on how the market views its capital structure.
Metaplanet faces similar index risks, as the treasury company category as a whole has lost its role as a stable buyer. For predictions, this removes a key support for the rise in 2025. The effective date of November 30 is the next pressure point since index funds tend to sell before the close on rebalancing days.
The Hanging Threat of the Binance Hack: 18,270 BTC and Unresolved Supply Risks
Two weeks later, the Binance hack still looms over the market. On October 29, attackers drained $6.3 billion from Binance's hot wallet, involving ten blockchains, mostly occurring within about 20 minutes starting at 20:05 UTC. This was the largest cryptocurrency theft on record, quadrupling the $1.5 billion Bybit hack in February 2025. Blockchain intelligence firms attribute this attack to North Korea's TraderTraitor group.
The Bitcoin portion is the most important. The attackers took away 18,270 BTC, valued at $1.47 billion at the time of the theft and worth $1.3 billion at Thursday's price of $71,393. None of these coins were frozen. Stablecoin issuers can freeze USDT and USDC at the contract level, while about $2.8 billion of stolen stablecoins were locked down; Bitcoin has no central issuer able to do this.
The attackers still control assets worth about $3.33 billion that cannot be frozen by any issuer and are distributed across about 43 addresses, including those 18,270 BTC and 511,861 ETH. This is a known supply constraint. North Korean hacker groups have history in laundering stolen cryptocurrencies through mixers, cross-chain bridges, and over-the-counter trading, which can take weeks to months, and sell out during any moment of liquidity. Each significant on-chain movement from these addresses becomes a headline for market reaction.
The direct scale is manageable. The 18,270 BTC account for less than 0.1% of the circulating supply and less than a fraction of daily spot trading volume. The impact is more significant regarding confidence. This attack occurs at a moment when the Justice Department is scrutinizing Binance's 2023 plea agreement and $4.3 billion settlement arrangement. Any regulatory action against the world's largest exchange would impact liquidity across the entire crypto market since Binance hosts a substantial portion of global spot and derivatives volume.
Binance has stated it will use its own funds and its Secure Asset Fund for Users reserves to compensate for all losses—this fund holds 15,000 BTC since converting from stablecoins in February 2026. If Binance must sell some reserves to cover the shortfall, that effectively increases supply; if it covers with funds from other companies, then the Bitcoin remains in place.
For predictions, this hack represents background risk, not a main driving factor. It exacerbates the confidence shock that began at the end of October—when Bitcoin broke below $77,000—and also makes traders hesitant to aggressively buy while the stolen coins are still moving.
Technical Structure: Breaking All Daily EMA and Lower Bollinger Band
The charts confirm the extent of the damage. Bitcoin stands at $71,393, below three key daily exponential moving averages. The 20-day EMA is at $77,435.51, the 50-day at $78,904.51, and the 200-day at $76,229.59. The price is $4,836 below the 200-day line, a 6% gap. The 200-day line lies below the two shorter moving averages, indicating a market that had risen all through October before sharply reversing course.
Bitcoin has also fallen below the daily Bollinger Band's lower band of $72,953.74. The middle band is at $77,826.84, and the upper band is at $82,699.94. Closing outside the lower band indicates selling pressure exceeds the normal volatility range of the market. Prices typically do not stay outside the band for long; they either swiftly return inside the band or the band expands to encompass them. In either case, it confirms the strength of the sellers.
Momentum has already stretched. The hourly RSI dropped to 26.6, deep in the oversold territory. The 14-day RSI is at 34.2, close to oversold but not yet there. The 30-day annualized volatility is at 36.1%. By Bitcoin's standards, this reading is moderate, indicating the market has yet to show the usual surges in volatility that signal capitulation bottoms.
The support map is clear. The $72,700 to $73,000 range held earlier this week has now broken, turning into resistance. Below the current price, $70,000 represents a round number where options positions and short-term holders’ cost bases accumulate. Further down, the $65,000 range marks the 2026 low from earlier this year when large-scale liquidations and options demand occurred around the $60,000 and $50,000 strike prices.
Altcoins and the Broader Crypto Market: Ethereum Falls Below $2,000
The sell-off is impacting the entire crypto market, not just Bitcoin. Ethereum briefly fell below $2,000, trading at $2,002, down 2.63% for the day. In this cycle, the value lost by ETH exceeds that of Bitcoin. The Binance attackers hold 511,861 ETH, and the U.S. spot Ethereum ETF saw an outflow of $144.81 million on November 11—this second-largest token is bearing both supply constraints and institutional demand issues.
The other mainstream coins followed suit. BNB fell 4.05% to $652.43, still well below the $739 it traded at before the Binance hack. XRP dropped 3.8% to $1.02, just above the psychological support of $1. Solana fell 3.48% to $80.94. Dogecoin fell 4.96% to $0.06479, while Cardano dropped 4.7% to $0.1686. TRON is the only mainstream coin close to flat, down 0.33% to $0.3155.
This pattern reveals where the money has gone. Altcoins with higher betas than Bitcoin are falling more than BTC, which is a typical risk-averse behavior in the crypto market. Bitcoin's 59.79% share indicates that investors are not rotating into Bitcoin as a relative safe haven—if that were the case, the percentage should be rising. The reality is that money is leaving the entire crypto complex, and the higher-risk coins are suffering more.
The total crypto market cap fell 4.57% to $2.43 trillion, with Bitcoin accounting for $1.44 trillion. The remaining $990 billion is distributed among thousands of tokens, which are the most vulnerable to further sell-offs due to thinner order books and fewer institutional holders.
For Bitcoin's predictions, the altcoin market has twofold significance. First, the liquidation of altcoins will hit margin accounts that also hold Bitcoin; an altcoin collapse could trigger forced sell-offs of Bitcoin. Second, rebounds typically start with Bitcoin before spreading to altcoins. If Bitcoin holds above $70,000 while its share starts rising above 60%, it indicates that funds are returning to crypto via Bitcoin—past rounds of recoveries have always started this way.
Ethereum's $2,000 line is the level to watch at the altcoin level. Closing below it will trigger more ETH margin position liquidations and could also drag Bitcoin below $70,000; regaining $2,100 would relieve overall pressure.
Price Predictions and Conclusion: $70,000 Floor, $82,700 Upside Target
The forecast boils down to three tiers.
The bear market path is a daily close below $70,000. That would break through the integer levels where options positions and short-term holders’ cost bases accumulate, triggering another round of long liquidations amidst an environment of over $50 billion in open interest, and bringing the $65,000 range into view. The triggers for this path are all on the calendar: Friday's hot October PPI, IBIT's tenth consecutive day of outflows, and the 10-year yield returning to around the October high of 5.31%.
The baseline path is a range between $70,000 and $75,600. Bitcoin has stretched below the lower Bollinger Band of $72,953, with the hourly RSI at 26.6; markets in this state typically return inside the band before re-selecting direction. A rebound to test broken supports around $73,000 to $75,000 is the most likely short-term move, with sellers waiting there. The conditions for this range's establishment are a slowdown in ETF outflows without turning into inflows, combined with the 10-year yield staying around 5%.
The bull market path is reclaiming the cluster of moving averages between $76,230 and $78,905, which would open the upper Bollinger Band of $82,700. From $71,393, this is a 16% rise, which falls within the normal volatility range of Bitcoin over a month-long window. It requires three things to happen simultaneously: a positive shift in spot ETF flows, starting with IBIT stopping its consecutive outflows; stablecoin supply ceasing to shrink; and the 10-year U.S. Treasury yield dropping back below 5%—this most likely requires Friday’s soft PPI, weakness in employment data on December 4, or a 25 basis point hike on December 9 with a signal that "this is the last one."
Several catalysts could accelerate the bull scenario. A clean Nvidia earnings report on November 17 would stabilize the AI liquidity complex that Bitcoin follows. The accumulated shorts from breaking below $72,000 would become the fuel for squeezes. A reading of 28 on the Fear & Greed Index allows for emotional resets.
The judgment on Bitcoin is short-term bearish, but the recovery path is clear. Thursday's drop below $72,000 confirmed Bitcoin’s status as a high-beta liquidity asset—trading down alongside gold and Nasdaq under a 5.07% 10-year yield and a dollar index of 103.08, rather than being used to hedge them. Jensen Huang's departure serves as the fuse. The fuel comprises the $1.44 billion in ETF redemptions over five trading days, IBIT's $2 billion in outflows over nine days, the $14.2 billion contraction in stablecoin supply, and a Federal Reserve debating whether to raise rates by half a percentage point. The $70,000 line determines whether this is a deep pullback or the start of a new downturn. The $82,700 upside target still stands, but only if capital flows turn; before ETF demand returns, every rebound towards $75,000 is a selling opportunity for the market's biggest holders.
免责声明:本文章仅代表作者个人观点,不代表本平台的立场和观点。本文章仅供信息分享,不构成对任何人的任何投资建议。用户与作者之间的任何争议,与本平台无关。如网页中刊载的文章或图片涉及侵权,请提供相关的权利证明和身份证明发送邮件到[email protected],本平台相关工作人员将会进行核查。


