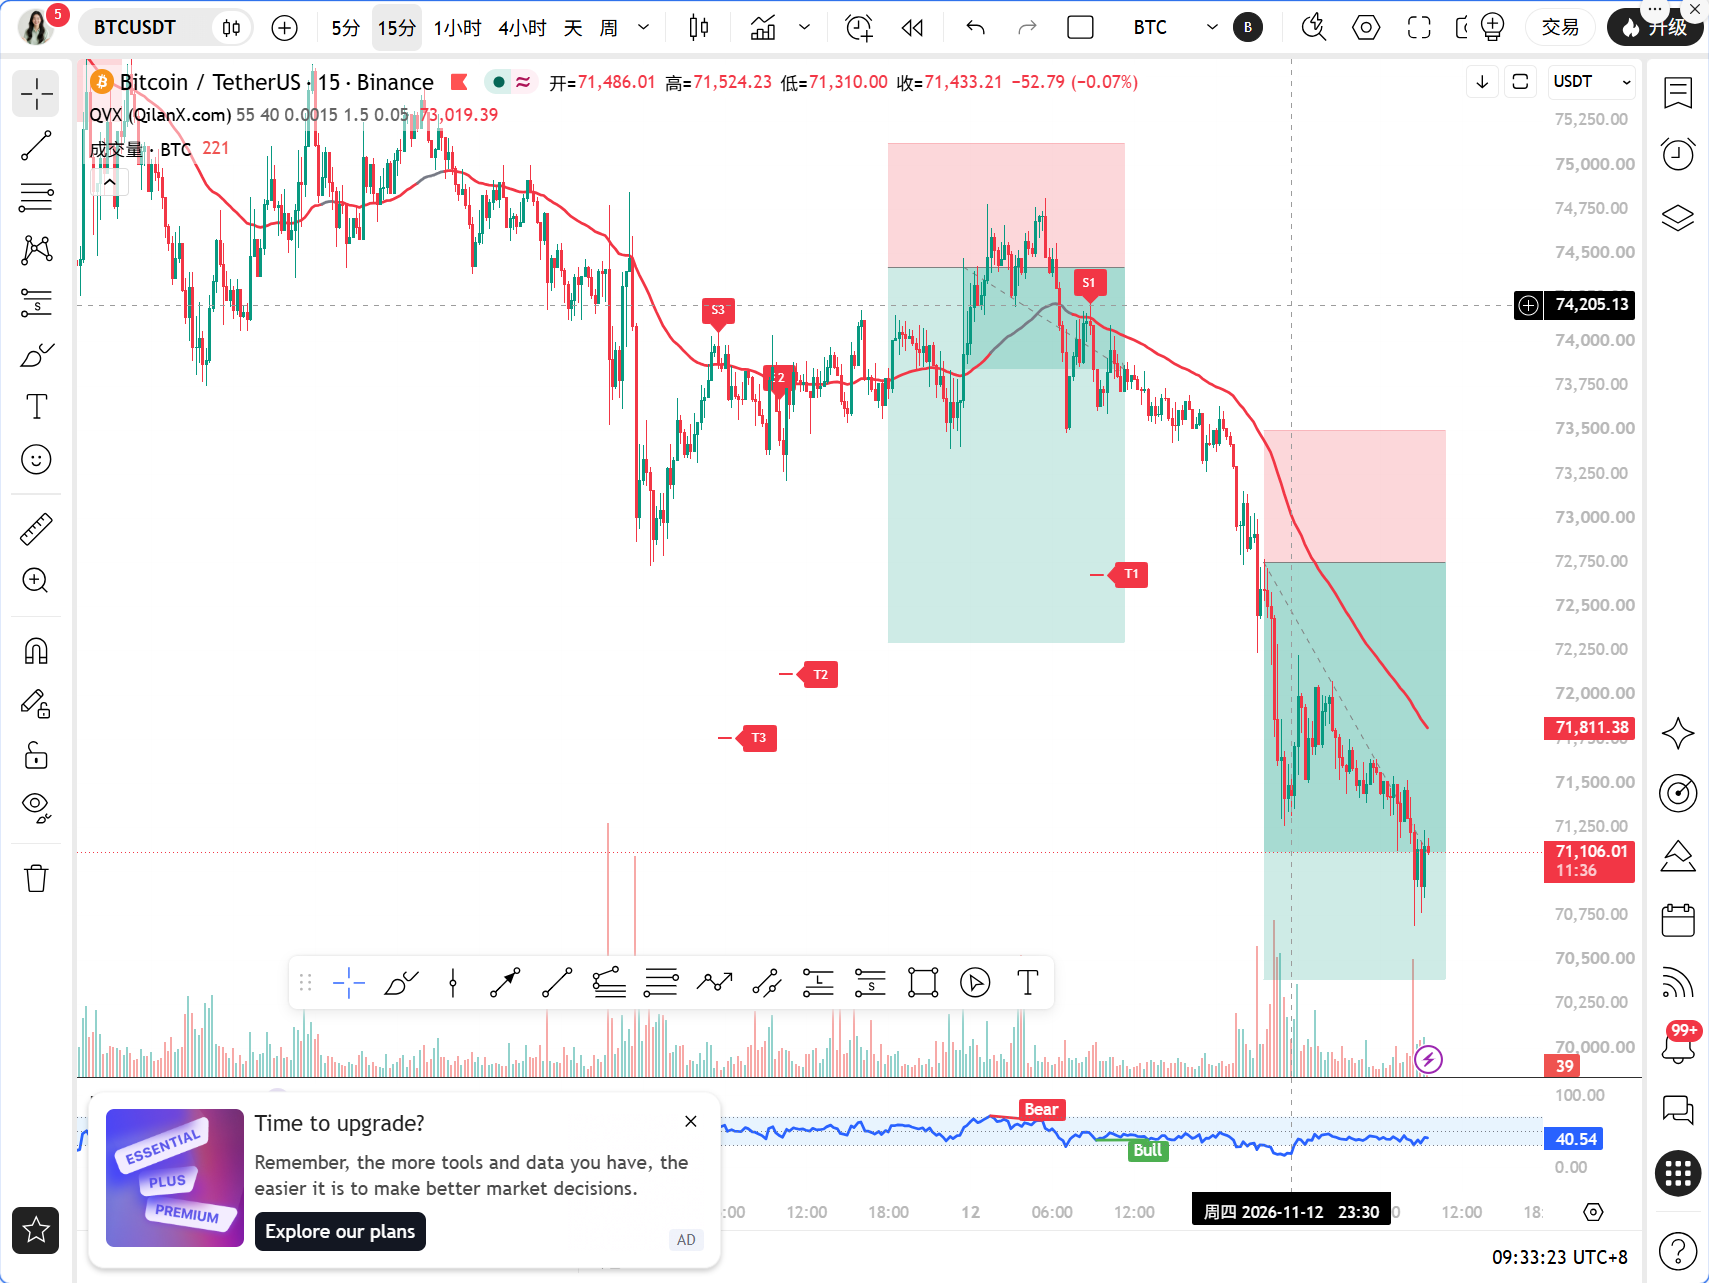
Two messages must be highlighted first this morning. The first is that the U.S. core CPI exceeded expectations for the third consecutive month in October, with stubborn inflation directly reinforcing tightening expectations. Federal Reserve member Harker even called for a shift to restrictive monetary policy, which will significantly suppress liquidity in the cryptocurrency market. The second is that NVIDIA's market capitalization has fallen below $4 trillion for the first time since July 2025. Combined with Jensen Huang stepping down as CEO and the Justice Department's antitrust investigation, AI weighted stocks plummeted, dragging risk assets down. Bitcoin has been struck down to 71183 USDT in this context, reaching a new low since September. Sister Qinglan has repeatedly emphasized in the Qinglan Crypto Classroom that when macro liquidity tightens and risk appetite contracts, one should avoid catching falling knives lightly and pay attention to the structure.
Current Price and Time
The time is November 13, 09:32, and Bitcoin is priced at 71183 USDT, with a 24-hour decline of 4.03%. The Fear and Greed Index is at 20, in the extreme fear range. BTC market share is 59.36%, indicating that funds are concentrating on Bitcoin for risk aversion, but overall market sentiment is contracting.
Multi-Cycle Status Overview
First, look at the daily chart. Daily MA5 = 73164.56, MA10 = 74897.79, MA30 = 78570.82; the moving averages are in a very standard bearish arrangement, with the price operating below all moving averages. Daily MACD shows DIF = -2320.53, DEA = -1793.75, histogram = -526.79; the negative histogram is still expanding with no signs of convergence. Daily RSI = 31.86, close to oversold but not extreme yet. The daily level is clearly in a bearish trend, this is undisputed.
Next, look at the 4-hour chart. 4-hour MA5 = 71799.47, MA10 = 72886.76, MA30 = 74090.70; again, it's a bearish arrangement. 4-hour MACD shows DIF = -972.59, DEA = -755.19, histogram = -217.40; the negative histogram is expanding. 4-hour RSI = 23.86, already in deep oversold territory. It should be noted that an oversold 4-hour reading does not mean an immediate rebound; in trending markets, RSI can stay low for a long time, but at least it indicates that the room for further sharp declines is being compressed.
The 1-hour chart is the core cycle of the TPV system. 1-hour EMA55 = 73046.28, current price 71183 USDT, the distance to EMA55 is 2.55%, with the price below EMA55. 1-hour MA5 = 71349.01, MA10 = 71529.31, MA30 = 72817.58; this also is in a bearish arrangement. 1-hour MACD shows DIF = -646.68, DEA = -587.26, histogram = -59.43; the negative histogram is still present but needs to be watched for potential shortening. 1-hour RSI = 17.55, which is an extremely oversold reading, very low.
On the 15-minute level, MA5 = 71064.12, MA10 = 71197.50, MA30 = 71453.27; the price hovers near MA5, with short cycles showing signs of stabilization but with very weak strength. 15-minute MACD shows DIF = -181.42, DEA = -176.69, histogram = -4.73; the negative histogram has shrunk to a very small size, and the 15-minute RSI = 42.58 has rebounded from low to a weak neutral area. The short cycle is attempting to recover, but it's too early to talk about a reversal.
TPV Signal Verification
Complying with the rules of the Qinglan TPV system, we check each point. In terms of trend positioning, the current price of 71183 USDT is clearly below the 1-hour EMA55 of 73046.28, indicating a bearish trend area, which is clear.
Short-selling condition verification: First, the price is under pressure below the 1-hour EMA55, and the past 8 hourly close prices above EMA55 equal 0/8, with zero crossover occurrences, and this condition of consecutive closes below EMA55 is completely met. Second, resistance formation; the price falls back after touching an effective high during the decline process, which is compliant. Third, there is insufficient rebound; the 1-hour MACD negative histogram is still present but needs to be observed for continuous shortening, and the RSI falling from a high to 17.55 represents a very weak state, with momentum favoring the bears but already entering an extreme zone. All three conditions are simultaneously met, establishing a bearish signal.
However, Sister Qinglan wants to remind a key point: Oscillation auxiliary data shows that the current price is at an absolute distance of 2.55% from EMA55, which does not meet the oscillation threshold within 0.3%. The past 8 close prices above EMA55 equals 0, with zero crossovers, so the system assesses it as a one-sided trend rather than oscillation. This means the trend direction is clearly downward, but it also indicates that the price is far from the moving average, worsening the risk-reward ratio for shorting. An extreme reading like 1-hour RSI = 17.55 often corresponds to a window for short-term rebounds or sideways repairs in history; shorting should wait for a rebound to resistance levels before considering, rather than directly chasing in an extreme oversold area.
On-Chain/Funding Situation
The Fear and Greed Index is 20, indicating extreme fear. This reading, in the historical statistics of the Qinglan Crypto Classroom, often appears near phase bottom areas, but extreme fear can persist, not constituting a standalone reversal signal. BTC market share is 59.36%, indicating that funds are concentrating on Bitcoin, while altcoins are under heavier pressure. A 24-hour decline of 4.03% is classified as a moderately strong drop. On the news front, there are mixed signals: bearish factors include core CPI exceeding expectations three times, NVIDIA's market value dropping below $4 trillion, Jensen Huang stepping down, and hawkish statements from the Federal Reserve; bullish factors include OpenAI completing $15 billion in financing, AI concept stocks collectively rising, Binance reserve rate exceeding 100%, and the Justice Department and chambers of commerce opposing digital asset taxes. Overall, macro tightening is the dominant contradiction, while the rebound in the AI sector is a local repair that is still insufficient to reverse the weakness of risk assets.
Key Attack and Defense Levels
The first resistance above looks at around 71349 near the 1-hour MA5, the second resistance at 71529 at the 1-hour MA10, and the core resistance at 73046 at the 1-hour EMA55; this position is the dividing line for bulls and bears in the TPV system. If the price cannot stand above it, it will remain in a bearish structure. Below, the first support is at the psychological level of 71000, which is also near the 15-minute MA5. Further down, we look at the range of 70500 to 70000, with 70000 being an important psychological and technical double barrier. If 70000 is lost, lower space will open up, but in the context of extreme fear and a 1-hour RSI of 17.55, the probability of bullish resistance appearing around 70000 is not low.
Trading Ideas
Direction: Focus on shorting during rebounds in a bearish trend, and do not recommend directly chasing shorts in extreme oversold areas, nor do I suggest counter-trend bottom fishing.
Entry Conditions: Wait for the price to rebound to the 71500 to 71700 range, which is between the 1-hour MA10 and MA30, while observing if the 1-hour MACD negative histogram expands again, and whether the RSI retreats from rebound high positions. Enter short after confirming with long upper shadows or top formations. If the price directly breaks below 70500 and confirms with a 1-hour close, one can wait for a pullback to 70500 to 70700 without missing it for a light follow-up, but positions should be controlled.
Stop Loss: Set the stop loss for the rebound short above 1-hour EMA55, specifically refer to the range of 73100 to 73200, which is a bit above EMA55 of 73046, leaving some buffer to prevent false breakouts from triggering stop losses.
Target Position: First target at 70500, second target at the integer level of 70000, third target at 69500. After reaching the first target, it is recommended to reduce half of the position, and use a trailing stop to protect the remaining position.
Risk Warning: After the core CPI exceeds expectations, the market's pricing of the tightening path may continue to ferment, but the extreme oversold reading of 1-hour RSI 17.55 may trigger technical rebounds at any time. Both short chasing and bottom fishing should strictly carry stop losses and manage positions.
Follow the Qinglan Crypto Classroom and seize more trading opportunities together! Welcome to visit the official website www.qinglan.org
📊 Qinglan TPV Trading Strategy Backtest Reference
🕒 Last Backtest Time 11-13 07:00:02
Total Analysis: 5080 Backtest: 5070 Accuracy Rate: 75.6% (3834/5070)
免责声明:本文章仅代表作者个人观点,不代表本平台的立场和观点。本文章仅供信息分享,不构成对任何人的任何投资建议。用户与作者之间的任何争议,与本平台无关。如网页中刊载的文章或图片涉及侵权,请提供相关的权利证明和身份证明发送邮件到[email protected],本平台相关工作人员将会进行核查。