Cryptocurrency Scholar: November 13 Bitcoin (BTC) Oversold Does Not Mean Bottom: After the daily line breaks the lower rail, three confirmation signals that the technical aspect really needs to wait for
Short-term profits come from rhythm money, not from guessing bottoms or tops. When you're itching to trade, ask yourself first: Is the position reached? Is there a signal? Is the stop loss set? If you can't answer any of these three questions, don't act. Rebounds after a sharp drop are most deceiving; they look like reversals but are actually just taking a breath. Don't chase longs after a big bullish candle, and don't chase shorts after a panic sell-off; wait for the price to reach the planned position before acting
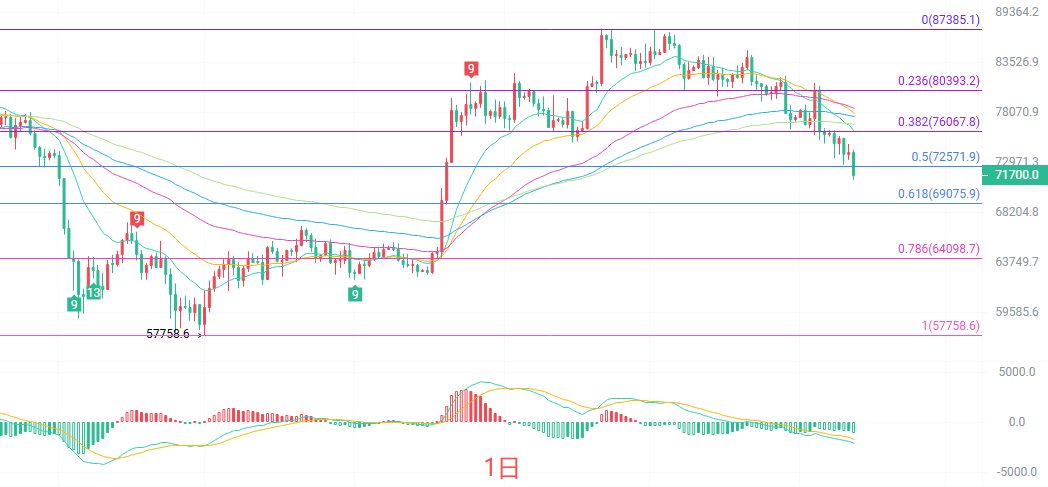
The daily candlestick is a medium bearish line with a lower shadow. The five EMA lines are all arranged above the current price, a typical bearish pattern, with the price not able to reclaim even the shortest EMA15. In terms of MACD, the double lines continue to open below the zero line, and bearish momentum is still being released. The Bollinger Band middle line is at 77329, upper line at 82569, lower line at 72088, and the current price of 71930 has broken below the lower rail, indicating a short-term oversold condition, but oversold does not mean the bottom is in. The overall daily line level is still a structure where rebounds are under pressure and the center of gravity is shifting downward; stabilization signals have not yet appeared
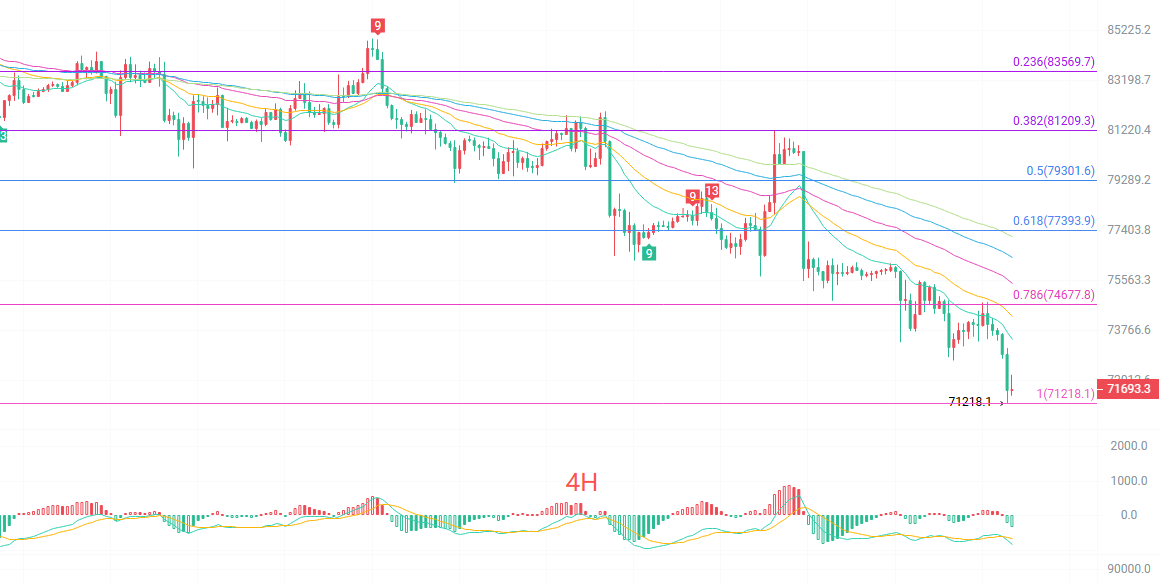
The four-hour candlestick is a small bullish line with a slight rebound. The price is running below all moving averages in a bearish arrangement. MACD has converged compared to the previous sharp drop, indicating that the pace of short selling has slowed, and there is a technical rebound demand; however, the double lines are still below the zero line, and the rebound is more inclined to be a repair during the downtrend, and it’s not yet talking about a trend reversal. The Bollinger Band lower rail is at 72000, middle rail at 73890, upper rail at 75781, and the current price is right on the edge of the lower rail. The TD indicator shows 6, the pullback count has not yet completed, and the strength of the rebound needs to be observed to see if it can re-establish itself above the short moving average around 73400
Short-term reference:
Going up from 71200 to 70700 faced resistance, stop loss 500 points, target looks at 72000 to 73000
Going down from 73500 to 74000 stagnated, stop loss 500 points, target looks at 73000 to 72000
Specific operations mainly rely on real-time market data; more information can be consulted from the author. The publication of the article has a delay, suggestions are for reference only, and risks are borne by the reader.
Warm reminder: The above content is synchronized and updated on major trading platforms such as Binance, OKEx, Huobi, etc., and more content can be found by adding me as a friend in my fan group on Binance OKEx
免责声明:本文章仅代表作者个人观点,不代表本平台的立场和观点。本文章仅供信息分享,不构成对任何人的任何投资建议。用户与作者之间的任何争议,与本平台无关。如网页中刊载的文章或图片涉及侵权,请提供相关的权利证明和身份证明发送邮件到[email protected],本平台相关工作人员将会进行核查。