Scholar in the cryptocurrency circle: On November 13, Ethereum (ETH) daily candles have continuously pressed down, and the four-hour chart shows weak recovery: the boundary between long and short is clear, who will pick up at the 2000 integer level?
As we get closer to the support zone, we should change the term "buy the dip" to "trial and error." No one can buy at the lowest point; all we can do is to test the waters with a small position at a relatively low level. If it's wrong, the loss will be small; if it's right, we can increase the position. Don't rush in with a full position at the first sign of a rebound, and don’t lose heart at the first sign of a pullback. The daily line has not completely turned strong, and the four-hour chart only shows signs of stopping the decline; signals need to be confirmed step by step. If you have positions, first figure out where your stop loss is; a small position can afford such a loss.
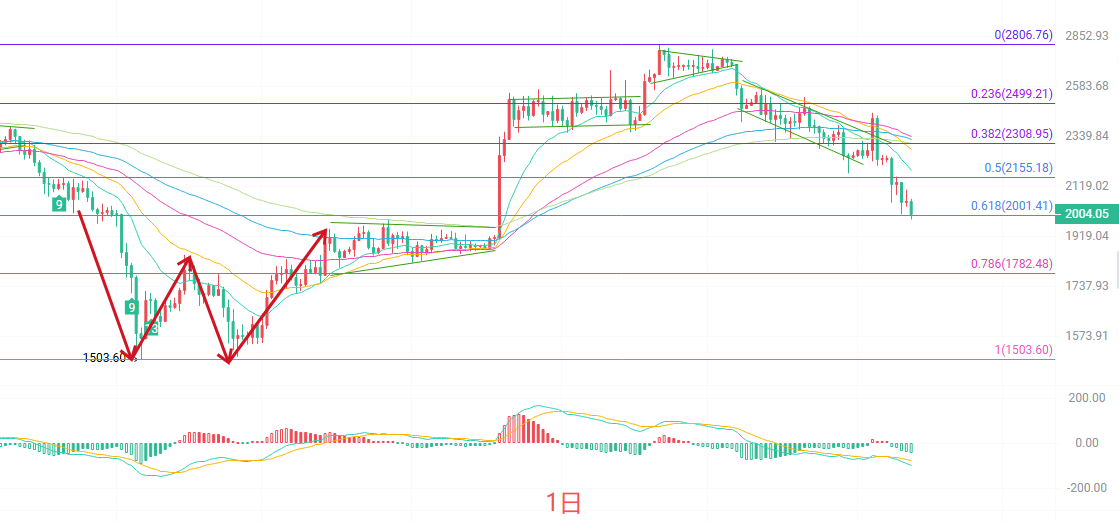
Since the high point of the daily candlestick has retraced, it has continuously formed bearish candles and the price has fallen below several EMA short and medium-term moving averages. The EMA90 and EMA120 report at 2306 are forming layers of pressure above. The MACD double lines are below the zero axis and the green histogram continues, indicating that the bearish momentum has not yet significantly weakened. The Bollinger Bands are opening downwards, with the price approaching the lower boundary of 2022; the overall daily structure still remains a weak correction. We need to observe whether the 1980 level can hold in the short term; if it breaks down, the space below will open further.
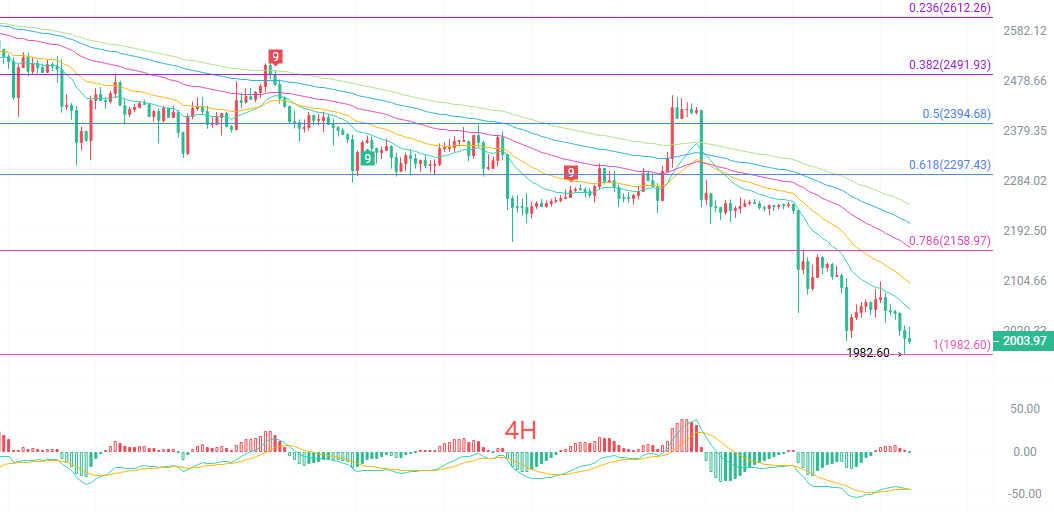
After probing the short-term low at 1982, the four-hour candlestick saw a slight rebound, but the price is still running below the EMA15, EMA30, and EMA60. The EMA90 reports at 2207 and EMA120 reports at 2242 press down further, with the moving averages showing a bearish arrangement. The MACD green histogram has converged, and the double lines are sticky at low levels, indicating short-term signs of stopping the decline and consolidation, but no clear golden cross reversal has formed yet. The lower Bollinger Band is at 1990, and the price is running between the middle and lower bands, signaling a weak recovery after a decline at the four-hour level. If the rebound fails to reclaim the 2058 line, it still leans towards weak fluctuations.
Short-term reference:
For a move north from 1960 to 1930, faced resistance, stop loss at 30 points, target looking at 2000 to 2050.
For a move south from 2050 to 2100, stalling, stop loss at 30 points, target looking at 2000 to 1950.
Specific operations should rely on real-time market data; for more information, you can consult the author. The publication of the article may have a delay, and the suggestions are for reference only; risk is borne by oneself.
Warm reminder: The above content is simultaneously updated by the Scholar in the cryptocurrency circle on major trading platforms like Binance, OKEx, Huobi, etc. For more content, you can add me as a friend and join my fan group on Binance OKEx.
免责声明:本文章仅代表作者个人观点,不代表本平台的立场和观点。本文章仅供信息分享,不构成对任何人的任何投资建议。用户与作者之间的任何争议,与本平台无关。如网页中刊载的文章或图片涉及侵权,请提供相关的权利证明和身份证明发送邮件到[email protected],本平台相关工作人员将会进行核查。