Liying Chat Currency: Latest Market Analysis of 11.13 Bitcoin (BTC) and Ethereum (ETH)
Family! The current price of Bitcoin is 71400, which is just below the lower Bollinger Band at 72245, walking right on the floor. Many people ask: Is it done falling? To be honest, no one can predict it 100%, but looking at this 2-hour chart, the bears have sold off most of what they needed to sell. Next, there will either be a violent rebound or digging another pit. The key is not to operate recklessly when emotions are at their worst. Understanding the structure is a hundred times more important than guessing tops and bottoms. All three EMA moving averages are pressed above, indicating a standard bearish arrangement, which suggests that the trend has not turned bullish yet. In terms of MACD, momentum is bearish but there are signs of softening. The BOLL middle track is 73637, the lower track is 72245. The price dropping below the lower track is considered oversold. Historically, such breaks below the track without a return often accompany short-term rebounds. In summary: the trend is bearish, the momentum is bearish, and the position is oversold, which is a typical combination for the end of a decline.
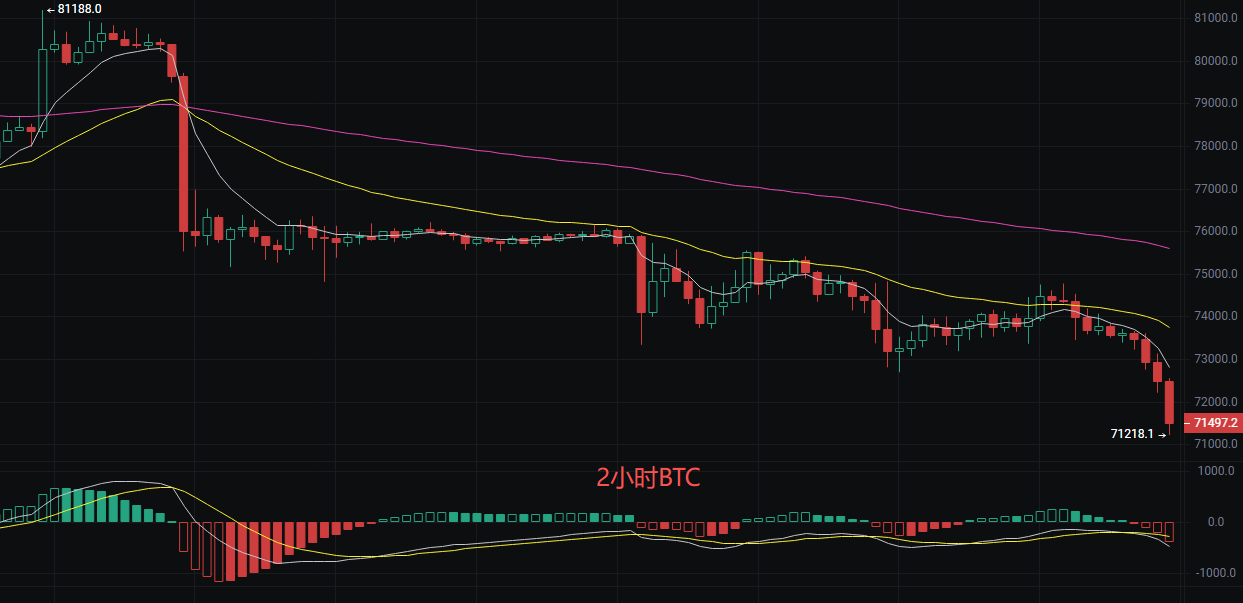
Long Position: Enter lightly at 71000–71300, stop loss at 69800, target 72245→72700, reduce position by half at 72700.
Short Position: Sell partially at 72700–73000 during the rebound, stop loss at 73800, target 71200→70500.
Discipline: Position less than 20%, stop-loss orders not manual. Currently, it is a weak rebound, not a reversal. Do not heavily stake on one side.
Ethereum
Family, the current price of Ethereum is 2000, just one word: tragic. From 2449, it has plummeted to 1982, meaning those who chased in high are seeing a direct 20% shrink in their account. Who wouldn't feel cold seeing that? But you must understand, the harder it falls, the closer the opportunity is; it's just not the time to catch the knife yet. The price is already close to the lower track, and all moving averages are positioned above, indicating that the bears are still in control. The truly smart approach is not to guess the bottom, but to wait for it to express itself: either it will rally back with volume above 2050, or it will be smashed again to clear out the panic selling. The entire moving average system is in a comprehensive bearish arrangement: EMACD indicates a deceleration in the downtrend, not a confirmation of a reversal. The Bollinger Band middle track is 2053, lower track is 2010, with the current price at 1999 having fallen below the lower track, classified as oversold. There is a short-term need to repair the middle track, but the downward opening means the trend is still weak. In summary: short-term conditions for a technical rebound exist.
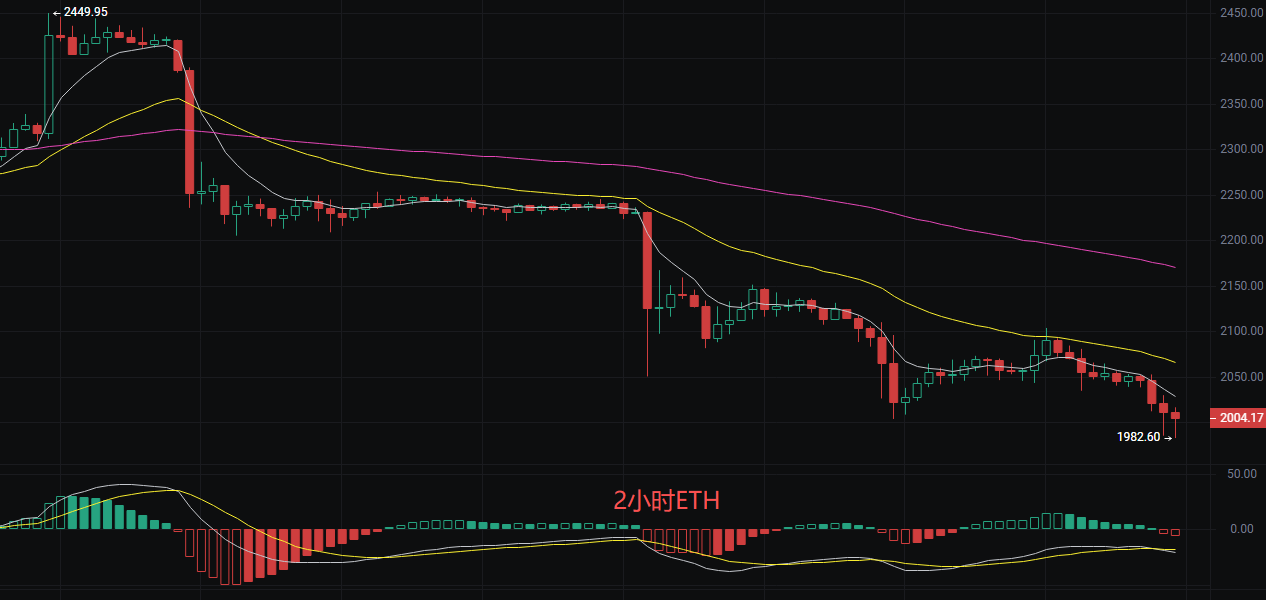
Long Position: Aggressive traders can try a light long at 1980–1990, stop loss at 1955, target 2050→2065, reduce by half at the target; conservative traders can wait to see if it returns to 2030 without breaking before entering, stop loss at 2005, target 2090.
Short Position: Sell partially at 2060–2075 during the rebound, stop loss at 2100, target 2010→1960.
Discipline: Stop after a single loss reaches 2% of the capital, do not carry positions, do not heavily stake, do not leave overnight risky positions.
The above content is exclusively original by Liying, please cite the source if reprinted! The article's release and review may have a delay; the market changes rapidly, the above suggestions are for reference only, risks are to be borne by the reader.
Kind Reminder: The above content is solely from Liying's public account: Crypto Training Camp, created by the author. Advertisements at the end of the article or in the comment section are unrelated to the author, please be cautious in distinguishing, thank you for reading.
免责声明:本文章仅代表作者个人观点,不代表本平台的立场和观点。本文章仅供信息分享,不构成对任何人的任何投资建议。用户与作者之间的任何争议,与本平台无关。如网页中刊载的文章或图片涉及侵权,请提供相关的权利证明和身份证明发送邮件到[email protected],本平台相关工作人员将会进行核查。