On November 12 at noon, BTC was around $73,600. A month ago, it was still at $82,000, and on the morning of the 11th, it hit a low of $72,691, the lowest point since late August.
This week has seen a flurry of negative news: MSCI removed Strategy from the index, stablecoins declined by $14.2 billion in a month, the market began to bet on a Federal Reserve interest rate hike in December, and reports surfaced about a CEO change at Nvidia. Any one of these issues seems to explain this drop.
However, most of this news came out only after the decline. We reviewed the candlestick chart from the past month and found several signals that appeared earlier than the news, using the most common indicators: moving averages, RSI, plus a cost line.

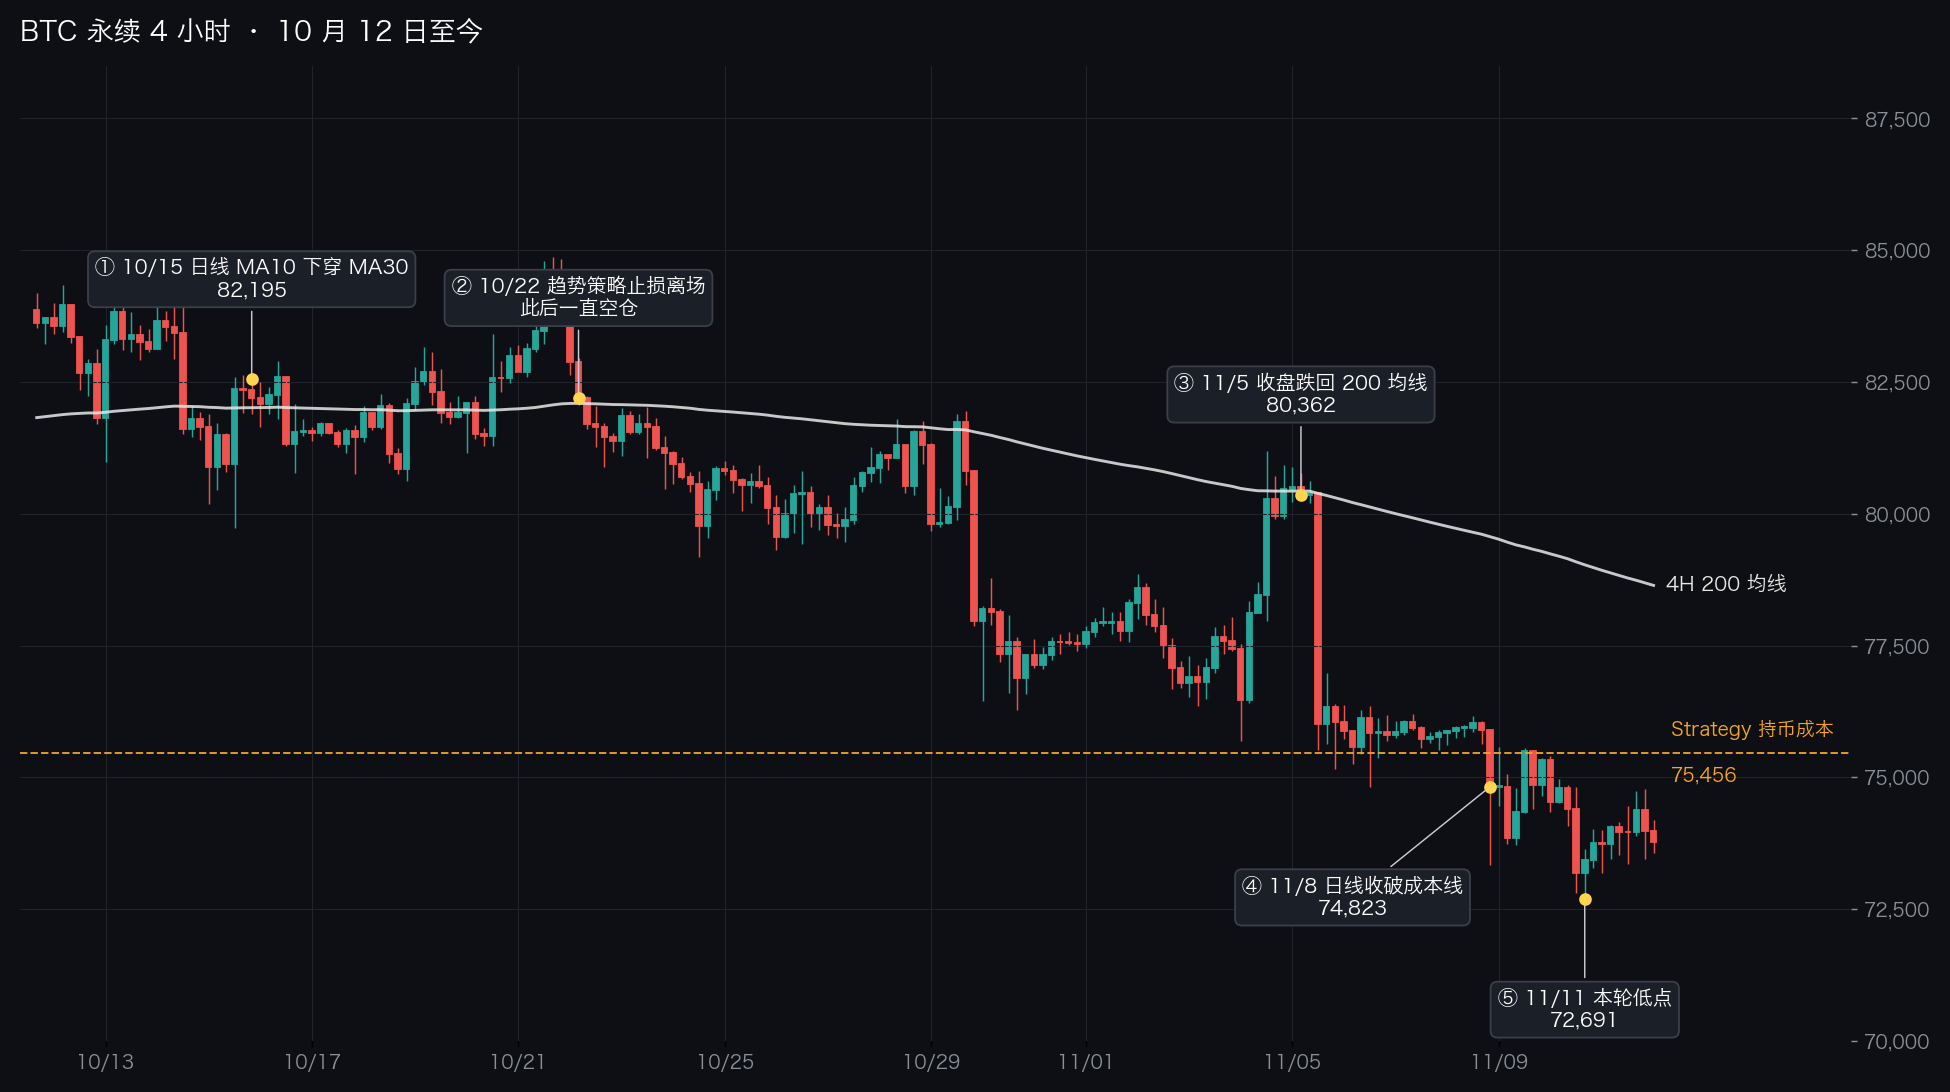
BTC perpetual 4-hour candlestick chart; the yellow dots indicate the signals mentioned below and this round's low point (data: Binance)
On October 15, the daily MA10 crossed below MA30

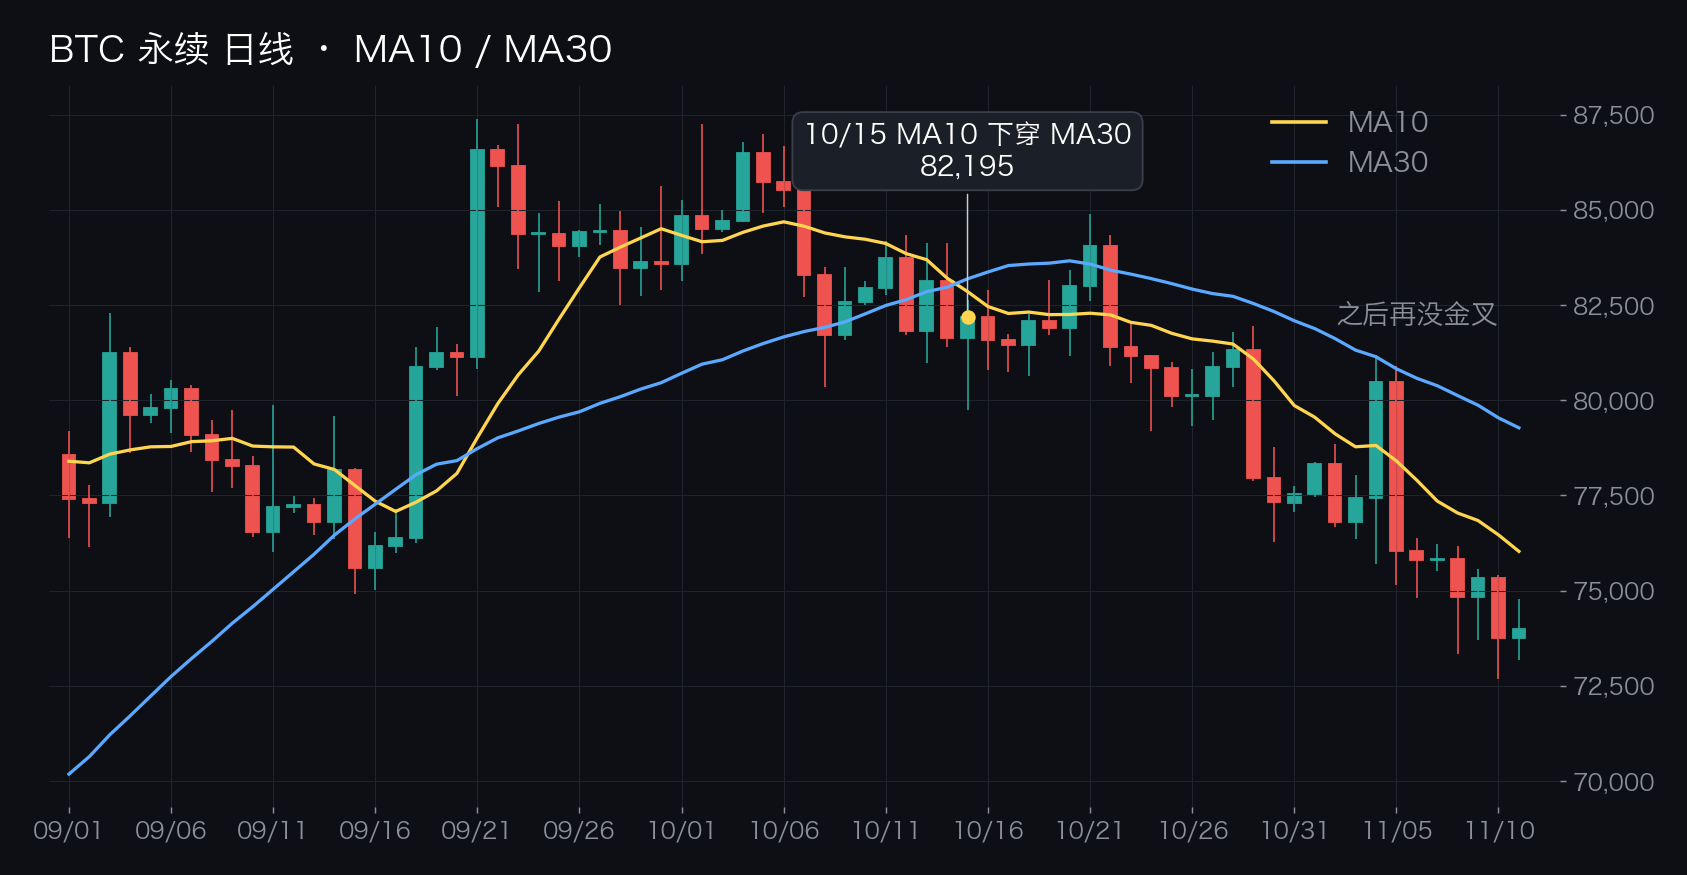
BTC perpetual daily chart; yellow line is MA10, blue line is MA30
At that time, BTC was still at $82,000, and everyone was discussing whether the "pullback was in place." On that very day, the 10-day moving average dropped below the 30-day moving average, commonly referred to as a death cross.
A death cross itself does not indicate much; it merely tells you that the average price over the last 10 days is lower than the average over the last 30 days. However, the subsequent trend was that the 10-day line never returned above the 30-day line, and the price only closed above it once on October 21, before dropping again the next day. As of today, it is down 10.5% from the day of the death cross.
▶ AiCoin official: Open MA on the BTC daily chart
On October 22, the live strategy hit the stop-loss and exited

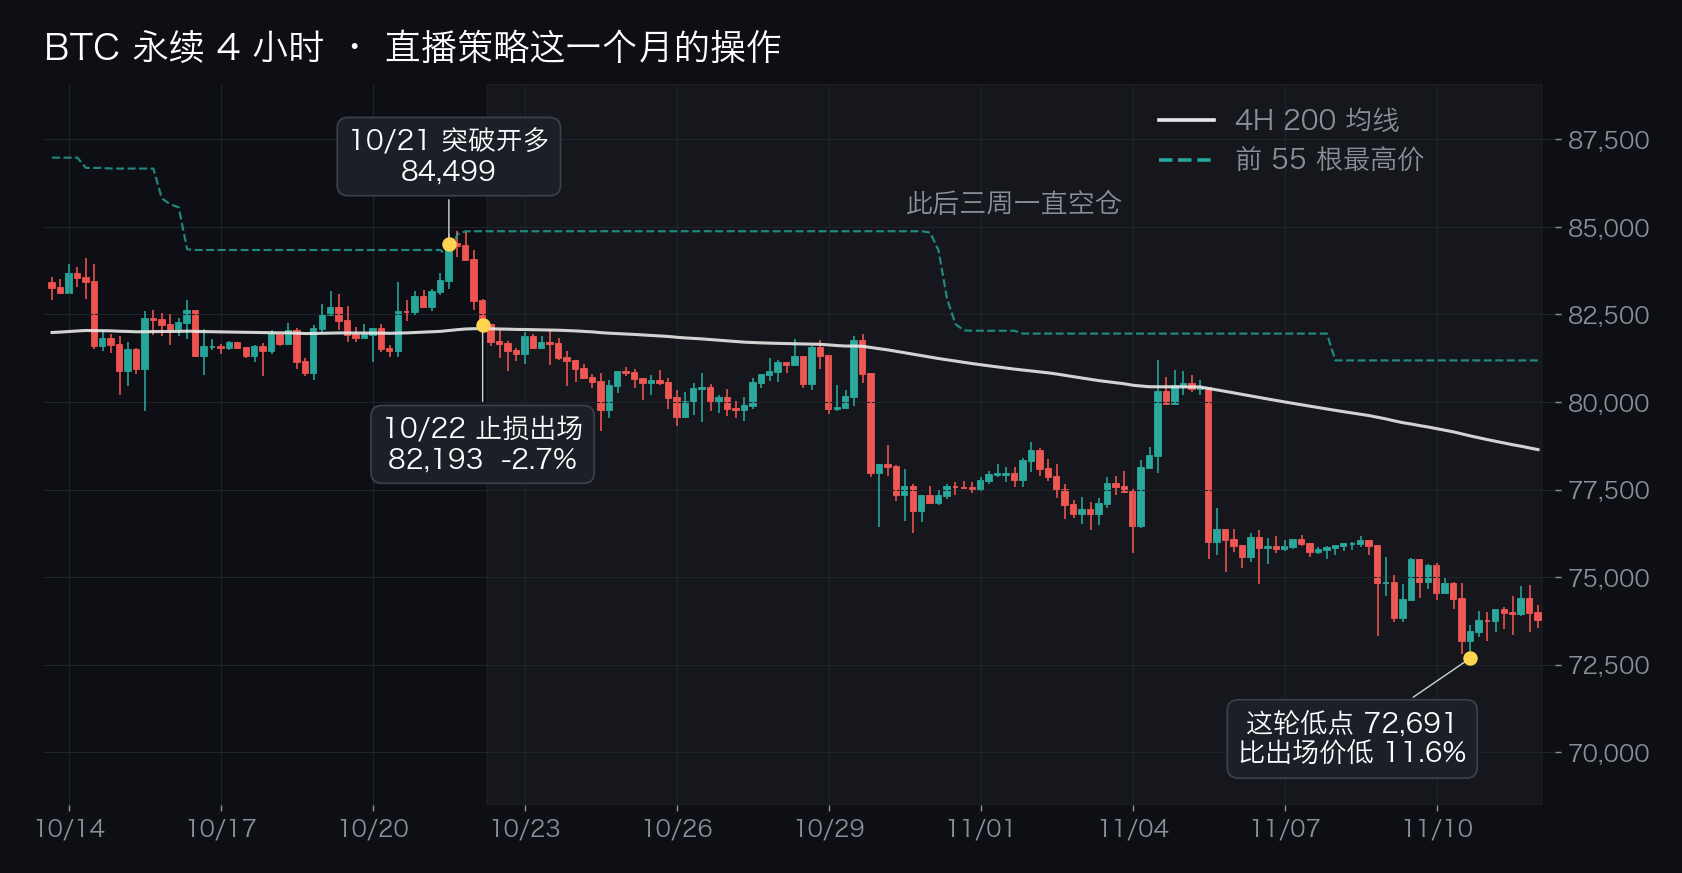
The live strategy made only one trade this month; after the stop-loss on 10/22, it remained in cash
During the live session on November 5, we let AI write a BTC 4-hour trend strategy, based on the turtle trading methodology: only enter long when the price is above the 200 moving average, the moving averages are upward, and the close breaks above the highest point of the previous 55 candlesticks; once positioned, use a trailing stop. Backtesting this strategy with nearly 8 years of BTC data resulted in +345%.
In the last month, it only made one trade: on the night of October 21, when BTC surged above $84,000, it went long; the next day the market reversed, hitting a stop-loss at $82,193, resulting in a loss of 2.7%.
Since then, it has not traded again. For the past three weeks, the price has stayed below the 200 moving average most of the time; even when it occasionally peeked over, it could not hold. The conditions for entering a trade did not align, so it remained cash. After it exited, BTC fell from $82,193 to $72,691, a drop of 11.6%.
Many people criticize trend strategies for having few signals and not making any trades for a month. However, this scarcity of signals helped it avoid that subsequent downturn.
▶ AiCoin official: View this strategy
On November 5 in the afternoon, it fell back below the 4-hour 200 moving average

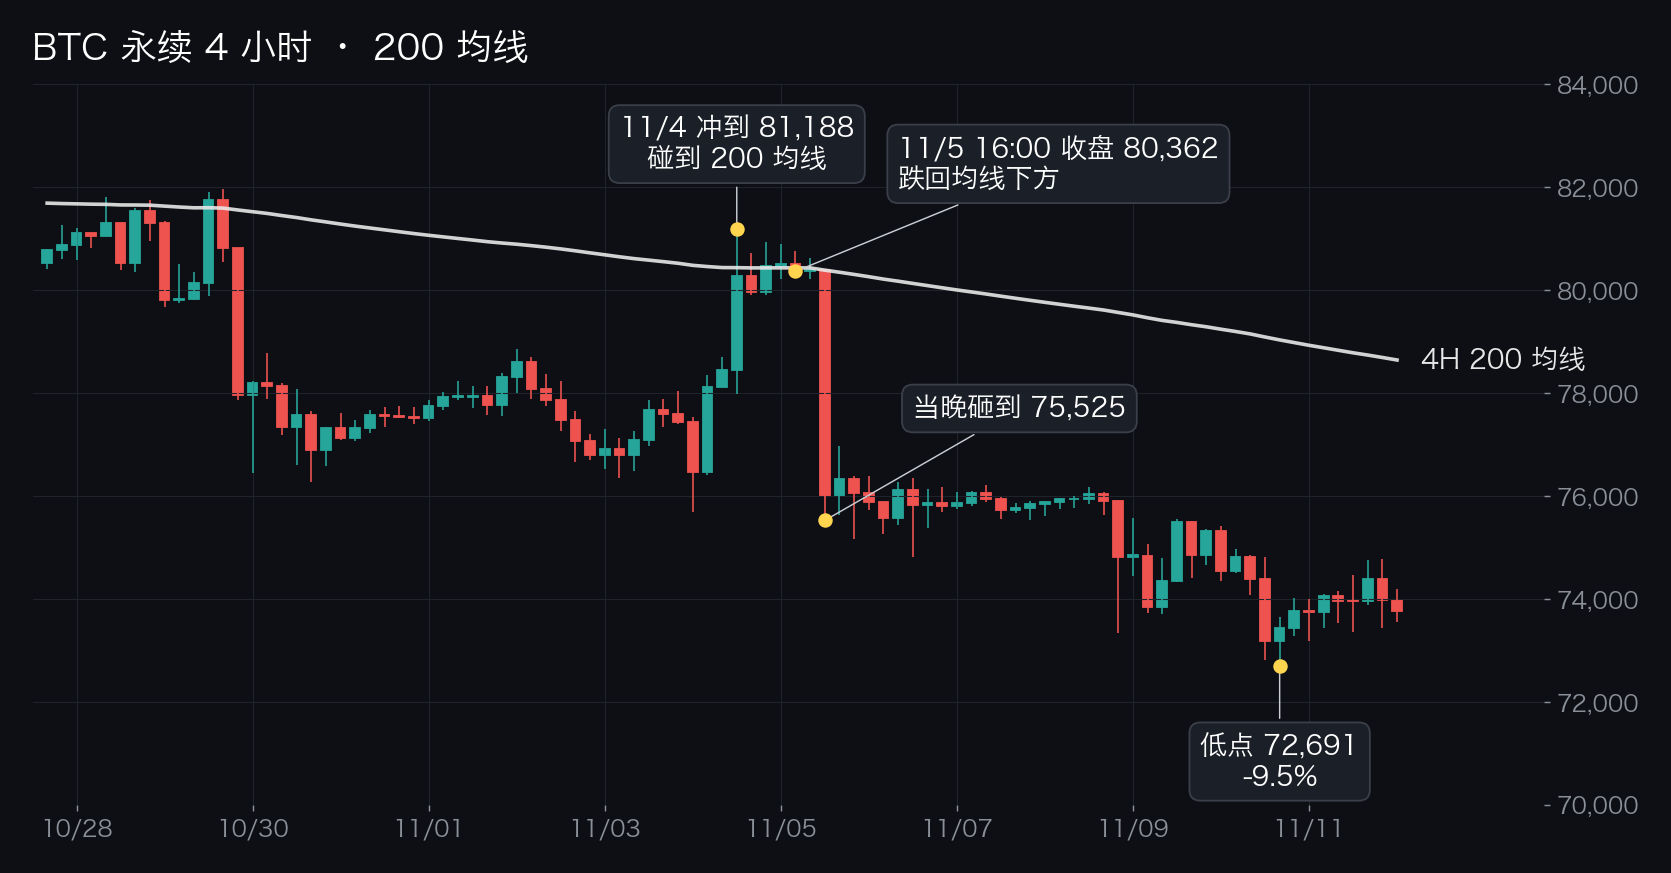
BTC perpetual 4-hour chart, white line is the 200 moving average
On November 4, that large bullish candlestick rose to $81,188, leading many to believe a rebound was coming. In reality, it just barely touched the 4-hour 200 moving average and did not stay above it for long.
By 4 PM on the 5th, the 4-hour candlestick closed at $80,362, falling back below the moving average. That evening at 8 PM, the candlestick plunged to $75,525, and then dropped to a low of $72,691, down 9.5% from $80,362. For over a week, BTC has not closed back above that line.
The 4-hour 200 moving average represents the average price over the past month. When the price is above it, most people entering during that time are still in profit; when it drops below, most of those trapped try to exit as soon as there is a rebound nearby. Thus, when this line breaks, the following conditions are often unfavorable.
▶ AiCoin official: Open BTC 4-hour candlestick chart
On November 8, it fell below the holding cost of Strategy

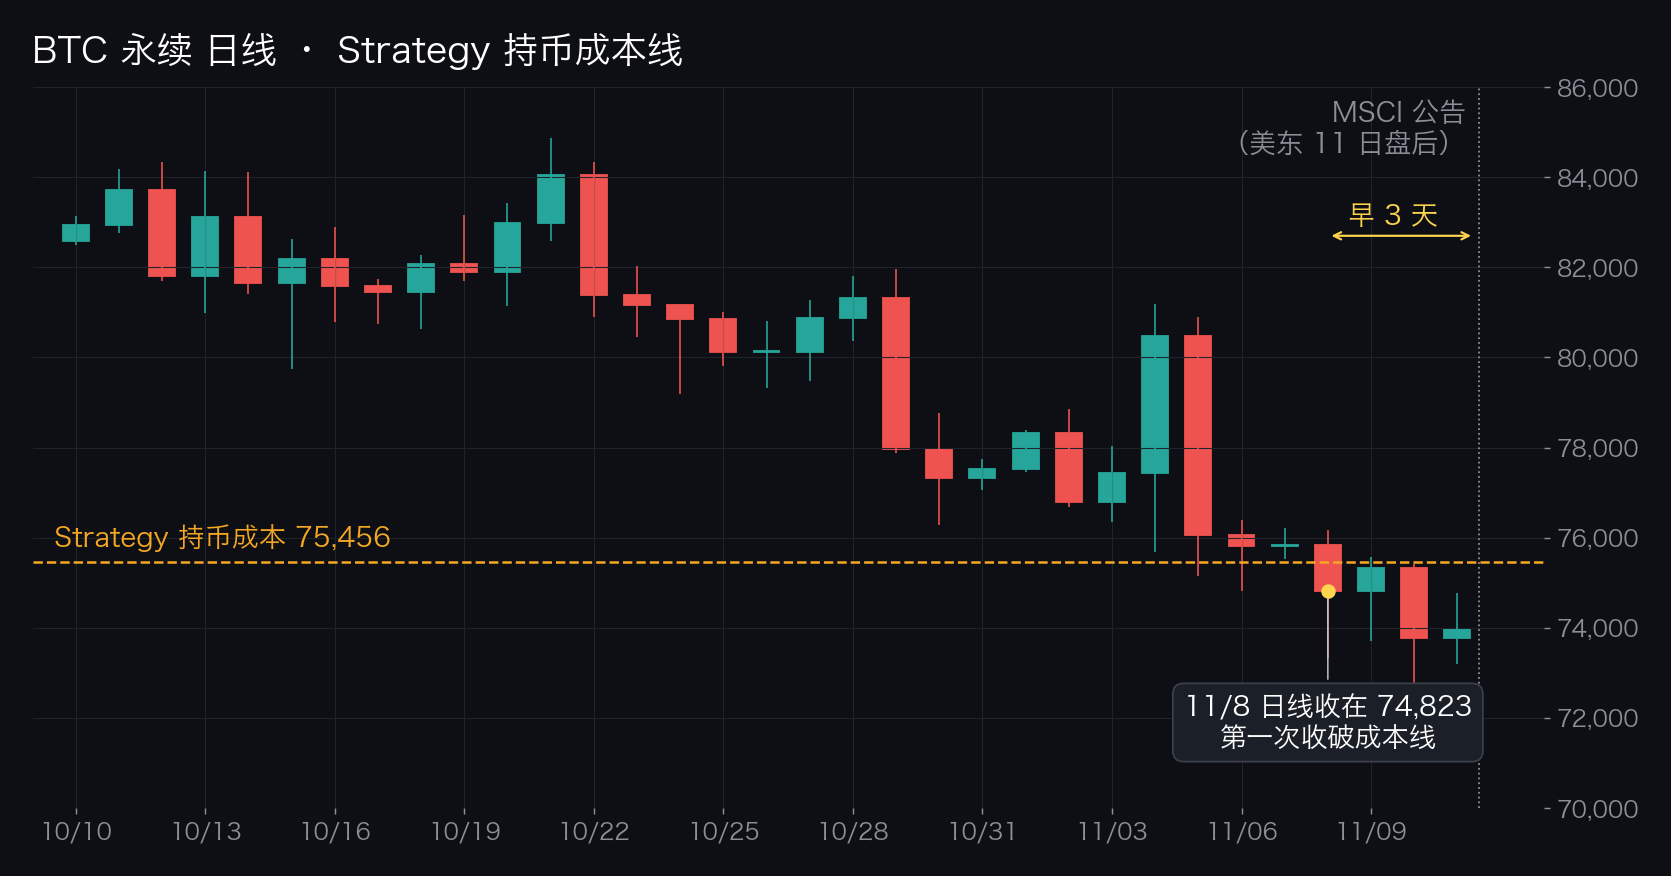
BTC perpetual daily chart, orange dotted line is the Strategy holding cost of $75,456
Strategy holds 850,364 BTC at an average purchase price of $75,456. Charting software typically does not include this line; we plotted it on the chart using custom indicators.
On November 8, the BTC daily line closed at $74,823, falling below this line for the first time and did not return for the next four days.
By the end of trading hours on the 11th in Eastern Time, MSCI officially announced the removal of Strategy from the MSCI US Index and several other indices, effective after the close on November 30. According to previous estimates from Morgan Chase, passive funds tracking these indices may need to sell about $2.8 billion worth of MSTR.
What was sold was stock, and Strategy does not need to sell its coins. However, it has been the largest buyer in the market for years, and when the stock price weakens, the route of issuing shares to buy coins becomes difficult. This situation was anticipated by the market, and the cost line broke three days before the news hit.
Not just BTC
We applied the same condition, "4-hour closing below the 200 moving average," and scanned the top 20 cryptocurrencies by market capitalization.
All 20 are below, none remain.
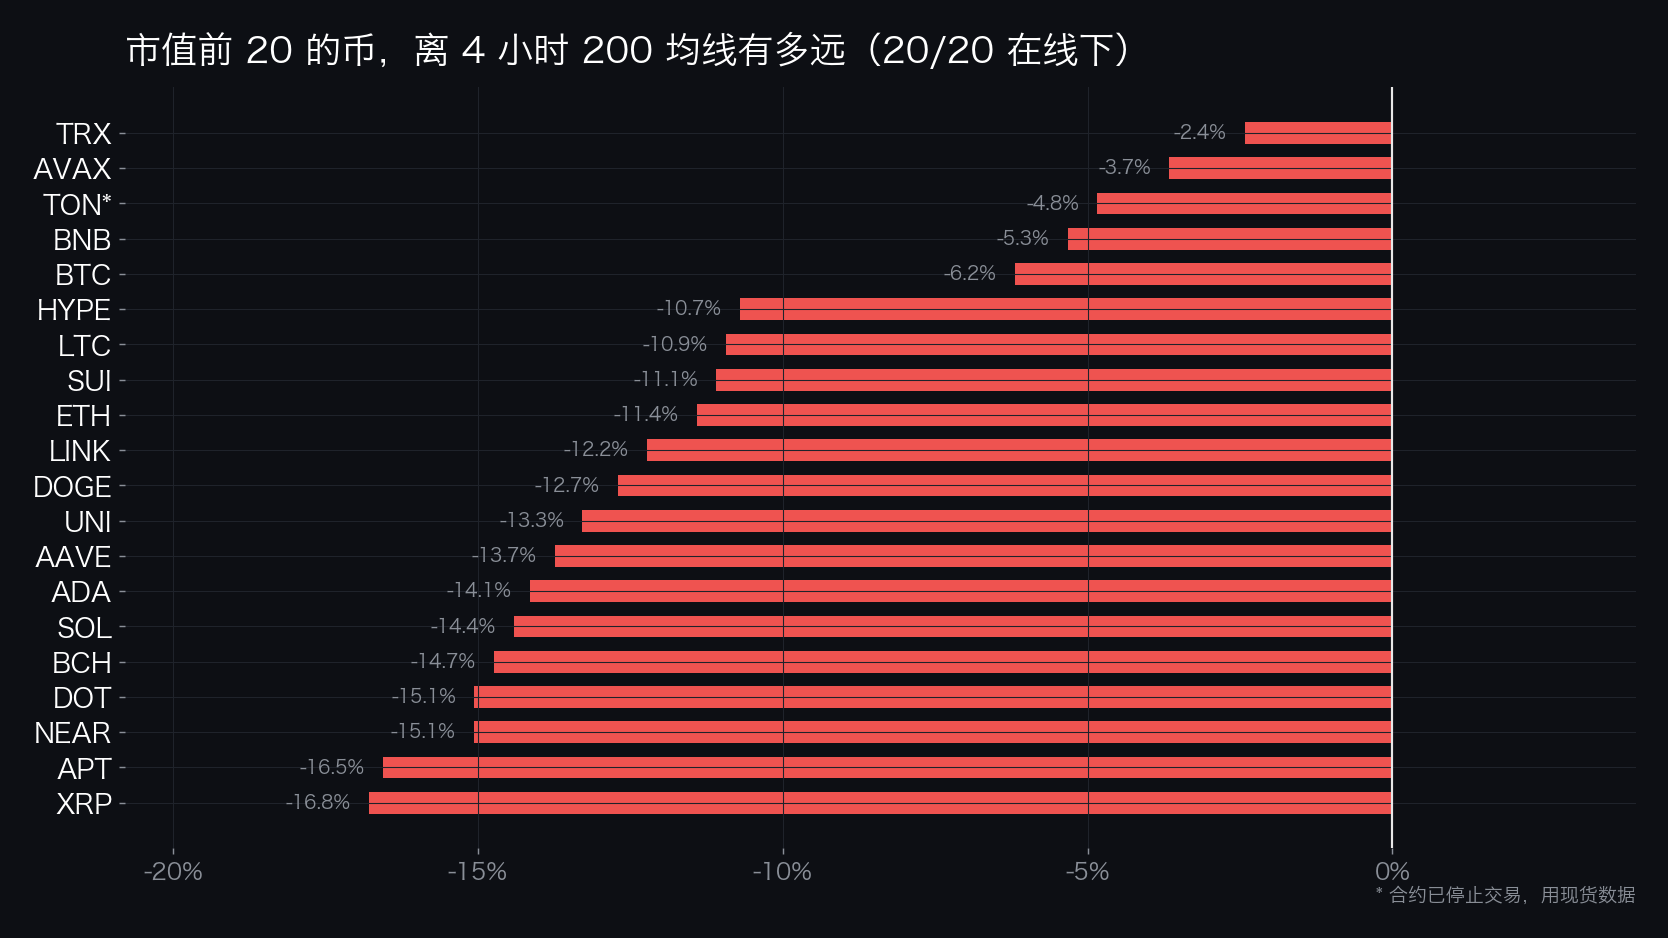
Based on the 4-hour closing price on November 12 at noon (data: Binance)
This week, XRP, BCH, and UNI all fell nearly 20%, ETH declined 15%, and SOL dropped 13%. The entire market is trending downward, making it less meaningful to pick a coin to bottom out at this time. Instead, one should pay attention to which one rebounds back above the moving average first, as funds generally return there first.
▶ AiCoin official: Open indicators to select coins
This week's news
• MSCI removes Strategy: Effective after the close on November 30, with a maximum passive sell-off of about $2.8 billion. In the same week, mining company MARA disclosed it had already sold 13,600 BTC and expects to sell more.
• Stablecoins are decreasing: Glassnode data shows that major stablecoins decreased by $14.2 billion in 30 days, the largest drop since June 2022. On the 11th, the US Bitcoin spot ETF also saw net outflows of about $300 million.
• Rate hike expectations return: The October CPI exceeded expectations, and the market saw the probability of a December interest rate hike rise to around 90%, with the dollar against major currencies reaching a 19-month high.
• Nvidia: Reports emerged of the board discussing the dismissal of Jensen Huang, and the stock price dropped over 8% in after-hours trading, putting pressure on tech stocks.
All these matters are significant, but most were discussed only after the price had already dropped. Few can read the news every day and then guess how it will affect coin prices. Changes in the candlestick chart come a bit earlier and are more intuitive.
How to view it now
On the afternoon of November 9, BTC's 4-hour RSI fell to 25, with the price at $73,844. In the following two days, it only fell to a low of $72,691, just a 1.6% drop, indicating that the descent has clearly slowed.
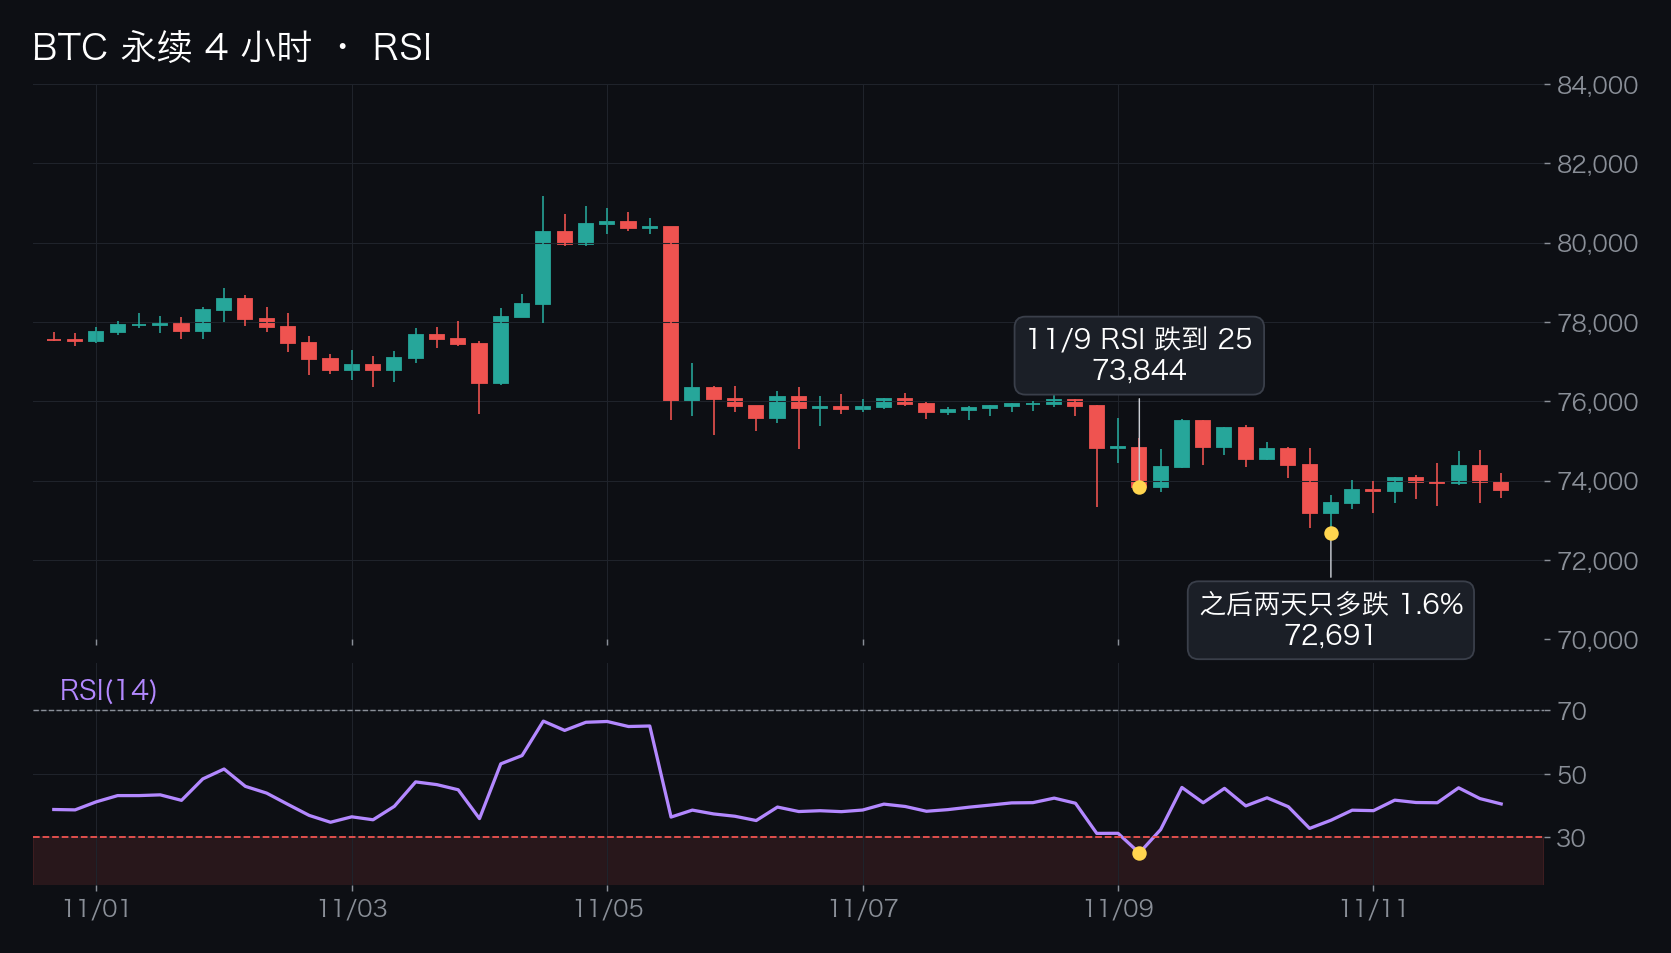
BTC perpetual 4-hour chart, with the RSI(14) below; under 30 is considered oversold
▶ AiCoin official: Open RSI on the BTC 4-hour chart
However, the overall direction has not changed. Next, we will be watching these positions:
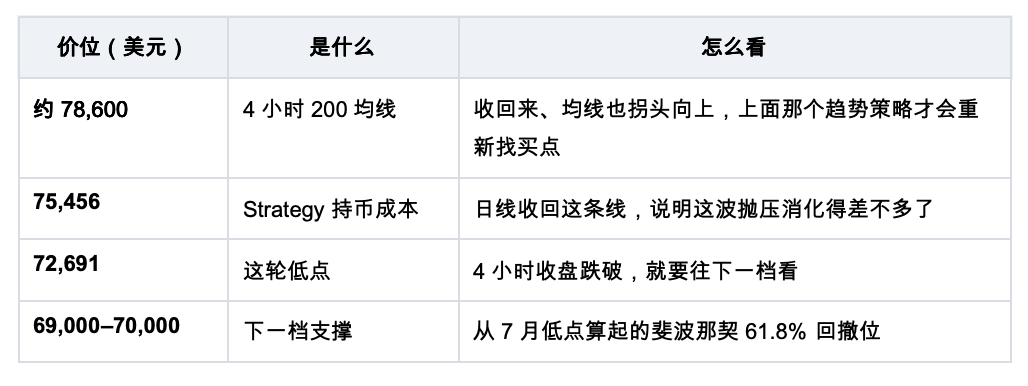
Want to set reminders yourself
No coding skills are needed. Open AI to write indicators, and simply articulate the rules clearly; it will generate the indicators, attach them to the chart, and set up alerts accordingly. The phrases we used this time are:
1. For BTC 4 hours, remind me when the closing price falls below the 200 moving average and also remind me when it climbs back above.
2. For BTC daily, remind me when the 10-day moving average crosses below the 30-day moving average.
3. Draw a horizontal line at 75456 on the chart; remind me when the BTC daily closes below or stands back above this line.
4. For BTC 4 hours, remind me when RSI drops below 30.
▶ AiCoin official: Open AI to write indicators
Data as of noon on November 12. Market data from Binance BTCUSDT perpetual contracts; news sources: MSCI index review announcement, Glassnode, The Block, disclosures from Strategy and MARA, AiCoin news. The signals in the text are based on closing prices, and the strategy backtest is based on historical data, not indicative of future returns. This article does not constitute any investment advice.
免责声明:本文章仅代表作者个人观点,不代表本平台的立场和观点。本文章仅供信息分享,不构成对任何人的任何投资建议。用户与作者之间的任何争议,与本平台无关。如网页中刊载的文章或图片涉及侵权,请提供相关的权利证明和身份证明发送邮件到[email protected],本平台相关工作人员将会进行核查。