Dear teammates, today the news sentiment is quite bearish. The heaviest piece of news is that the Federal Reserve's interest rate hike in December is almost certain, and market focus has shifted to the pace of rate hikes, with expectations of liquidity tightening directly suppressing BTC and ETH's valuation space. Another alarming piece of information is that MSCI will remove Strategy from the US index, effective November 30, which may trigger a sell-off of passive funds amounting to $2.8 billion, posing a real indirect pressure on market sentiment. Additionally, there is the risk preference shock from tech stocks, particularly as NVIDIA's board plans to dismiss Jensen Huang, causing NVDA to drop 9% after hours, intensifying the linked pressure on the crypto market today. Of course, there are also some hedging factors: Israel Discount Bank’s app will support BTC and ETH trading, and traditional bank access is a long-term positive, but it is difficult to counter the macro headwinds in the short term.
Current Price and Time
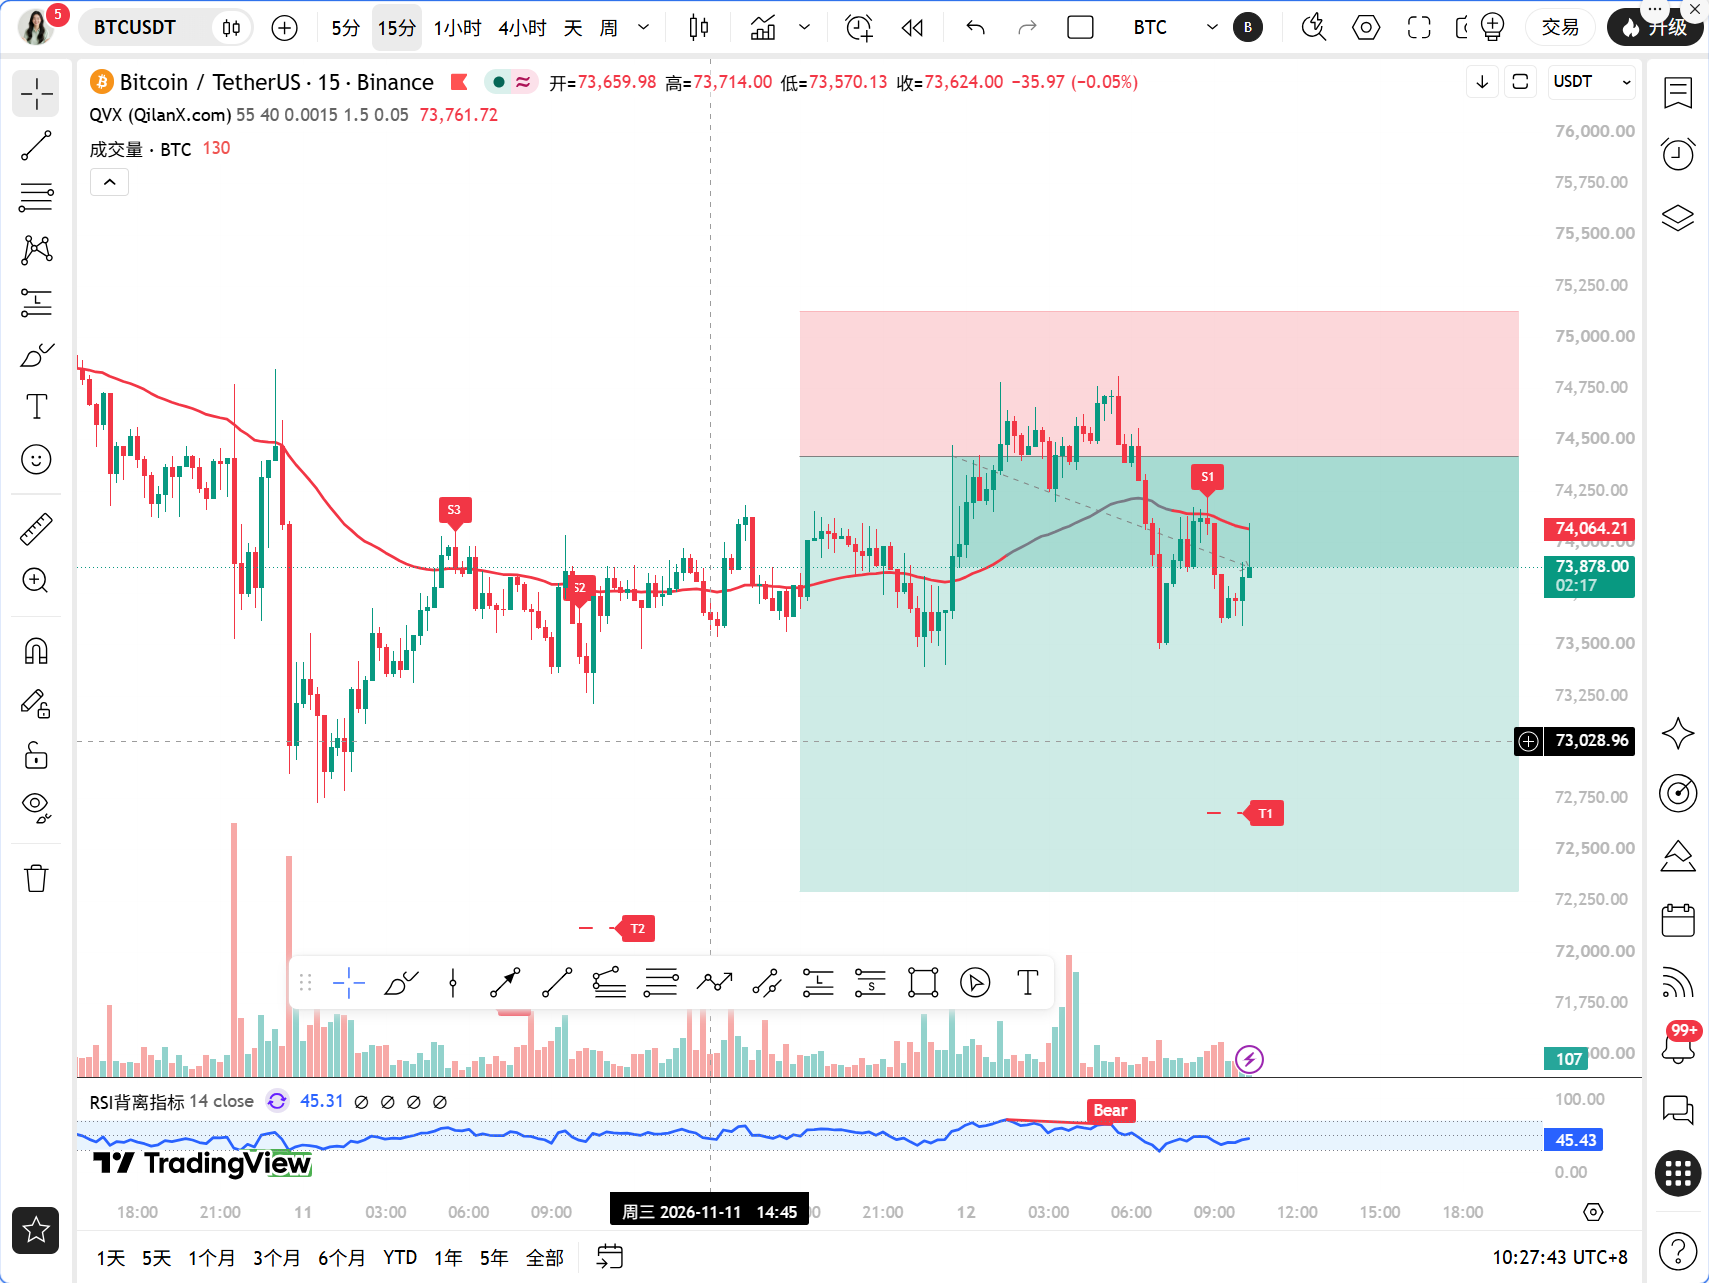
It is now 10:28 on November 12, BTC latest quote is 73928 USDT, a 24-hour increase of 0.58%, market share is 59.84%, the Fear and Greed Index is 28, indicating a fear zone. A five-minute surge of $1000 past the 74000 mark was observed, but the price could not stabilize and has currently retreated below 74000, indicating there is real selling pressure above.
Multi-Timeframe Overview
The daily level is bearish. MA5=74391.82, MA10=75771.66, MA30=79003.05, with moving averages in a bearish arrangement, and the price is below all three moving averages. MACD's DIF=-1937.92, DEA=-1621.05, and histogram=-316.87, indicating both lines are below the zero axis and the histogram is negative. RSI=36.39, close to a weak area but has not yet entered oversold territory, the daily chart overall remains in a corrective phase of a declining structure.
The 4-hour level shows marginal improvement. MA5=74064.51, MA10=73866.71, MA30=74853.73, with short moving averages starting to flatten and intertwine, and price fluctuating around MA5 and MA10. MACD's DIF=-527.42, DEA=-603.49, histogram=76.08, which is positive, indicating that the downward momentum at the 4-hour level is weakening, representing one of the few positive signals on the current chart. RSI=40.70, still in the neutral yet weak area.
The 1-hour level is the key observation window for today. MA5=73937.92, MA10=74216.60, MA30=73950.29, with the moving averages sticking together and flattening. MACD's DIF=6.53, DEA=36.68, histogram=-30.15, bringing the lines close to the zero axis, and the histogram turning negative, indicating the short-term momentum is weak. RSI=50.63, just at the neutral line, with neither side having a clear advantage. The critical dividing line EMA55=74214.61, and the current price 73928 is about 286 points below this line, a decrease of 0.39%.
The 15-minute level shows narrow fluctuations. MA5=73766.36, MA10=73887.52, MA30=74167.86, with prices fluctuating around the short moving averages. MACD's DIF=-122.58, DEA=-109.22, histogram=-13.36, the histogram is slightly negative. RSI=49.70, neutral. The 15-minute level has not given clear directional guidance, typical of a waiting period.
TPV Signal Validation
Firstly, let's look at trend positioning. The current price of 73928 USDT is below the 1-hour EMA55 of 74214.61, according to the TPV system rules, the price is in a bearish trend area, which is undisputed.
Next, let’s check if the conditions for going long are met. The first requirement is that two consecutive 1-hour candlesticks close above EMA55, and the current price is below this line, so this condition is not met. The second condition is for support to stabilize, and there has not yet been any clear signal with long lower shadows, bottom formations, or increased volume stalls at the 15-minute and 1-hour levels. The third condition is a decline in downward momentum; the 4-hour MACD histogram being positive somewhat supports this, but the 1-hour MACD histogram has just turned negative, and RSI around 50 hasn’t rebounded from below 30 nor formed a bullish engulfing pattern. None of the three conditions for going long is complete, so no long signal is established.
Short conditions also need to be tested. The first requirement is for two consecutive 1-hour candlesticks to close below EMA55; currently, the price is indeed below EMA55, but the continuity of the close needs confirmation. Recent candlesticks show repeated crossing, with no clean continuous suppression formed yet. The second condition is for pressure to meet resistance; there indeed has been a pullback after a surge near the 74000 mark, but the pattern isn’t standard enough. The third condition is weakness in the rebound; the 1-hour MACD histogram turning negative and RSI falling from a high offers some directional indication, but the strength is insufficient. Overall, some short conditions are met, but the setup isn't clean.
In terms of auxiliary fluctuation data, in the past 8 1-hour candlesticks, the number of closes above EMA55 was 3/8, and there was only one crossing, with the current price being 0.39% away from EMA55, above the 0.3% fluctuation threshold. The system judges this does not meet fluctuation conditions, indicating a possible one-sided trend. However, with only one crossing, it suggests that this one-sided trend lacks strong momentum; more accurately, it is weak consolidation within a bearish trend area, leaning towards bearish but sluggish in pace.
On-chain/Fundamentals
The Fear and Greed Index is at 28, indicating market sentiment is in a state of fear, which often means the panic selling has been released sufficiently, but also shows a lack of willingness from bottom-fishing funds. BTC market share stands at 59.84%, with funds still concentrating on Bitcoin, while altcoins are under significant pressure, as evidenced by Strobe Fund’s liquidation of 143 million ENA for $32.95 million. Rumble sold off 198 Bitcoins in the third quarter, reducing holdings to 94.68 Bitcoins, signaling institutional reduction worth noting. Another point not to be overlooked is that the 40x BTC short positions are just 0.44% away from liquidation, with AguilaTrades accumulating a loss of $39.09 million, which could trigger a short squeeze if the price makes an upward impulse. Wang Chun withdrew 3996 ETH staked in Lido, indicating a whale locking position, a bullish signal, and ETH breaking through 2100 USDT with a 3.71% rise also boosted altcoin sentiment, but BTC itself remains under macro pressure.
Key Offensive and Defensive Levels
The first resistance level above is the 1-hour EMA55 at 74214.61, which serves as the dividing line for bullish and bearish trends within the TPV system; the price must close above this level for two consecutive 1-hour candlesticks for a bullish trend to be discussed. The second resistance level is in the range of 74500 to 74800, corresponding to the overlapping area of the 4-hour MA30=74853.73 and daily MA5=74391.82. The first support level below is around 73500, a low-point area tested repeatedly in recent 15-minute and 1-hour charts. The second support level is at the 73000 integer mark; if broken, the daily level will open up new downward space. The current price of 73928 is exactly sandwiched between the support and resistance, offering little movement range, typical of a signal vacuum area.
Trading Ideas
Direction: Bearish bias, but wait for confirmation and don’t jump the gun. The TPV system indicates the price is below the 1-hour EMA55, in a bearish trend area; the overall direction is to short on rebounds, with longs as a supplement, requiring signals.
Short entry conditions: The price rebounds to the range of 74100 to 74250, approaching the 1-hour EMA55 but unable to close above for two consecutive candlesticks, while a long upper shadow or top formation is seen in the 1-hour, and the MACD histogram remains negative, allowing for light short positions. Set the stop loss above 74500, which is above the 4-hour MA30, to prevent a fake breakout. The first target is 73500, and the second target is 73000.
Long entry conditions: The price must see two consecutive 1-hour candlesticks close above EMA55 at 74214.61, and retest not breaking this line, while the 1-hour MACD histogram turns from negative to positive or forms a bullish engulfing; only then can light long positions be taken. Set the stop loss below 73800, with targets in the range of 74500 to 74800. Note that going long is a short-term behavior against the trend; positions should be light, and profits should be taken when available.
In terms of position management, it is currently a signal vacuum area, and heavy positions are not recommended. A fear index of 28 combined with short liquidation risks shows the chance of bidirectional spikes is high, and stop losses must be strictly enforced; don’t hold positions.
Risk Warning
Expectations for Fed interest rate hikes and selling pressure from MSCI's removal may amplify volatility at any time, with the 40x short liquidation threshold hovering overhead. The risk of bidirectional spikes is high, and strict stop losses are the bottom line.
Follow the Qinglan Crypto Class to seize more trading opportunities! Welcome to visit the official website www.qinglan.org
📊 Qinglan TPV Trading Strategy Backtest Reference
🕒 Last backtest time 11-12 07:00:02
Total analysis: 5056 Backtests: 5046 Accuracy: 75.6% (3814/5046)
免责声明:本文章仅代表作者个人观点,不代表本平台的立场和观点。本文章仅供信息分享,不构成对任何人的任何投资建议。用户与作者之间的任何争议,与本平台无关。如网页中刊载的文章或图片涉及侵权,请提供相关的权利证明和身份证明发送邮件到[email protected],本平台相关工作人员将会进行核查。