Cryptocurrency Scholar: November 12 Bitcoin (BTC): For those who wake up in the middle of the night to check their phones for trading, this article is written for you.
While writing this, I checked the numbers three times. Recently, many people in my private messages asked me, "Can we bottom out now, old Chen?" My answer is always: You can try, but please use only the money you can afford to lose without affecting your life, and set a stop-loss in advance in your order. What the market lacks the most is "I think," and what it lacks the most is "I'll run if I'm wrong." During this drop from 87,000, many people added positions in the emotional state of "thinking it won't drop further" only to get trapped. Once this bottoming process is over, regardless of which direction you choose, I hope you are someone who enters with a plan, not someone being led by a candlestick.
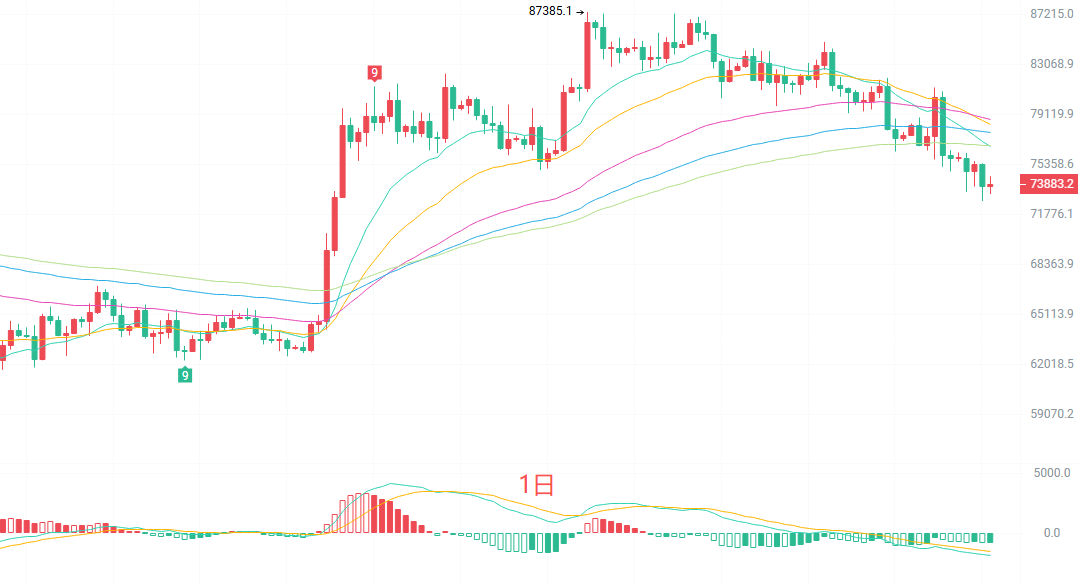
The daily K-line is temporarily stagnating at this position. However, structurally, it looks grim: the price of 73,603 has already broken below the five EMA moving averages, all in a bearish arrangement, diverging downward, which is a textbook-level downtrend pattern. The MACD here shows a death cross below the zero line, with green bars continuing to be emitted, indicating that the daily level downward momentum has not diminished. The lower Bollinger band at 72,840 is currently the last support level; closing above it is considered strong, but falling below will require finding the next support.
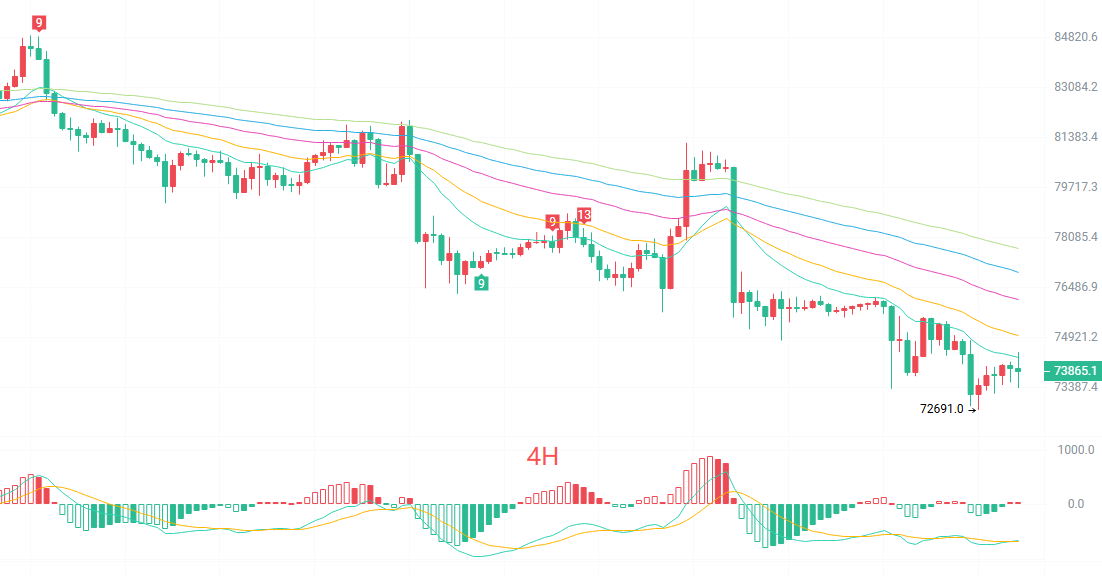
The four-hour K-line is also rebounding below all moving averages and facing layers of pressure. Focus on two signals: first, the previous low is at 72,691, and yesterday's wave of selling stopped here; today’s low of 73,357 did not break the previous low, showing a slight resistance to dropping; second, the MACD green bars are about to disappear, indicating a potential bullish divergence. The lower Bollinger band at 72,859 has the price moving close to the lower band; usually, at such positions, it either slowly declines to consolidate the bottom or a single strong bullish candle pulls back to the middle band at 74,544.
Short-term reference:
Moving north from 72,900 to 72,500 faces resistance, stop-loss 500 points, target at 73,800 to 74,500.
Moving south from 74,800 to 75,300 sees stagnant growth, stop-loss 500 points, target at 74,000 to 73,500.
Specific operations should primarily rely on real-time market data; for more information, you can consult me. There may be delays in article publication, so the advice is for reference only, and risks are borne by yourself.
Warm reminder: The above content is synchronized and updated on major trading platforms like Binance, Okex, Huobi, etc. For more content, you can add me as a friend and join my fan group on Binance and Okex.
免责声明:本文章仅代表作者个人观点,不代表本平台的立场和观点。本文章仅供信息分享,不构成对任何人的任何投资建议。用户与作者之间的任何争议,与本平台无关。如网页中刊载的文章或图片涉及侵权,请提供相关的权利证明和身份证明发送邮件到[email protected],本平台相关工作人员将会进行核查。