Liying Chat Coin: 11.12 Bitcoin (BTC) and Ethereum (ETH) Latest Market Analysis
Family! The current price of Bitcoin is 73550, this roller coaster ride is making my heart race! Many friends who just entered might be wondering if it's time to buy the dip again, but the seasoned traders are shivering, afraid of another plunge that could wipe them out completely. The current market sentiment is an intense battle between bulls and bears, and no one dares to make a reckless move. Don't panic, today we’ll set aside all those ethereal predictions and get straight to the essentials, using the most intuitive technical analysis to help you uncover the true nature of this market wave, allowing you to see if it’s a real correction or a false drop, keeping a steady mindset, we won’t panic! The price is currently tightly adhering to the lower bound of 72943, and the channel opening is slightly widening downwards, which typically indicates a potential trend change or accelerated decline. However, as long as it holds above the middle line of 75008, there’s still a chance for price stabilization in the future.
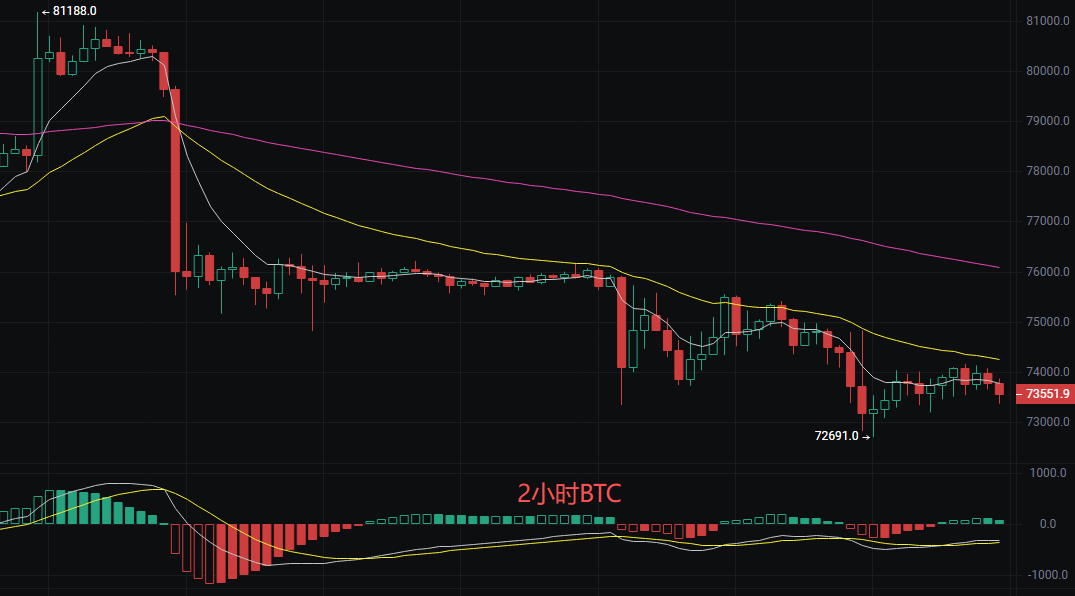
Currently, it's advisable to focus on defense and counterattack, avoiding chasing prices or selling at loss. Strictly control position sizes and manage stop losses:
Short Strategy: Enter light short positions at the 74000-74300 range, stop loss at 74800, target 72600 and lower.
Long Strategy: Patiently wait for a pullback to stabilize at 72600-72900, then enter upon the appearance of a lower shadow or bullish engulfing candle. Stop loss at 72400, target 73500-74000.
Ethereum
Family! The current price of Ethereum is 2067. As you can see from the chart, the price has dropped sharply from a previous high of 2449, and in recent days, it has been like a kite with a broken string, continuously searching for support. Although it briefly fell below the key level of 2003 today, it has struggled to recover a little bit. This indicates that both bulls and bears are fiercely competing around the psychological barrier of 2000. The current market is like bottoming out, many who want to buy the dip are hesitant to enter, and those holding short positions are afraid of a sudden reversal. The moving average system presents a perfect bearish arrangement. Currently, the MACD’s DIF is below the DEA, and the bearish strength is waning. The Bollinger Bands have widened sharply, and the price is closely adhering to the lower band of 2011. This is a typical oversold signal, indicating that the price is in an extremely weak zone and could trigger a technical rebound towards the middle band at 2071 at any moment.
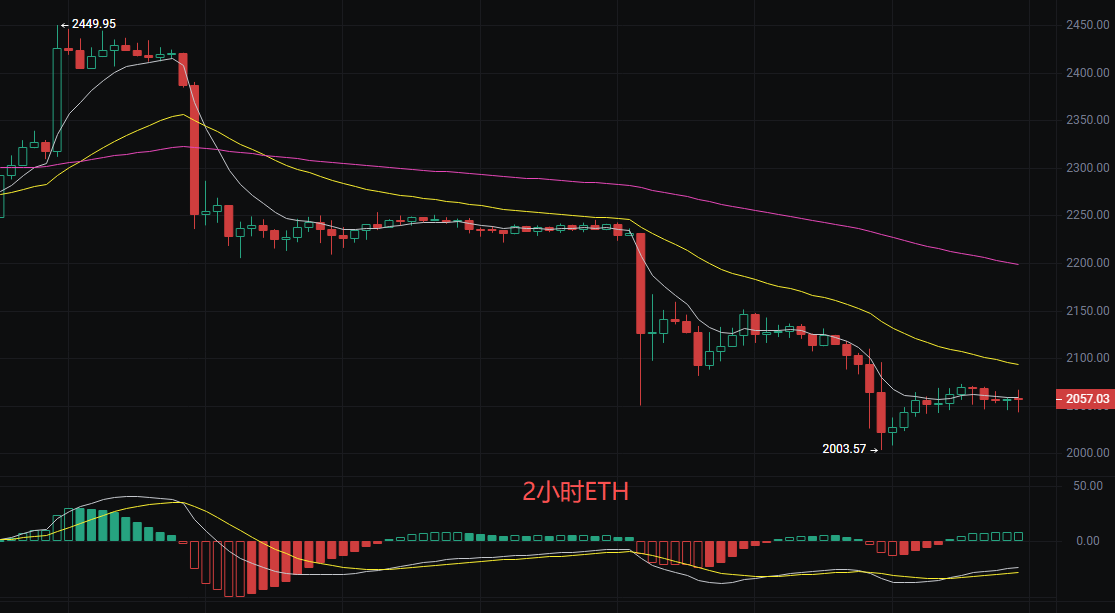
Short at 2080 - 2090, stop loss: above 2115, target: look towards the previous low around 2010.
Long at 2000 - 2010, stop loss: below 1985, target: 2050-2100.
The above content is exclusively original by Liying, please indicate the source when reprinting! Article publication review has a delay, and market conditions change rapidly. The above advice is for reference only, risk is assumed by the reader.
Warm reminder: The above content is solely from the Liying public account: Crypto Training Camp, created by the author. The advertisements at the end of the article and in the comments section are unrelated to the author; please discern carefully. Thank you for reading.
免责声明:本文章仅代表作者个人观点,不代表本平台的立场和观点。本文章仅供信息分享,不构成对任何人的任何投资建议。用户与作者之间的任何争议,与本平台无关。如网页中刊载的文章或图片涉及侵权,请提供相关的权利证明和身份证明发送邮件到[email protected],本平台相关工作人员将会进行核查。