This article comes from: 0d Labs CEO matteo
Compiled | Odaily Planet Daily ( @OdailyChina ); Translator | Azuma ( @azuma_eth )

In the past few months, as we are developing a yet-to-be-released product, we have spent a significant amount of time analyzing the liquidity of various DEXs in different trading pairs. We have over a year and a half of complete order book data, sourced from records during our trading activities through 0d Labs. During our analysis, we discovered an unexpected phenomenon in the long tail of the crypto market — liquidity is becoming increasingly thin.
After the 1011 incident last year, we anticipated such an outcome, but it seems that the entire crypto market has yet to truly recover from that event.
Additionally, many of our close trader friends have recently complained that it is becoming increasingly difficult to compete on Hyperliquid, with some mechanisms on the platform seemingly concentrating advantages to top participants. From Read Priority Fees being monopolized by Wintermute to transaction fees and L1 network congestion causing distress for small market makers (MM), these issues have caught our attention.
Therefore, I decided to further investigate the changes in liquidity on Hyperliquid and try to determine whether the deteriorating survival environment for small market makers is causally related to the decline in platform liquidity? After all, one of the core competitive advantages of early Hyperliquid was its ability to provide substantial liquidity for long tail assets.
Benchmark Comparison
First, we need to establish a benchmark that reflects the overall status of the crypto market. Liquidity may be thinning, but if this is a phenomenon affecting the entire market, we must distinguish which changes come from the market as a whole and which are issues specific to Hyperliquid.
For the overall liquidity of altcoins, Binance serves as a valuable reference benchmark. To this end, we selected 86 assets that were traded on both platforms between November 1, 2025, and November 1, 2026, and have a maximum leverage of less than 10 times, as the sample of long tail assets for this study.
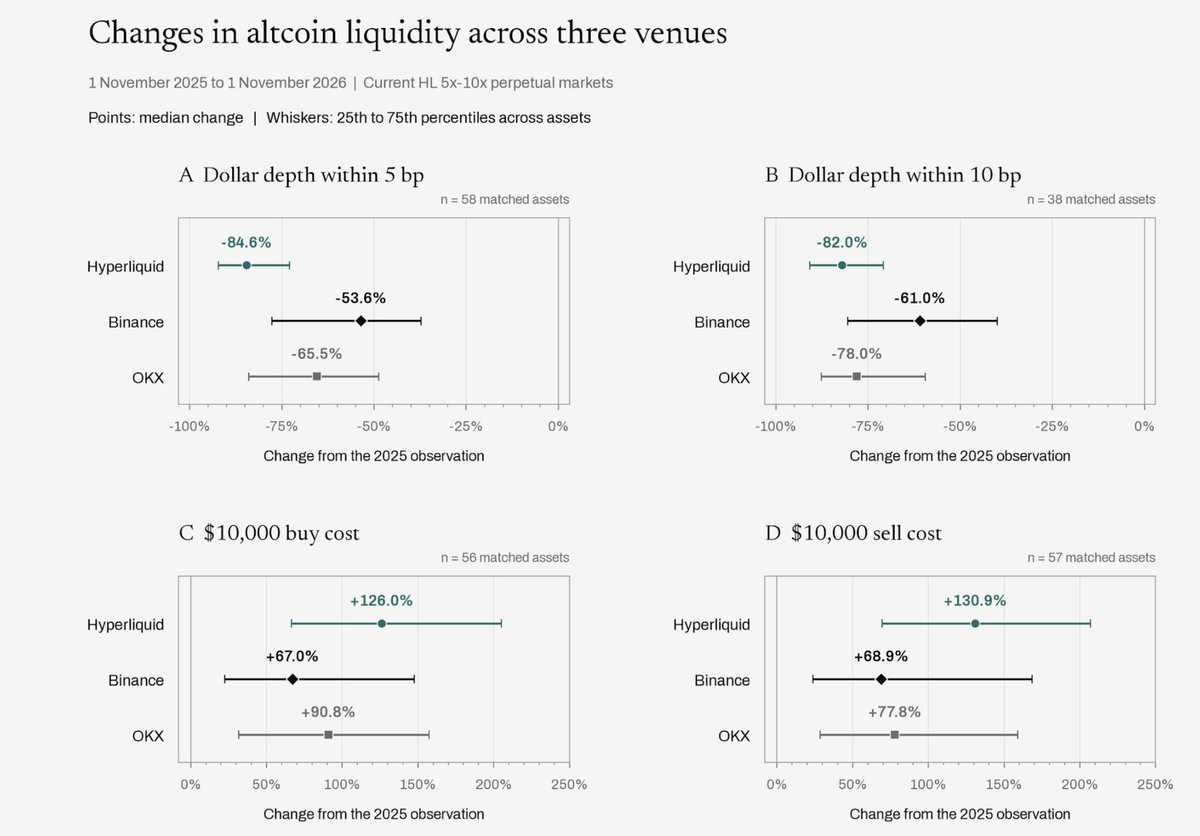
Among 38 markets that could be compared uniformly at 10 basis points (bps), the median depth denominated in USD on Hyperliquid decreased by 82%, while that of Binance decreased by 61%, and OKX decreased by 78%. This discrepancy is already quite significant.
Of course, a decline in token prices would inherently lead to a shrinkage in the dollar-denominated order book depth, but we need to further confirm whether the number of tokens quoting within these price ranges is also decreasing.
To assess whether Hyperliquid has unique problems, I divided the depth of each asset on Hyperliquid by its depth on Binance, and then compared the changes in this ratio over the past year. Within a range of 5 basis points, the median of this ratio decreased by 57.5%.
This means that even when observing the liquidity of the same token on both platforms, Hyperliquid has still lost a substantial amount of liquidity compared to Binance. It should be noted that these ratios are calculated market by market, rather than simply dividing the median depths of both platforms.
If we wish to buy $10,000 worth of assets during the latter sample period, the median trading cost on Hyperliquid, based solely on the prices displayed on the order book, would be 5.21 basis points, while Binance would just be 2.95 basis points, not yet accounting for fees. For an order of such scale, this means costs of $5.21 and $2.95 respectively.
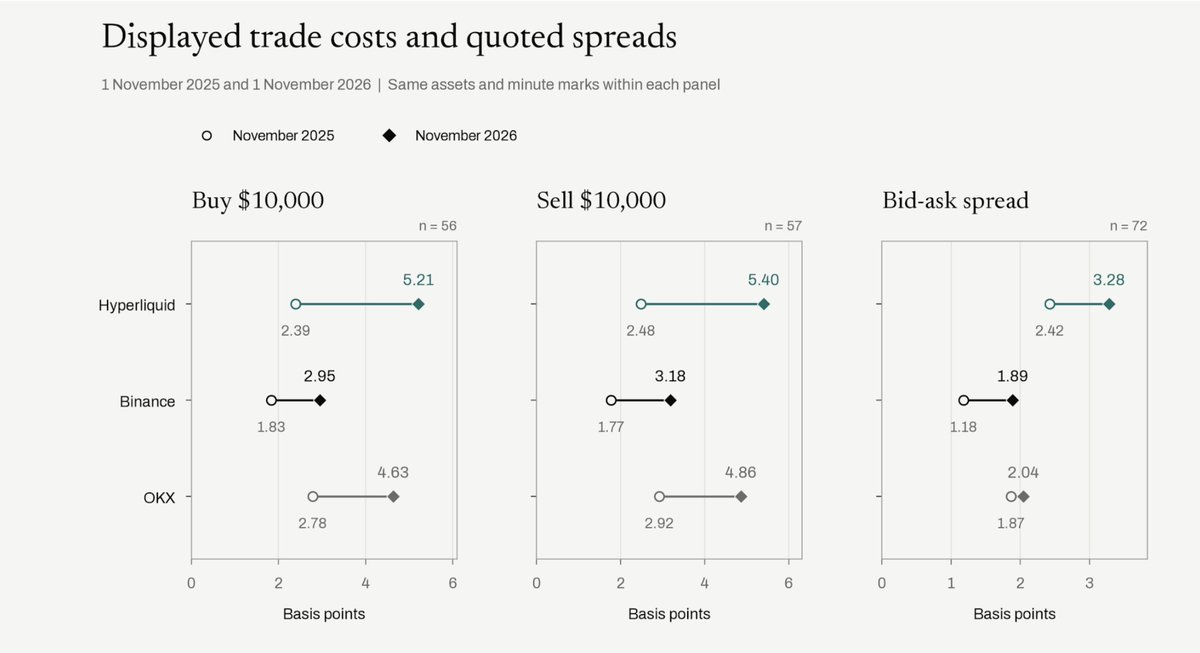
The spread, however, provides an interesting counter-example. Binance's spread actually saw a more significant relative expansion (though it initially had a narrower spread and its final level remains lower).
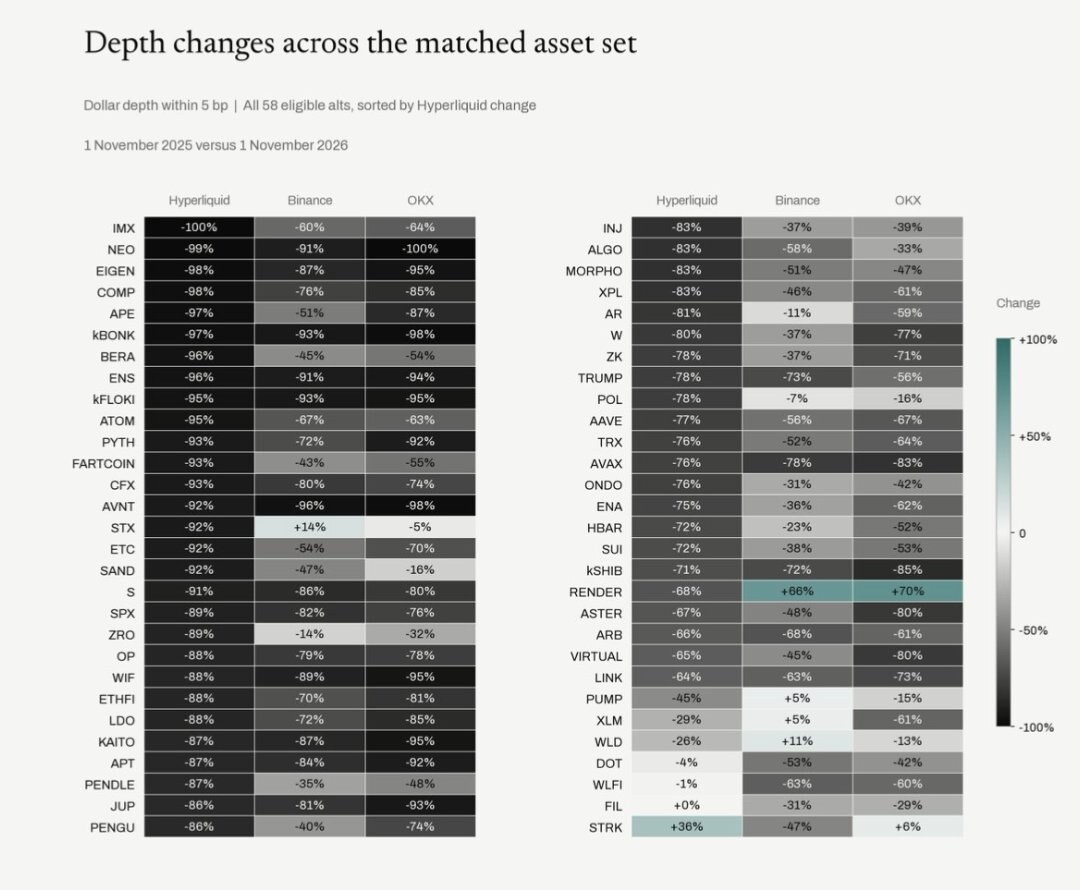
The Closest Price Range Shows the Most Significant Issues
One might raise a fundamental question regarding the above analysis: if the price of a given token falls sharply, even if the number of tokens on the order book remains unchanged, the dollar-denominated depth will appear to shrink. To exclude this factor, we simultaneously tracked the dollar quoted amounts and the number of tokens in the order book.
In Hyperliquid's charts, we fixed the asset range and observation period for 13 sampling dates. Among them, the sample within a 5 basis point range contains 63 markets, while the broader top 20 basis point sample includes 80 markets.
It should be noted that the filtering criteria for these samples are stricter than those previously mentioned, which only compared two time points, so the endpoint data here cannot directly substitute for the previous comparisons with centralized exchanges (CEX).
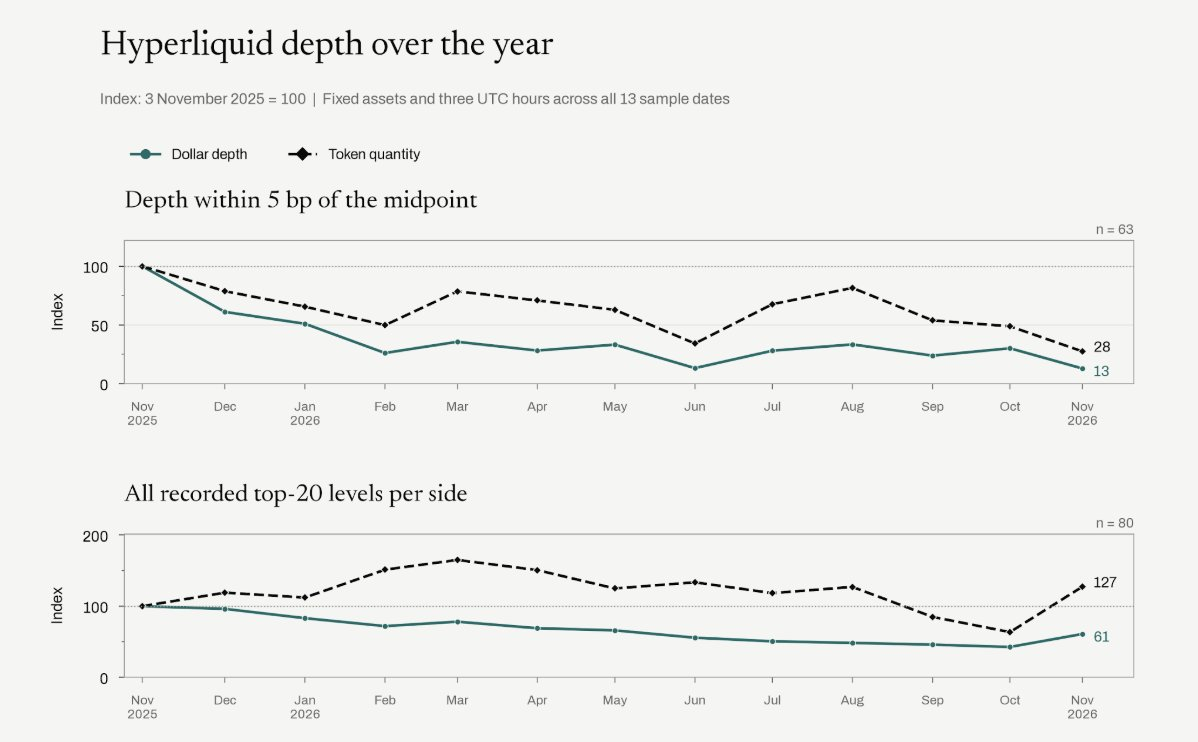
To facilitate observation, we set the values for each market in November 2025 to 100. One year later, within a 5 basis point range, the dollar depth index averaged only around 13, while the token quantity index remained around 28. In other words, even excluding the impact of price declines, we have still lost the vast majority of orders that originally existed within that price range.
If we further broaden the range to include all 20 levels of recorded order book depths in the statistics, the results differ; the median of the dollar depth index ultimately stands at 61, while the token quantity index reaches 127. This presents a starkly different picture — in a broader sample, the number of tokens on typical market orders is actually higher than before; but within the closest 5 basis point range to the market price, the number of orders has significantly decreased.
In other words, there is not a complete absence of liquidity in the order book, but rather that in the price range truly suitable for us to trade, liquidity has diminished significantly.
Diving Deeper into Some Details
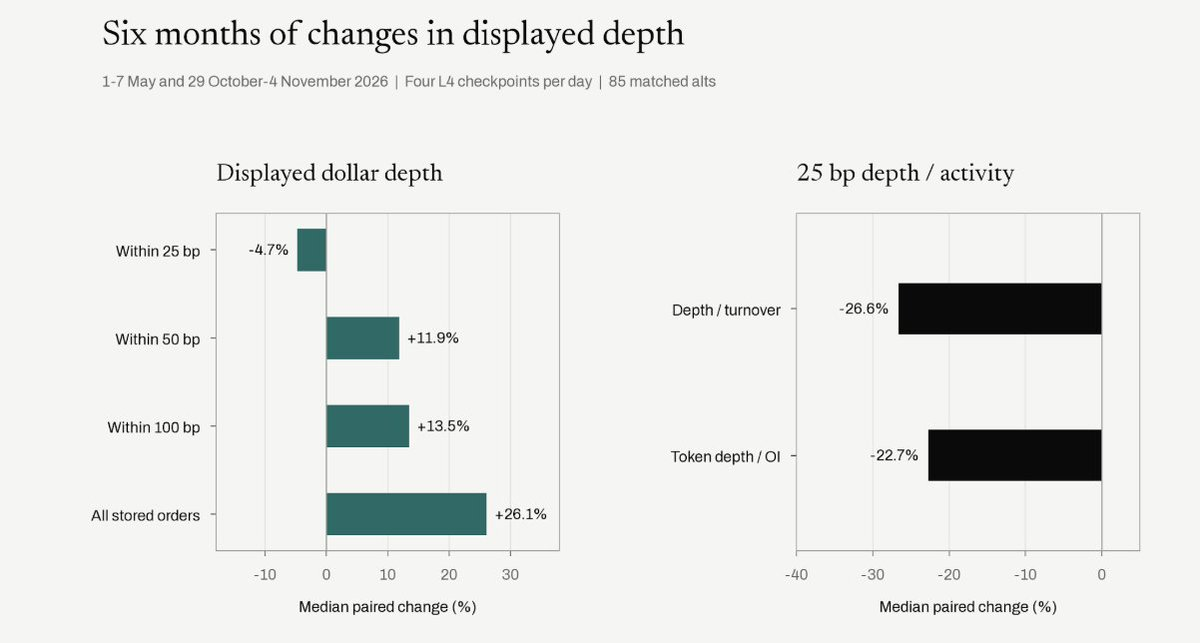
We believe it is necessary to present the data from the past six months separately. During this period, the overall depth actually improved (the improvement is primarily in areas further away from the market price, rather than the nearest transaction price portions).
If we further refine the analysis, we can examine the spread changes over the past year.
Surprisingly, until recently, Hyperliquid's spread has been gradually aligning with those of other platforms. Clearly, we need to wait a while longer to confirm whether this is indeed a trend or merely an incidental fluctuation.
However, the changes currently presented in the order book align well with the recent issue of increasingly centralized market structures and the problems reflected by market makers.
Is Market Competition Diminishing?
Next, I re-examined the underlying account structure and grouped main accounts with their clearly associated sub-accounts to avoid double-counting multiple accounts belonging to the same institution. In this way, even if we do not know which company these accounts specifically belong to, we can identify different account systems.
Previously, I thought that most of the trading volume on the platform might be contributed by a few large market makers, but the year-on-year trading data does not support this judgment.
I compared a complete week from a year ago with a recent complete week across the same 80 markets. The results showed that the median share of trading volume accounted for by the largest account group decreased from 25.2% to 14.6%. Therefore, I do not believe that the overall decline in liquidity over the past year can be simply attributed to one market maker monopolizing the market.
However, what we are more interested in is the recent changes on the quoting side.
Now, let's narrow our observation to the past month and use the same 72 assets as used in the spread benchmark. The timing here is quite noteworthy; from around October 30, as liquidity increasingly concentrated closer to market prices, spreads also expanded.
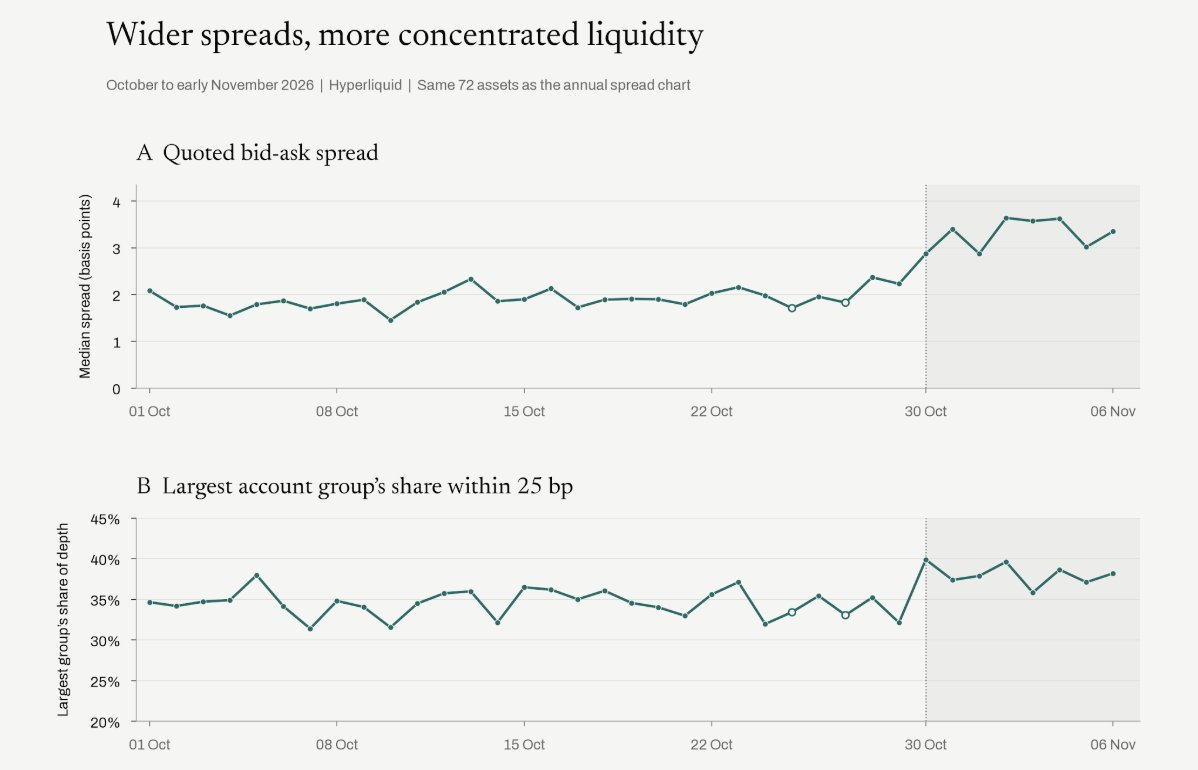
Comparing the periods from October 8 to 14 with October 31 to November 6 reveals the following:
- Within a 25 basis point range from the midpoint price, the median quoting share of the largest account group in each market rose from 34.5% to 38.6%;
- Meanwhile, the median quoting spread expanded from 2.13 basis points to 3.55 basis points.
This aligns more closely with the issues reflected by market makers recently.
However, this observation window also coincides with Binance's security incident on October 29, so solely relying on these trends, we cannot definitively attribute this change to priority fees or network congestion.
If we observe individual accounts, we also found that a large liquidity provider significantly reduced its quoting around November 3, while several other account groups saw their market share increase.
This may also explain some of the issues. Whether this is indeed the case will require time to verify.
Issues With Fee Structure
There is also a fairly fundamental problem: the fee structure.
We collected historical payment data of market maker fees from 54 account groups. Calculated on a volume-weighted rate, the bottom quarter of accounts (with the smallest trading volume) paid an average fee of 0.961 basis points, while the top quarter of accounts (with the highest trading volume) not only paid no fees but actually received a rebate of 0.236 basis points.
This implies that for smaller trading volume market makers, the fee gap they need to cover, considering hedging costs and bad fills, reaches approximately 1.20 basis points before any trading. This is a substantial cost for spreads that are only a few basis points wide. Smaller market makers are structurally disadvantaged.
We can also see a decline in market participation from the order book quotes themselves.
In the same 72 markets, comparing the periods from October 8 to 14 and October 31 to November 6, the average number of account groups providing quotes of at least $1,000 on both the buy and sell sides within 25 basis points of the midpoint price fell from 7.64 to 6.39. Even fixing token prices unchanged, 58 out of the 72 markets still experienced a decline in the number of such accounts.
This indicates that even excluding the impact of token price declines, the number of account groups providing meaningful quotes close to market prices continues to shrink.
HIP-4 Also Needs Small Market Makers
Network congestion is another challenge.
According to Hyperliquid's network congestion rules, the platform currently allocates resources based on the weighted market share of a given address from the previous UTC day. During periods of high congestion, the address can use a block space equivalent to twice its allocated share. This creates a cycle — you need trading volume to obtain an allocation, but obtaining an allocation is a prerequisite for creating trading volume.
When discussing HIP-4 with traders, we repeatedly heard feedback that when Hyperliquid experiences congestion, they are unable to place orders normally. These smaller market makers have actually provided considerable liquidity to the platform.
In our survey of 256 HIP-4 contracts on November 10, 47% of the visible depth within 25 basis points of the midpoint price came from four professional market maker wallets. While the scale of these markets is still relatively small, this situation is not uncommon for many binary option markets. If Hyperliquid hopes to establish a liquidity-rich long-tail eco-system for prediction markets, it must enable these market makers to participate reliably.
The core point this article wishes to convey is — the substantial liquidity of long tail assets was one of the important reasons traders chose Hyperliquid, and based on the markets we compared, Hyperliquid has begun to fall behind Binance in this advantage.
If the platform hopes to keep these order books competitive, it must ensure there are enough market makers able to bear the costs of continuous quoting. If institutions smaller than top market makers find it increasingly difficult to survive, then losing this competitive edge is likely just a matter of time. And for HIP-4 to succeed, it must ensure that small market makers can reliably provide quotes from the very beginning.
Hyperliquid should design its mechanisms around this goal.
免责声明:本文章仅代表作者个人观点,不代表本平台的立场和观点。本文章仅供信息分享,不构成对任何人的任何投资建议。用户与作者之间的任何争议,与本平台无关。如网页中刊载的文章或图片涉及侵权,请提供相关的权利证明和身份证明发送邮件到[email protected],本平台相关工作人员将会进行核查。


