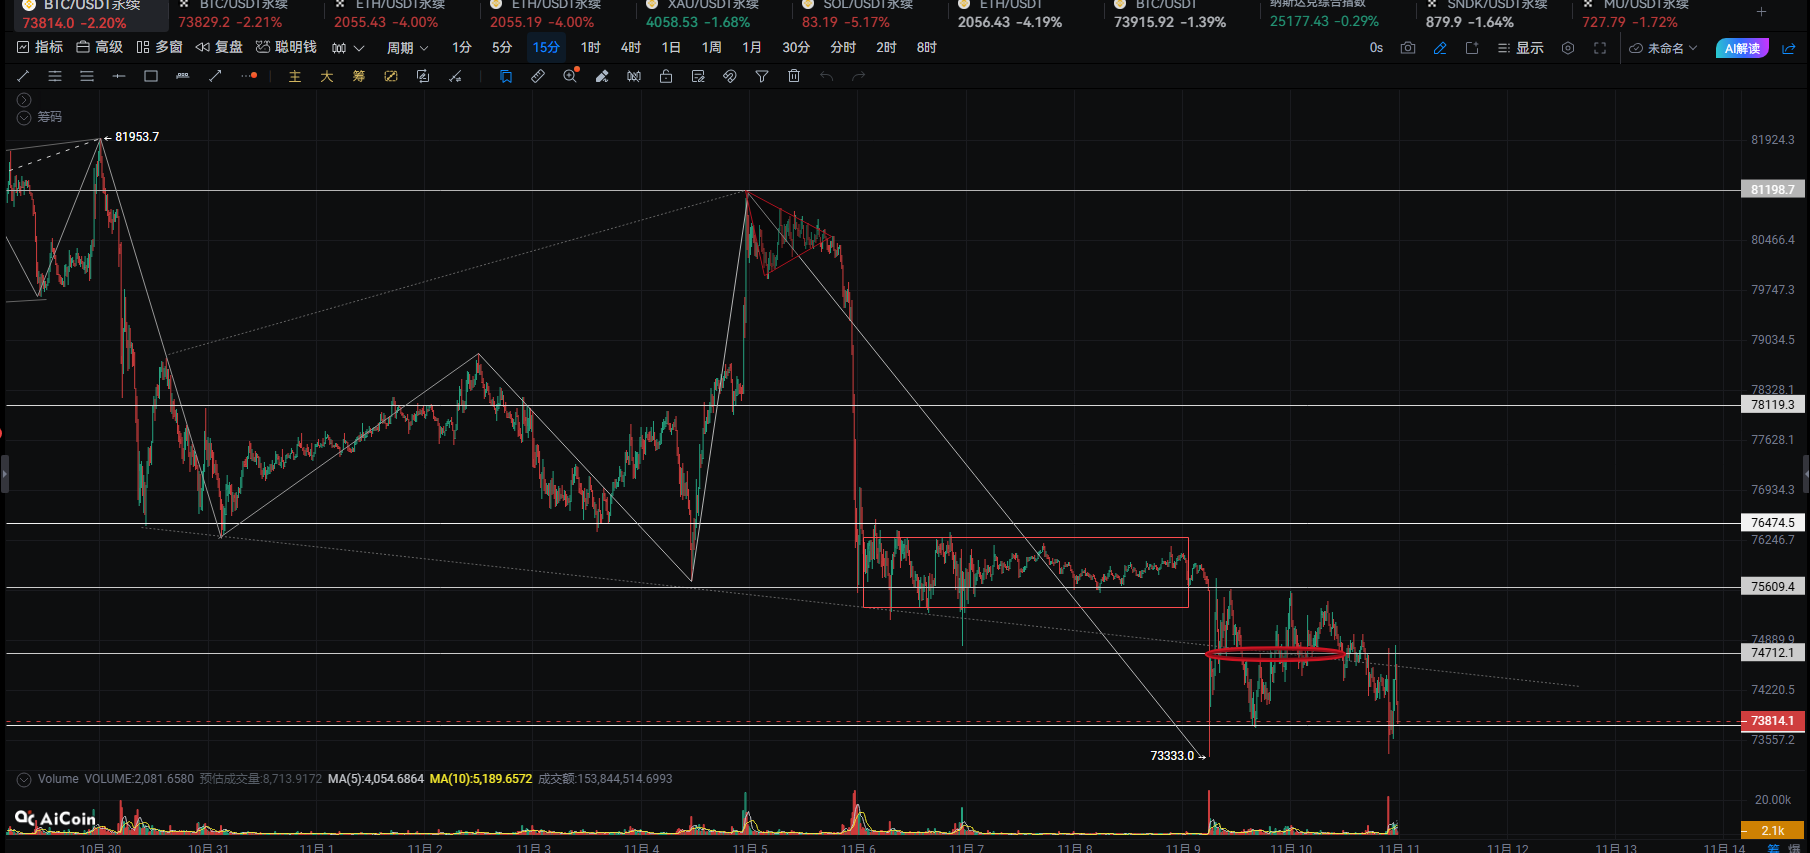
Today, there are two pieces of news that must be mentioned upfront. The first is that the rate of USDT supply contraction has already surpassed the period of FTX's collapse, which indicates that the funding support for market buying is significantly weakening, the total supply of stablecoins is shrinking, and the influx of capital in the market is exhausted. This is a mid-term signal more worthy of caution than single-day price fluctuations. The second is that the US CPI for October has significantly exceeded expectations, heating up the probability of the Federal Reserve raising interest rates by 50 basis points in December, combined with the hawkish statement from Logan that “at least two more rate hikes are needed” and Deutsche Bank's forecast of three consecutive rate hikes, leading to an extended tightening expectation. These two pieces of news both internally and externally precisely constitute the core logic of the current pressure on BTC: external liquidity tightening suppresses valuations, and internal capital shrinkage weakens support. Coupled with data showing a liquidation of 636 million dollars across the network in 24 hours, with over 80% of positions being long, the traces of long positions being forced out are very obvious. The Qinglan Crypto Classroom has always emphasized that the market should not be viewed by a single candlestick, but by the combined force of capital and sentiment, and today, these two pieces of news reflect the direction of that force.
Current Price and Time
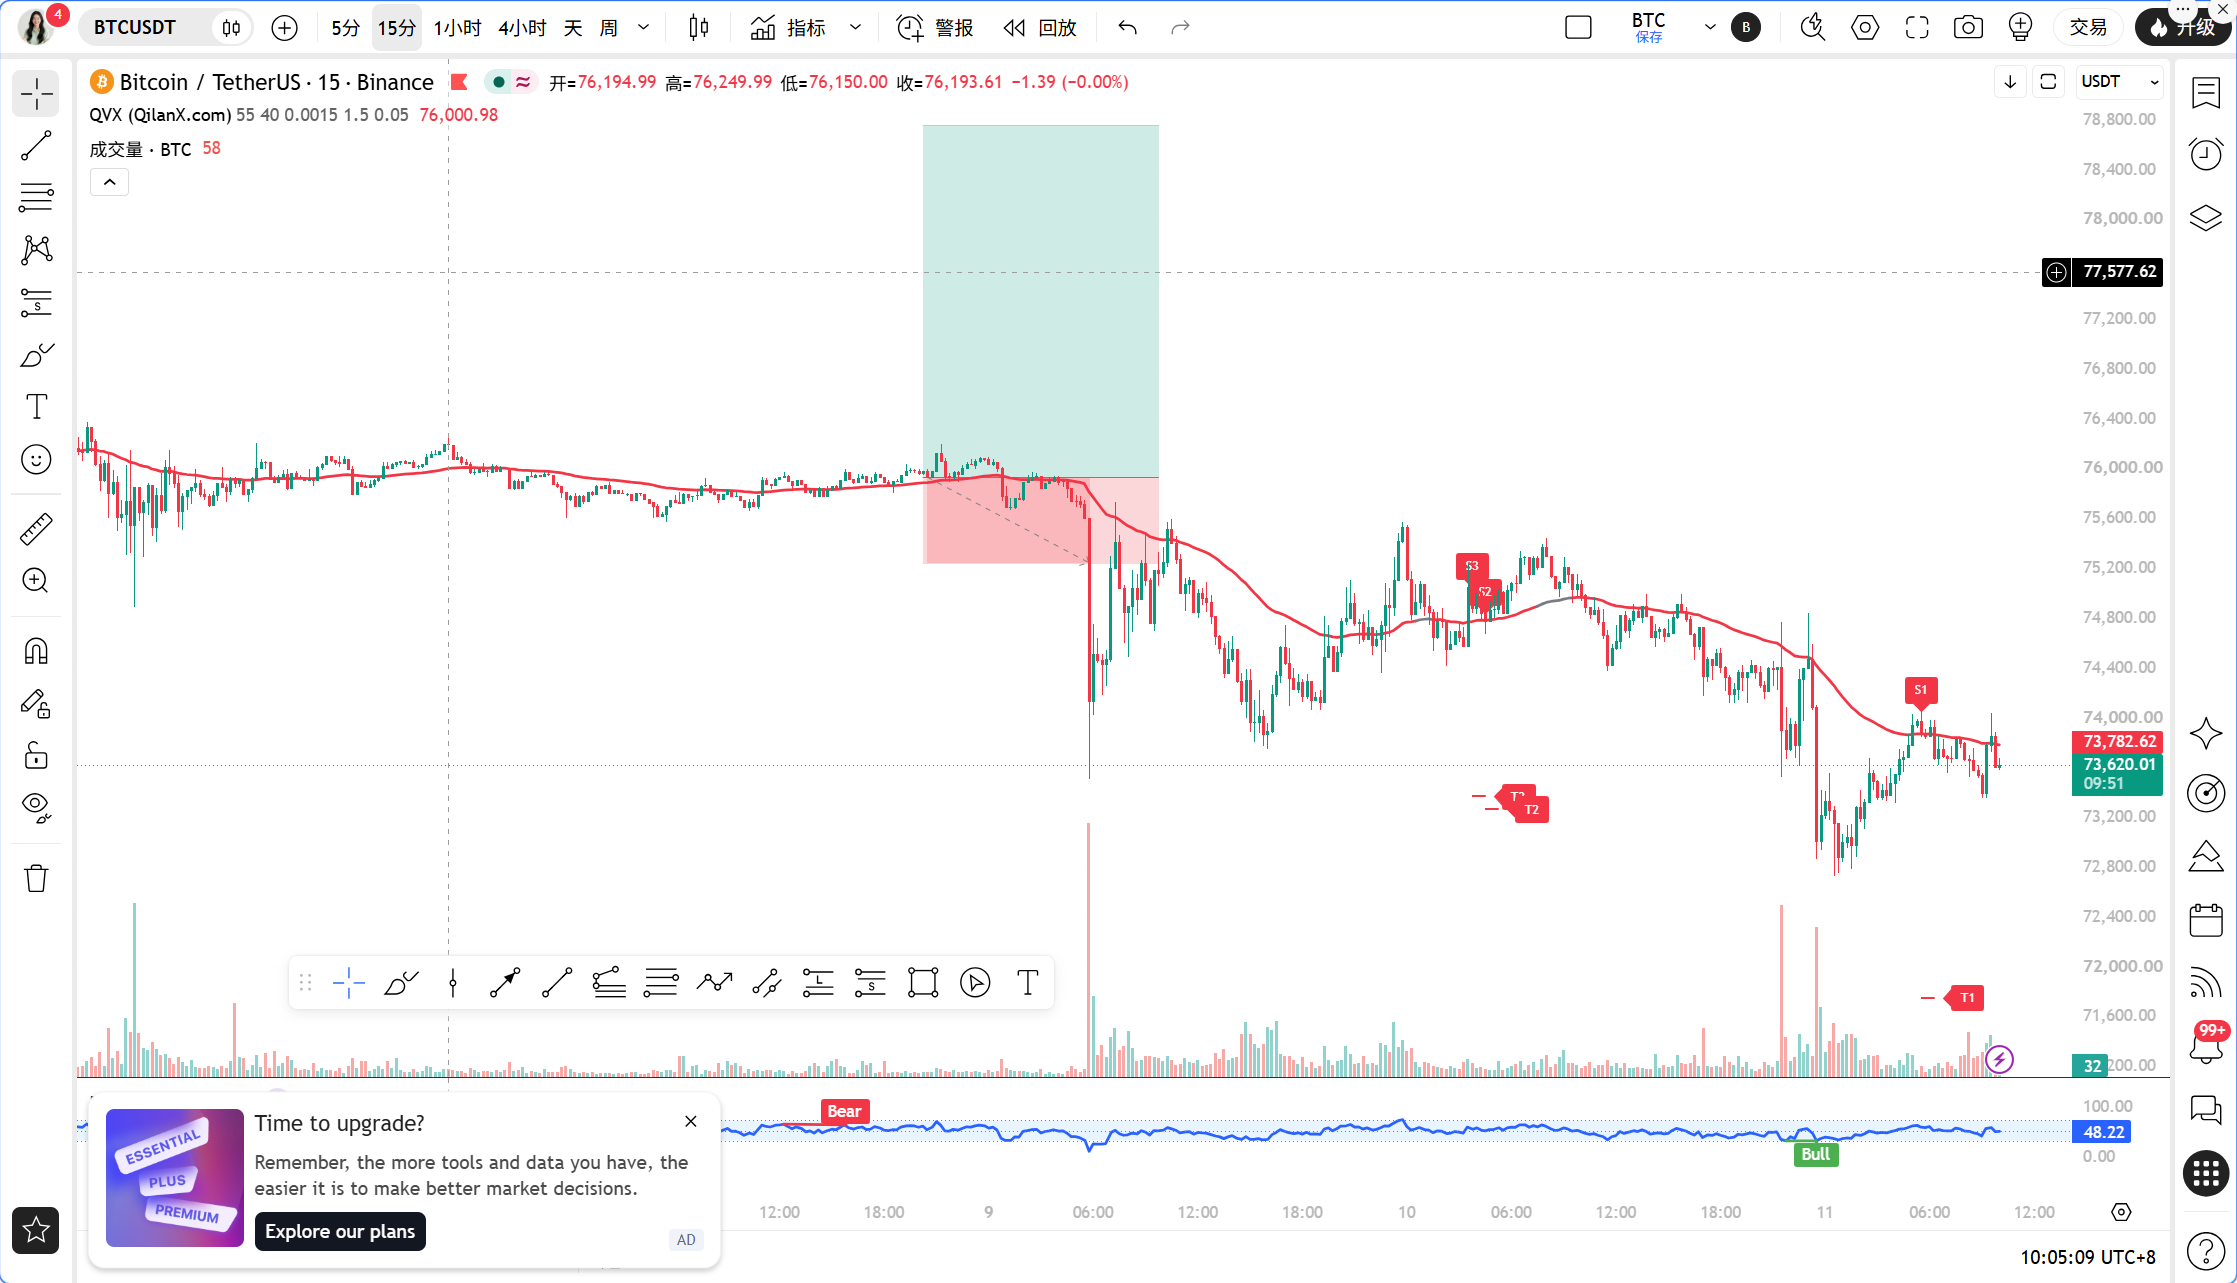
The current time is November 11, 10:03. The latest price of BTC is 73632 USDT, with a 24-hour price change of -2.48%. The Fear and Greed Index is 29, indicating a state of fear. BTC's market share is 59.73%, and capital still leans towards Bitcoin as a safe haven amid weakness, but overall risk appetite has clearly contracted.
Multi-Timeframe Status Overview
Daily Level: MA5=74703.10, MA10=76022.14, MA30=79298.31, with moving averages in a bearish arrangement, and the price is running below all moving averages. MACD: DIF=-1927.79, DEA=-1549.48, histogram=-378.31, indicating that bearish momentum is still being released. Daily RSI=28.74, having entered the oversold area, which suggests that a large-scale decline has lasted quite some time, but oversold does not equal a bottom, it only shows that the cost-effectiveness of seeking shorts is decreasing.
4-Hour Level: MA5=73707.43, MA10=74372.79, MA30=75210.56, similarly in a bearish arrangement, and the price is close to MA5. MACD: DIF=-747.40, DEA=-677.48, histogram=-69.92, indicating that the histogram is still negative, and no clear signal of momentum exhaustion has appeared at the 4-hour level. 4-hour RSI=36.23, slightly weak but not extreme.
1-Hour Level: MA5=73652.55, MA10=73613.86, MA30=74235.14, with short moving averages clustering at a low level, and MA30 exerting pressure from above. MACD: DIF=-285.63, DEA=-313.01, histogram=27.37, the histogram has turned positive, which is the only warm signal at the 1-hour level, indicating that short-term bearish momentum has somewhat converged. 1-hour RSI=41.38, neutral but slightly weak. The critical dividing line EMA55=74442.74, the current price 73632 is approximately 1.09% away from this line, clearly running below EMA55.
15-Minute Level: MA5=73653.46, MA10=73651.93, MA30=73672.64, the three lines are almost glued together around 73650, with price fluctuating narrowly around it. MACD: DIF=-5.63, DEA=0.84, histogram=-6.48, short-term momentum is weak but the amplitude is very small. 15-minute RSI=45.84, neutral. Overall, the 15-minute timeframe is in a low-level sideways correction state, with not much directional strength.
TPV Signal Verification
According to Qinglan's TPV system core rules, first check the trend location. The current price 73632 is clearly below the 1-hour EMA55 of 74442.74, which belongs to the bearish trend area, and there is no dispute about this.
Next, look at the three conditions for shorting. The first condition: the price is under pressure below the 1-hour EMA55, requiring two consecutive 1-hour candlestick closing prices below EMA55. Currently, in the last eight 1-hour candlestick closing prices, the count of those above EMA55 is 0/8, with 0 crossings, which completely satisfies this condition. The second condition: the pressure resistance pattern, the price failed to effectively touch EMA55 during the rebound and has fallen back, indicating a weak rebound structure, with pressure being effective. The third condition: lack of rebound strength, although the 1-hour MACD histogram has turned positive to 27.37, both DIF and DEA remain deep below the zero axis, and RSI has flatlined after rising to 41.38 from a low position; the rebound momentum is insufficient to form a reversal. Overall, in the three short conditions, the trend and pressure conditions are solidly met, while the momentum condition belongs to “lack of rebound strength” rather than “acceleration of decline,” thus establishing a bearish structure, but it leans more towards following a bearish trend after a pressured rebound rather than chasing a falling market.
In managing the volatile market, in the last eight 1-hour candlestick closing prices, the count above EMA55 is 0/8 with 0 crossings, and the price distance to EMA55 is 1.09%, far exceeding the 0.3% threshold, clearly not fitting the definition of volatility, currently in a unilateral bearish trend, the system allows for active shorting without managing range.
On-chain/Funding Aspect
The Fear and Greed Index is at 29, fear sentiment continues, and has not yet reached the extremely fearful area for bottom-fishing. 24-hour liquidations amount to 636 million dollars, with long positions accounting for 80%, indicating that leveraged longs have been significantly liquidated, and short-term selling pressure has somewhat eased, but liquidation maps show that dropping below 71000 USDT will trigger about 602 million dollars in long position liquidations, meaning that below 71000, there is still fuel for a chain drop. The contraction of USDT supply exceeding the period of FTX is the most alarming point, as the shrinking of the stablecoin supply directly corresponds to a reduction in market buying capital, limiting the height and sustainability of any rebound. Large whales are bottom-fishing ETH with 22 million dollars, 21 banks betting on 270 million dollars in stablecoins, and Square opens BTC payments to 4 million merchants; these are mid to long-term positives, but in the face of tightening expectations and liquidity contraction, it is difficult to alter sentiment in the short term. Nvidia dropped 6.72%, and Goldman Sachs warned of a 45 billion dollar selling pressure in US stocks in January, making the path of selling pressure from risk assets clear.
Key Defense and Offense Levels
The first resistance level above is the 1-hour EMA55 at 74442 USDT, which is the dividing line between bullish and bearish in the TPV system. Until the price stands above this level, any rebound is treated as pressure. Above this is a short-term resistance zone formed by the 1-hour MA30 at 74235 USDT and the 4-hour MA5 at 73707 USDT. The current price of 73632 is just below this zone, indicating a weak pressurization state. The first support level below is the integer level of 73000 USDT, below which is the liquidation concentration area at 71000 USDT. If this level is breached, the 602 million dollar long position liquidation will amplify the drop. The aggressive logic is clear: if it cannot stand above 74442, the bearish structure remains unchanged; if it can hold 73000, a low-level sideways correction will ensue; if it drops below 71000, downward space opens up.
Trading Ideas
Direction: Primarily short in the direction of the trend, do not attempt to bottom fish against the trend.
Entry Conditions: Wait for the price to rebound to the range of 73800 to 74200 USDT, and look for 1-hour long upper shadow lines, top formations, or bearish engulfing patterns indicating pressure, and when the 1-hour MACD histogram starts to shorten and RSI falls back from the current 41 area, enter a short position when all three resonate. If the price directly breaks below 73000 and rebounds weakly, one can follow up with a light position when rebounding from 73000 to 73200 without waiting for the rebound to occur.
Stop Loss: Set the stop loss for the short position above the 1-hour EMA55 at 74500 USDT, allowing enough margin for error. If it drops below the stop loss, it indicates that the bearish structure has been broken, and one should exit immediately without hesitation.
Target Levels: First target 73000 USDT, second target 72200 USDT, third target at the upper edge of the liquidation area at 71000 USDT. After reaching the first target, one can reduce the position by half, and move the stop loss on the remaining position to protect profits.
Risk Warning
The daily RSI has entered the oversold area, and should USDT supply contraction ease or large whales begin to bottom fish broadly, the bears could encounter a rapid rebound at any time; strict stop-loss measures must be followed.
Follow the Qinglan Crypto Classroom for more trading opportunities! Welcome to visit the official website www.qinglan.org
📊 Qinglan TPV Trading Strategy Backtest Reference
🕒 Last Backtest Time 11-11 07:00:02
Total Analysis: 5034 Backtest: 5024 Accuracy: 75.7% (3803/5024)
免责声明:本文章仅代表作者个人观点,不代表本平台的立场和观点。本文章仅供信息分享,不构成对任何人的任何投资建议。用户与作者之间的任何争议,与本平台无关。如网页中刊载的文章或图片涉及侵权,请提供相关的权利证明和身份证明发送邮件到[email protected],本平台相关工作人员将会进行核查。