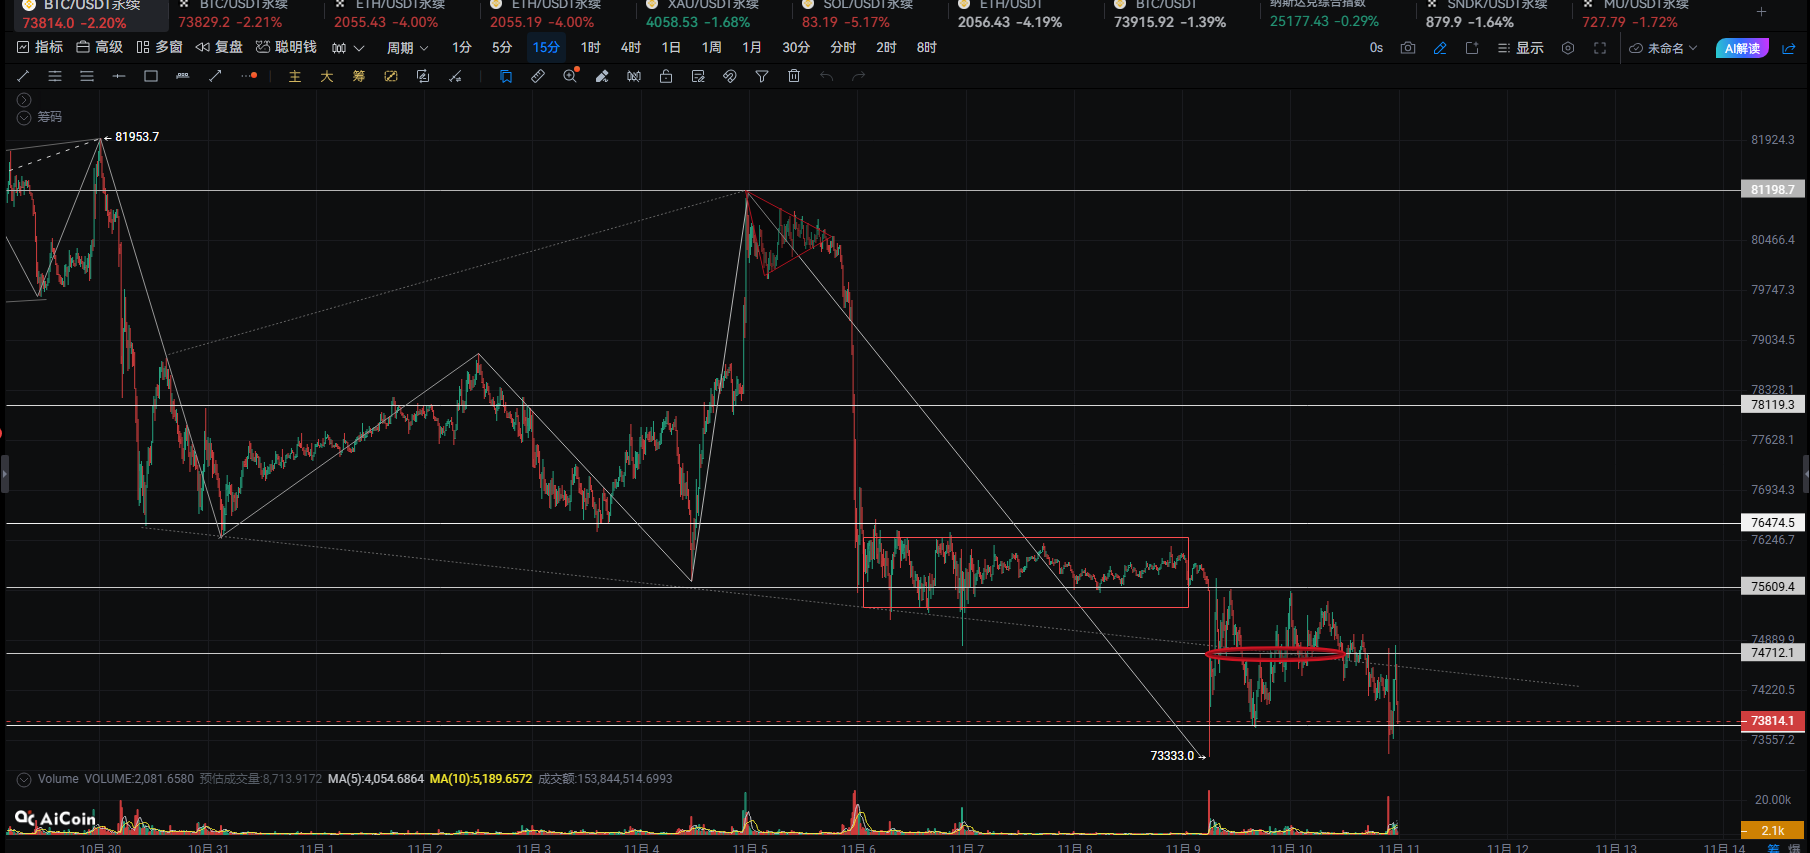
Crypto Circle Academician: On November 11, Bitcoin (BTC) formed a large bearish candle that swallowed three weeks of rebound: while everyone is trying to buy at the bottom, smart money is quietly doing this under the lower Bollinger Band
Friends, it's time for tea. BTC is now at 73,000, and it's time to "witness history" again. I see that some people in the group have already started calculating their year-end bonuses, of course those that are losses. In fact, being in the crypto circle is just like living, ups and downs are perfectly normal. Look at me; I wasn't panicked at 70,000, I wasn't euphoric at 80,000, and now at 73,000 I still eat and sleep as usual. Why? Because I never put all my money in, I never trade on trends I don't understand, and I never stay up late to watch the market
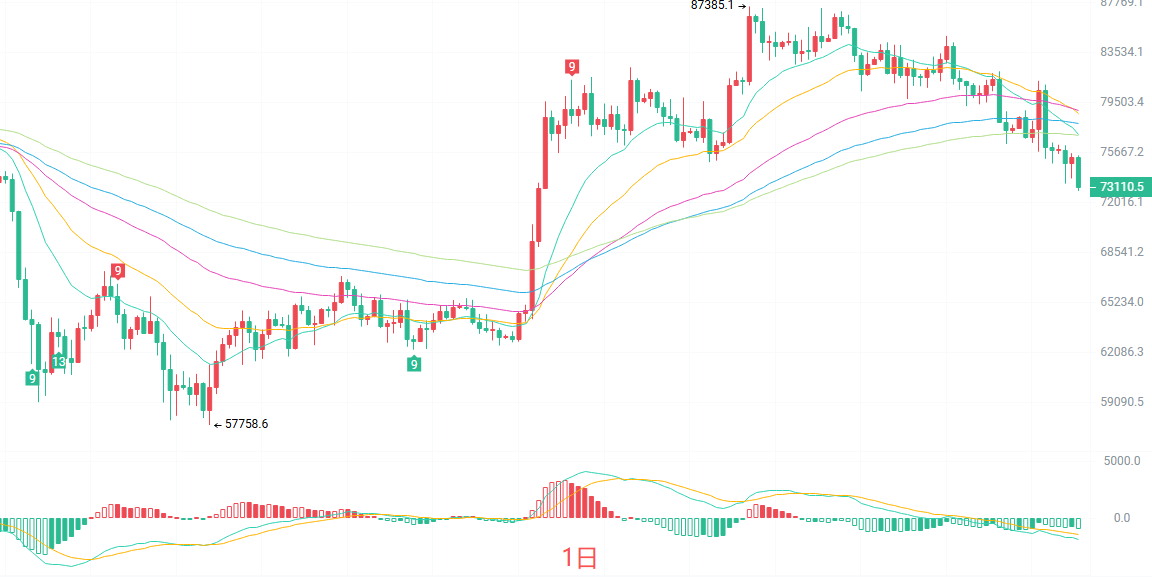
The daily K-line has formed a large bearish candle, having broken below EMA15 at 77,098, and is moving towards EMA120 at 76,974 below, with all the medium and short-term moving averages turning downwards, forming a typical bearish arrangement. The MACD indicator's green bars are still enlarging, indicating that there is no sign of exhaustion in bearish momentum. The lower Bollinger Band is around 73,431, which is the last support line in the short term. The TD sequence on the daily line has counted to 6, based on classic structure, it usually takes another 3 K-lines before a stop-loss signal may appear. Conclusion: the daily trend is still bearish, do not easily guess the bottom
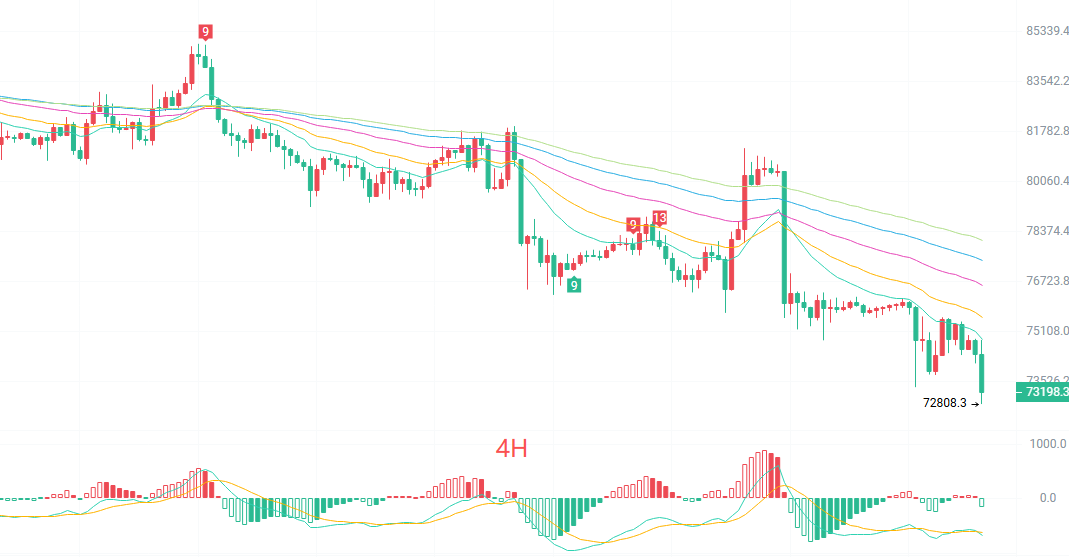
The four-hour K-line situation looks slightly better than the daily line, but only a little. The price is at 74,033, still suppressed below EMA15 at 74,964, EMA30 at 75,603, EMA60 at 76,624, and all other moving averages, resembling an open fan pressing down in layers. The MACD short-term bearish momentum has weakened and there is a technical pullback demand. The middle Bollinger Band is at 76,628, the lower band at 73,798, and the price is currently stuck between the middle and lower bands, with the lower band at 73,798 briefly pierced, reaching a low of 73,368. The TD sequence is at 3 for four hours, indicating that a short-term rebound may occur anytime, but the height of the rebound will be firmly suppressed by EMA15
Short-term reference:
Going north from 73,500 to 73,000 meets resistance, stop loss at 500 points, target looking towards 74,500 to 75,500
Going south from 74,800 to 75,300 stagnates, stop loss at 500 points, target looking towards 74,000 to 73,500
Specific operations are based on real-time market data; for more detailed information, you can consult the author. There may be delays in article publication, and it is recommended for reference only, risk is self-borne
免责声明:本文章仅代表作者个人观点,不代表本平台的立场和观点。本文章仅供信息分享,不构成对任何人的任何投资建议。用户与作者之间的任何争议,与本平台无关。如网页中刊载的文章或图片涉及侵权,请提供相关的权利证明和身份证明发送邮件到[email protected],本平台相关工作人员将会进行核查。