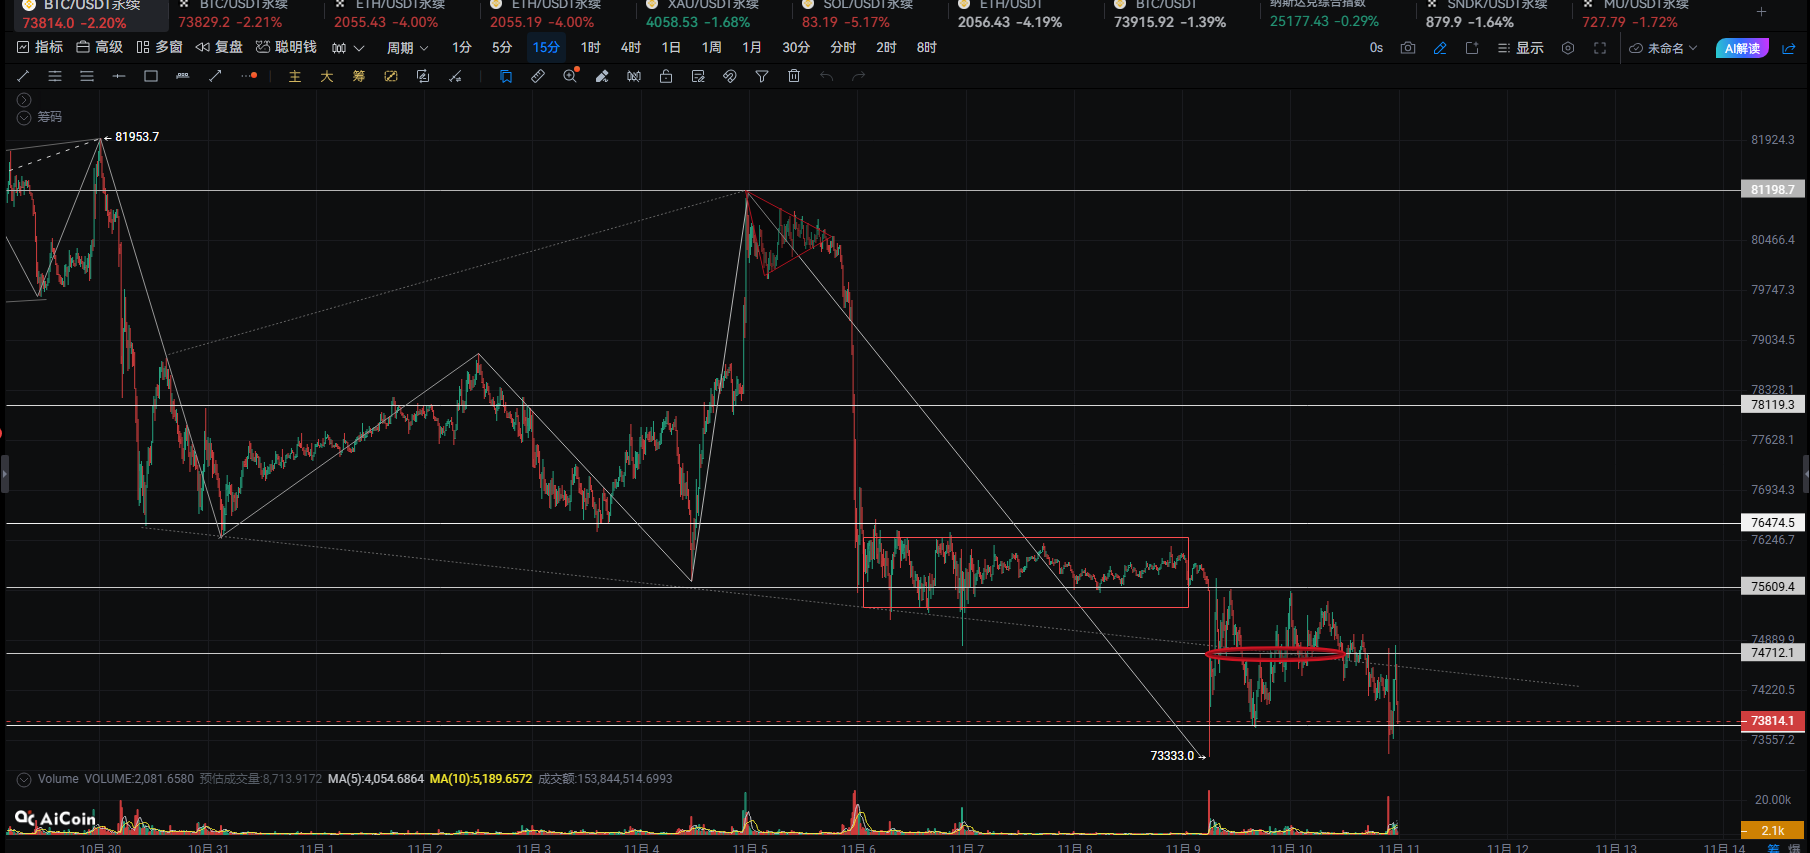
Cryptocurrency Scholar: On November 11, Bitcoin (BTC) swallowed three weeks of rebound with one bearish candle: When everyone is trying to catch the bottom, smart money is quietly doing this at the lower band of the Bollinger Bands
Friends, it's time for tea. BTC is now 73,000, and it's once again the moment to "witness history" every day. I see some people in the group are already calculating their year-end bonuses, of course the kind that comes from losses. Actually, engaging in cryptocurrency is just like life, ups and downs are very normal. Look at me, I wasn't flustered at 70,000, I wasn't euphoric at 80,000, and now at 73,000, I'm still eating and sleeping as I should. Why? Because I never put all my money in, I never trade on trends I don't understand, and I never stay up late to watch the market
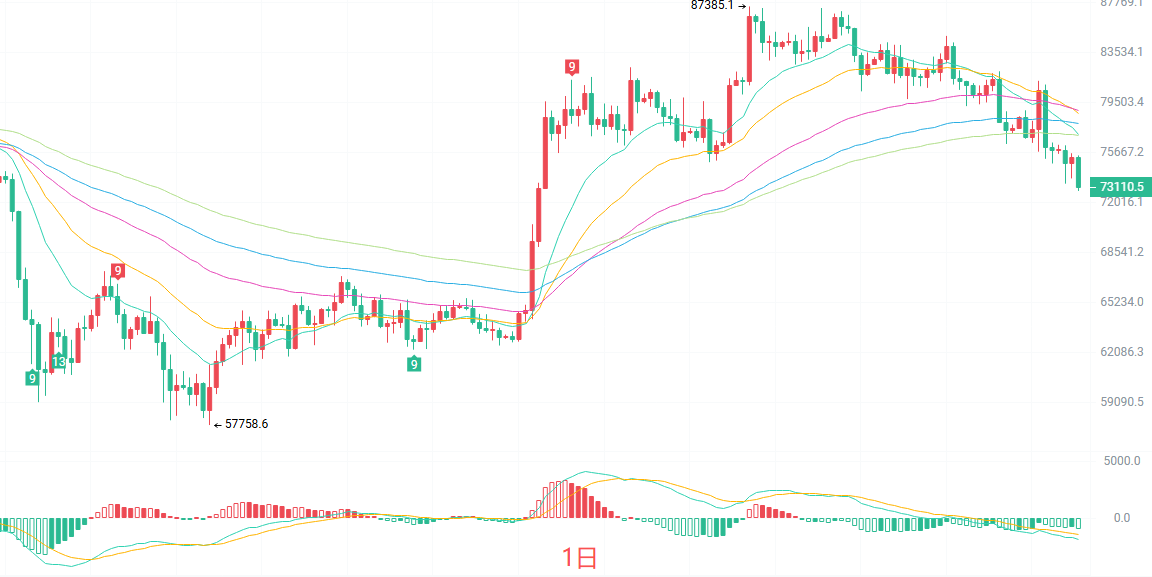
The daily candlestick chart shows a large bearish candle with a long wick, having fallen below the EMA15 reported at 77,098, currently moving toward the EMA120 reported at 76,974. All the short and medium-term moving averages are turning downward, creating a typical bearish arrangement. The MACD indicator's green bars are still expanding, indicating that there are no signs of exhaustion in bearish momentum. The lower band of the Bollinger Bands is around 73,431, which is the last support line in the short term. The TD sequence on the daily chart has counted to 6, according to classic structure, it usually takes another 3 candlesticks to possibly see a stop in the decline. Conclusion: The trend at the daily level remains bearish, don't easily try to catch the bottom
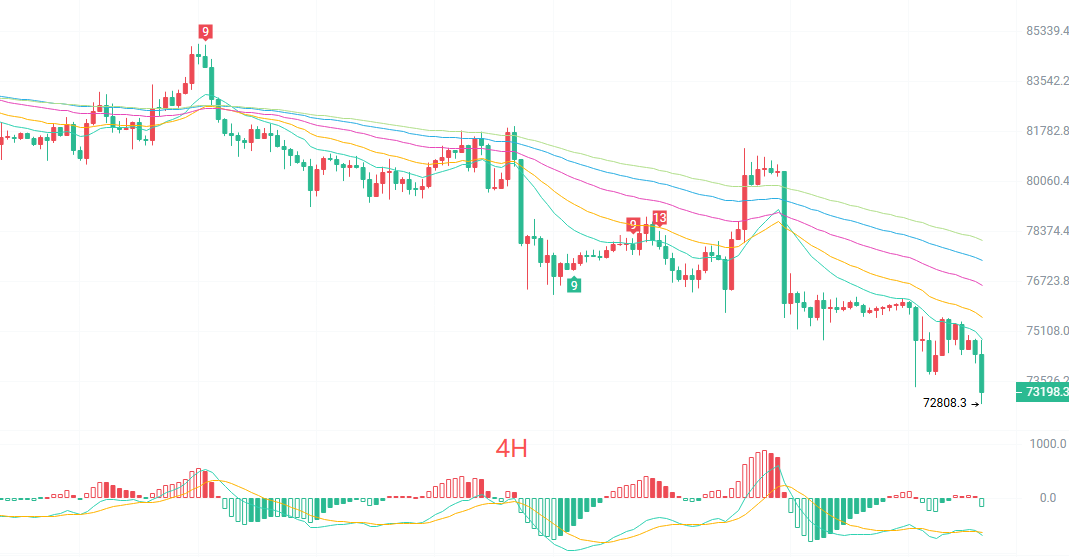
The four-hour candlestick situation looks a bit better than the daily, but just a bit. The price is at 74,033, still suppressed below the EMA15 reported at 74,964, EMA30 at 75,603, and EMA60 at 76,624. The four moving averages are pressing down like an opened fan. The MACD short-term bearish momentum has somewhat diminished, indicating a technical rebound demand. The middle band of the Bollinger Bands is at 76,628 and the lower band at 73,798, and the price is currently stuck between the middle and lower bands. The lower band at 73,798 was briefly pierced, with a low reaching 73,368. The TD sequence for four hours is at 3, meaning a short-term rebound could happen at any time, but the height of the rebound will be firmly pressed by the EMA15
Short-term reference:
Going north from 73,500 to 73,000 meets resistance, stop loss at 500 points, target looking at 74,500 to 75,500
Going south from 74,800 to 75,300 is stagnant, stop loss at 500 points, target looking at 74,000 to 73,500
Specific operations should be based on real-time market data. For more information, you can consult the author. There may be delays in article publication, so it is recommended for reference only, and risks are to be borne by oneself
Warm reminder: The above content is synchronized and updated by the cryptocurrency scholar on major trading platforms like Binance, Ouyi, Huobi, and more. More content can be found by adding me as a friend in the Binance Ouyi platform and joining my fan group
免责声明:本文章仅代表作者个人观点,不代表本平台的立场和观点。本文章仅供信息分享,不构成对任何人的任何投资建议。用户与作者之间的任何争议,与本平台无关。如网页中刊载的文章或图片涉及侵权,请提供相关的权利证明和身份证明发送邮件到[email protected],本平台相关工作人员将会进行核查。