Since the beginning of this year, the tech stocks in the US market have experienced significant fluctuations multiple times, and concerns about AI valuations and capital expenditures are still festering. In addition to frequently switching between "chasing technology" and "defending dividends," investors can take another perspective: whether companies can continue to generate cash and return it to shareholders.
This article introduces the meanings, uses, and limitations of two stock selection indicators: dividend yield and free cash flow, using the Southern Eastern FTSE East West Stock Selection ETF (03441.HK) as an example to break down the "Hong Kong high dividend + US stock free cash flow" barbell allocation idea. According to issuer information, as of September 30, 2026, the index tracked by this product has generated a total return of approximately 30.8% year-to-date, with a maximum drawdown of about 8% in the past year.
1. Avoiding Corrections is Harder than Expected
In July this year, the NASDAQ 100 index fell by about 11% within a month, entering a technical correction. For investors holding concentrated tech stocks, such corrections are directly reflected in their accounts.
The reason lies in the composition structure: if positions are concentrated in a single market or style, the ups and downs of the portfolio basically depend on the performance of that single asset. When tech stocks rise, the portfolio performs well, but it will also face pressure during corrections.
Switching between different styles may seem to help avoid corrections, but the practical difficulty is quite high. Investors need to judge when to exit and when to re-enter, and a misjudgment could lead to missing out on rebounds, while frequent trading may also increase costs.
Instead of predicting when styles will rotate, understanding where the returns of different assets come from may be more valuable. Below, let’s start with two indicators that measure a company's cash-generating ability.
2. Dividend Yield: How Much Cash Does the Company Distribute?
What is Dividend Yield?
Dividend yield is the ratio of the cash dividend paid per share by a company to its current stock price, used to measure how much cash return one might expect annually after purchasing at the current price.
For example, if a stock's price is HKD 50, and it paid a dividend of HKD 2.5 per share in the past year, the dividend yield is 5%.
Why is Dividend Yield Commonly Used in Hong Kong Stocks?
In the Hong Kong market, industries such as utilities, banking, infrastructure, and transportation have relatively mature businesses with limited reinvestment needs for expansion, often distributing a larger proportion of profits to shareholders in the form of cash dividends. Therefore, dividend yield is a commonly used indicator to measure the ability of such companies to return profits to shareholders.
Another mechanism characteristic of screening by dividend yield is that when the stock price falls, the dividend yield rises, making such stocks easier to include in the portfolio; conversely, when the stock price rises and the dividend yield falls, they may be removed. This creates a "buy low, sell high" effect to some extent.
Common Pitfalls of High Dividends
A high dividend yield does not necessarily indicate high investment value. Investors should pay attention to:
- “High dividends” caused by a significant drop in stock price: If the increase in dividend yield is mainly due to a sharp decline in stock price, it may indicate deterioration in the company's operations, and future dividends may not be sustainable.
- Whether the dividend is sustainable: One can examine the payout ratio (the proportion of profits paid as dividends) and the dividend history. Companies that pay dividends consistently higher than their profits or cash flows may find it difficult to maintain dividend payouts.
- Industry cycles: Some cyclical industries may pay more dividends during peak prosperity, but dividends may significantly decline when the industry weakens.
3. Free Cash Flow: How Much Cash Can the Company Freely Distribute?
What is Free Cash Flow?
Free cash flow is the cash available for a company to use freely after paying operational expenses and necessary investments (mainly capital expenditures).
For example, if a company generates USD 10 billion in cash from operating activities in a year, and incurs USD 3 billion in capital expenditures for building factories, purchasing equipment, etc., the free cash flow is USD 7 billion. This money can be used for dividends, share buybacks, debt repayment, or reinvestment.
Compared to accounting profit, free cash flow reflects the actual cash received and available for use by the company, with less influence from accounting methods, and is therefore commonly used to measure profit quality.
What is Free Cash Flow Yield?
Free cash flow yield is the ratio of a company's free cash flow to its market capitalization, which can be understood as: how much disposable cash can the company generate per year at the current stock price. It shares a similar concept with dividend yield, but measures how much the company "can pay out" rather than just "how much it has actually paid out."
Why is Free Cash Flow Commonly Used for Stock Selection in the US?
In the United States, companies have more diverse ways of returning value to shareholders. In addition to dividends, many companies more frequently return value to shareholders through share buybacks. If one only looks at dividend yield, one might miss companies that do not pay high dividends but consistently engage in substantial buybacks. Free cash flow can more comprehensively reflect a company's ability to return value to shareholders.
Current Market Context: How Capital Expenditures Impact Free Cash Flow
A topic of focus in the market this year has been the continuous increase in capital expenditures by AI-related companies. Observing how free cash flow is calculated shows that the larger the capital expenditures, the lower the free cash flow during the same period.
This does not imply that companies with high investment levels are unfavorable; capital expenditures may lead to growth in the future. However, for stock selection methods based on free cash flow, companies with significantly increased capital expenditures may rank lower. Understanding this helps clarify the performance differences of such strategies in various market conditions.
Limitations of Free Cash Flow
- Single-Year Distortion: If a company concentrates investments or receivables in a single year, the free cash flow for that year may be significantly higher or lower.
- Not Suitable for Growth Companies: Companies in a rapid expansion phase may have low or even negative free cash flow, but this does not necessarily indicate poor performance.
- Does Not Equal Shareholder Returns: High free cash flow does not mean that the company will distribute all the money to shareholders; it may also use the funds for acquisitions or retain cash.
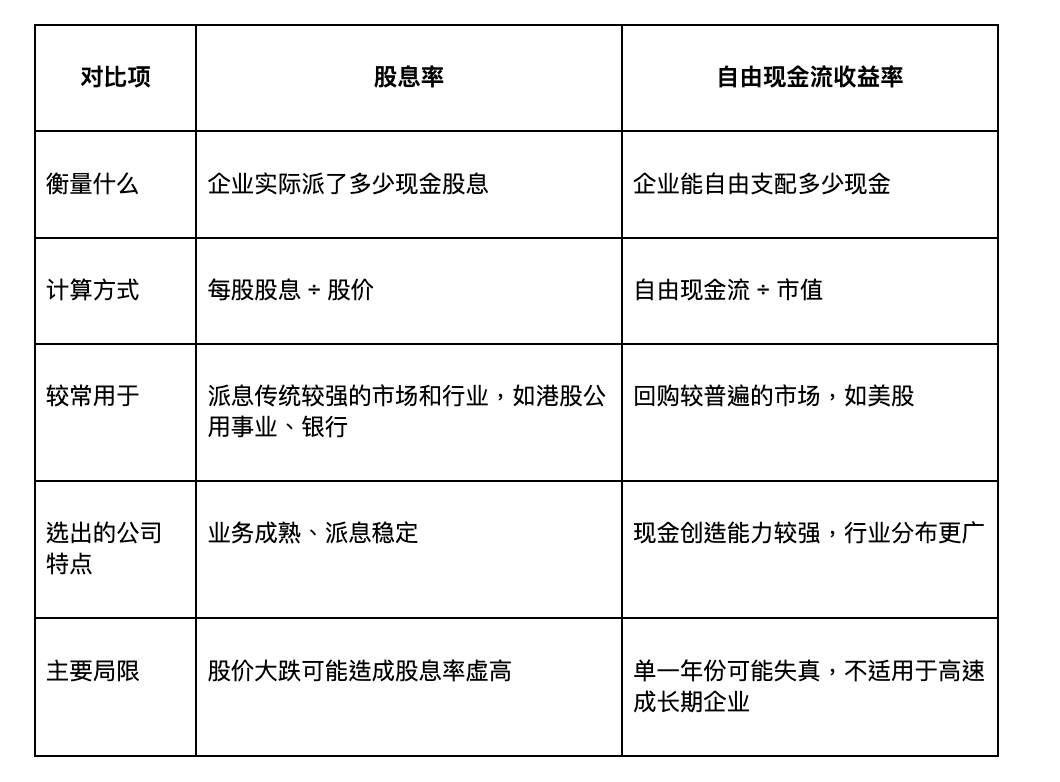
4. Comparison of Dividend Yield and Free Cash Flow
Both indicators focus on the same question: Can the company continue to generate cash and return it to shareholders? The difference lies in the perspective from which they are observed.
5. Putting the Two Types of Assets Together: The "Barbell" Allocation Idea
What is Barbell Allocation?
Barbell allocation refers to placing two types of assets with significantly different styles in the same portfolio, like the ends of a barbell: one end leans defensive, such as stable high dividend assets; the other end leans aggressive, such as companies with growth capabilities.
These two types of assets are driven by different factors, and their performances do not completely synchronize. When one type of asset corrects, the other may perform relatively steadily, which can lower the overall portfolio volatility compared to holding a single style.
This allocation also comes with trade-offs: when one type of asset experiences substantial gains, the portfolio only partially participates, leading to potentially underwhelming performance compared to holding a concentrated position in that asset type.
How to Achieve This?
Investors can explore two ways:
- Self-construct: Buy high dividend stocks or related ETFs, as well as large-cap US stocks or related ETFs, deciding the proportions themselves and periodically rebalancing. This offers more flexibility but requires self-screening, tracking, and adjustments.
- Utilize Rule-Based ETFs: Some ETFs have already placed these two types of assets into the same portfolio based on established rules and regularly adjust the components. Investors do not need to manage proportions themselves but must accept the product's established rules.
Example: Combining Hong Kong High Dividends with US Free Cash Flow
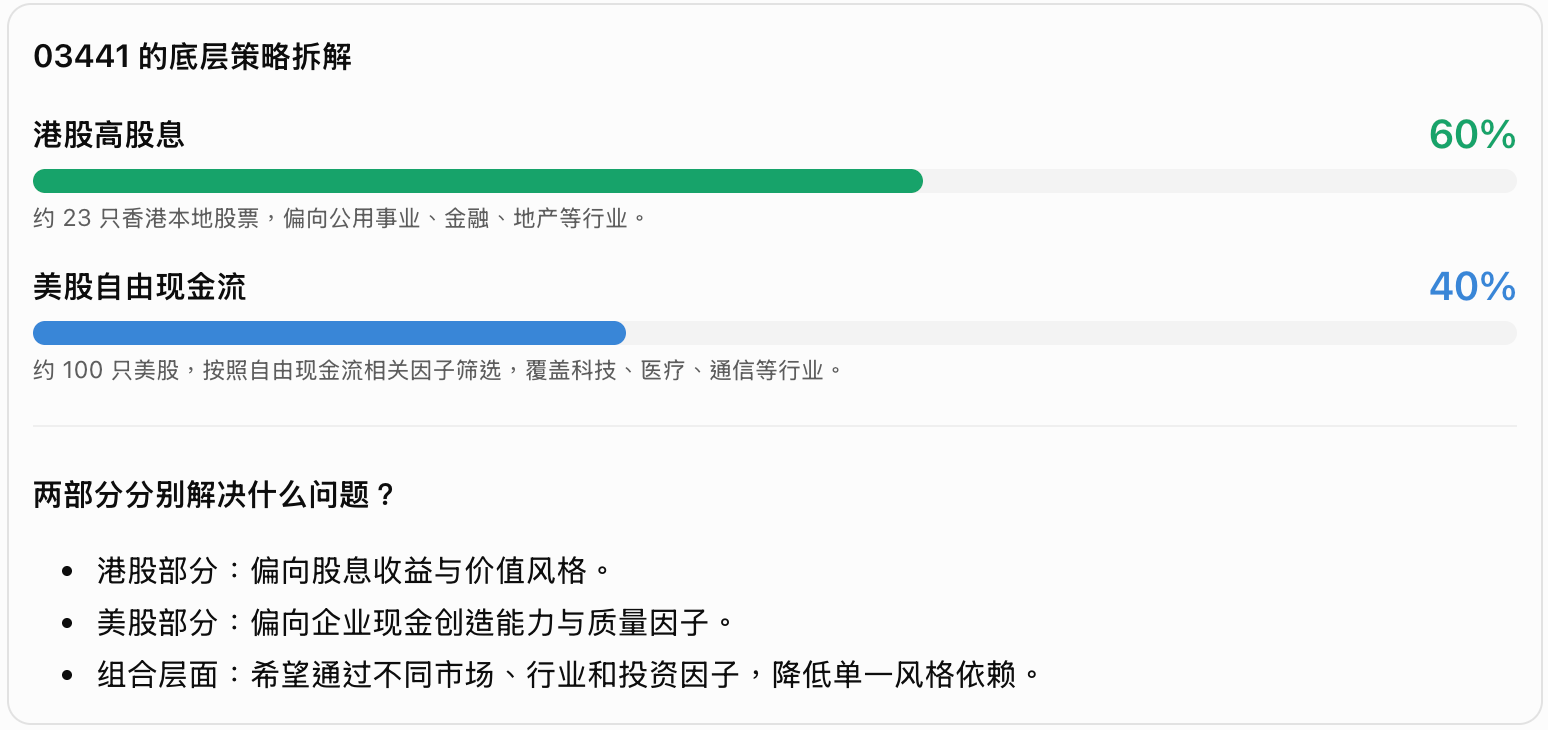
Taking the Southern Eastern FTSE East West Stock Selection ETF (03441.HK) as an example, the index that this product tracks allocates about 60% to local high dividend stocks in Hong Kong, screened by dividend yield, mainly distributed across industries such as utilities, finance, industry, and real estate; about 40% is allocated to US large-cap companies, excluding those with negative free cash flow, low quality, or high volatility from the Russell 1000 index, and selecting the top 100 companies with better free cash flow performance. The weights of the two markets are determined by index rules and are not actively adjusted based on market judgments.
In terms of returns, according to the issuer's information, as of September 30, 2026, the index has achieved a return of approximately 30.8% year-to-date, with a return of about 36.7% in the past year. On the product level, 03441 has cumulatively risen over 30% since its inclusion in ETF Connect in November 2025, ranking first among all southbound ETFs in terms of returns.
According to the issuer's information, as of September 30, 2026, the index experienced a maximum drawdown of about 8% in the past year, which is lower than that of the NASDAQ 100 index, Hang Seng Index, and S&P 500 Index during the same period, indicating relatively low historical drawdown. It should be noted that this is the past performance of the index and does not represent the future performance of the product; actual fund returns will also be affected by fees, tracking errors, and other factors.
6. Before Investing, Consider the Following Points
- Do I understand the selection criteria for the assets I chose? Companies selected by dividend yield or free cash flow may perform very differently in various market conditions.
- Do I already have overlapping positions? If I already hold a significant number of high dividend stocks or large-cap US stocks, adding similar assets may increase concentration.
- Can I accept relatively worse performance during a rising market? Diversified allocation can reduce volatility but may also lower participation in strong market conditions.
- What are the actual trading conditions of the product? Compare management fees, buy-sell spreads, trading volume, tracking performance, and dividend arrangements to avoid making decisions based solely on recent price movements.
Summary
High dividend assets are often seen as defensive tools, while tech stocks are often viewed as sources of growth. However, from the perspective of "Can the company continue to generate cash?" both can be understood through similar logic: dividend yield measures how much companies have actually distributed, while free cash flow measures how much companies can distribute.
Putting both types of assets into the same portfolio offers the opportunity to reduce dependence on a single market or style, but it also means lower participation when one type of asset is strongly rising. At the same time, risks such as industry concentration, interest rate changes, exchange rates, and market volatility still exist.
Whether self-constructing a portfolio or using a rule-based product, investors should first understand the selection criteria, risks, and costs before deciding whether it aligns with their investment goals.
(The product information mentioned in this article, 03441.HK, is provided by Southern Eastern Asset Management Limited.)
Risk Warning: This article is for general market information and investor education only and does not constitute investment advice, nor is it an offer, solicitation, or recommendation to buy or sell any securities or funds. Past performance does not represent future performance. Investing in securities and ETFs may result in a loss of principal; investors should read relevant product documents and fully understand the risks before investing. The products and services mentioned may not be recognized or registered in all jurisdictions and are not offered to persons in jurisdictions where prohibited or restricted by relevant laws; specific regulations depend on applicable laws in the respective locations.
免责声明:本文章仅代表作者个人观点,不代表本平台的立场和观点。本文章仅供信息分享,不构成对任何人的任何投资建议。用户与作者之间的任何争议,与本平台无关。如网页中刊载的文章或图片涉及侵权,请提供相关的权利证明和身份证明发送邮件到[email protected],本平台相关工作人员将会进行核查。


