Similarly, when prices decline, sometimes both price and trading volume weaken together, while other times, as the price falls, OBV lifts its head first. Today, I will use a few charts to clarify the differences between these two movements and discuss how to analyze OBV and EMA52 together.
How much it has fallen and whether it's finished falling are two different things
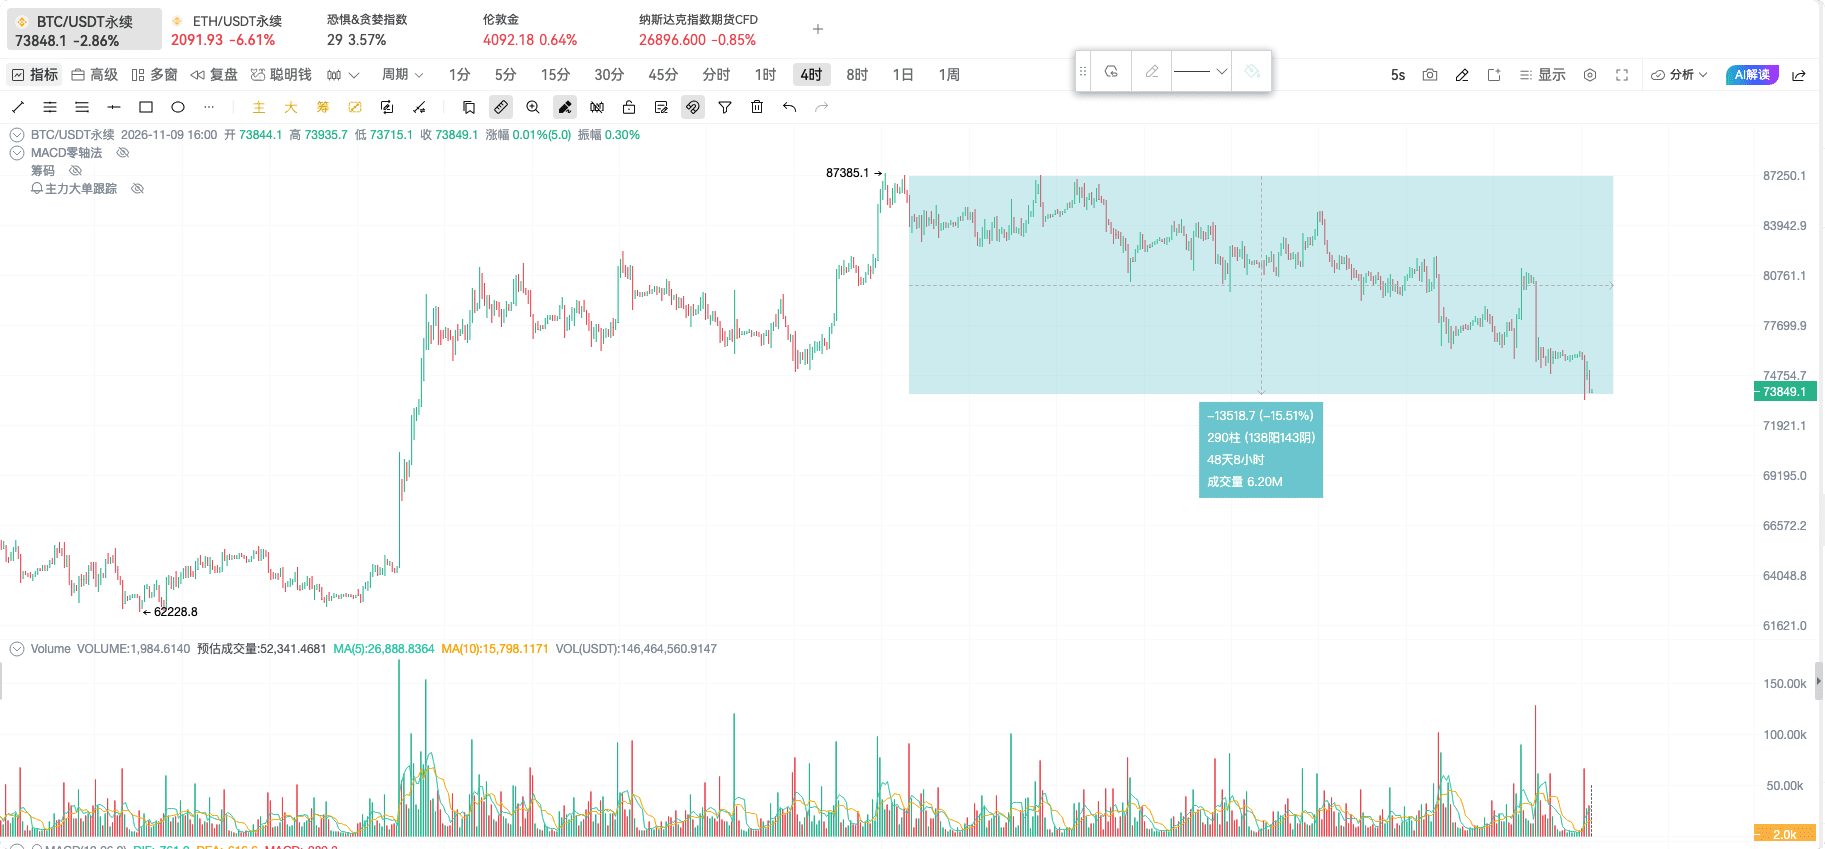
Let’s return to the market from the live broadcast on November 9. Based on the selected interval, BTC has pulled back about 16% from its high, with a low point around $73,000.
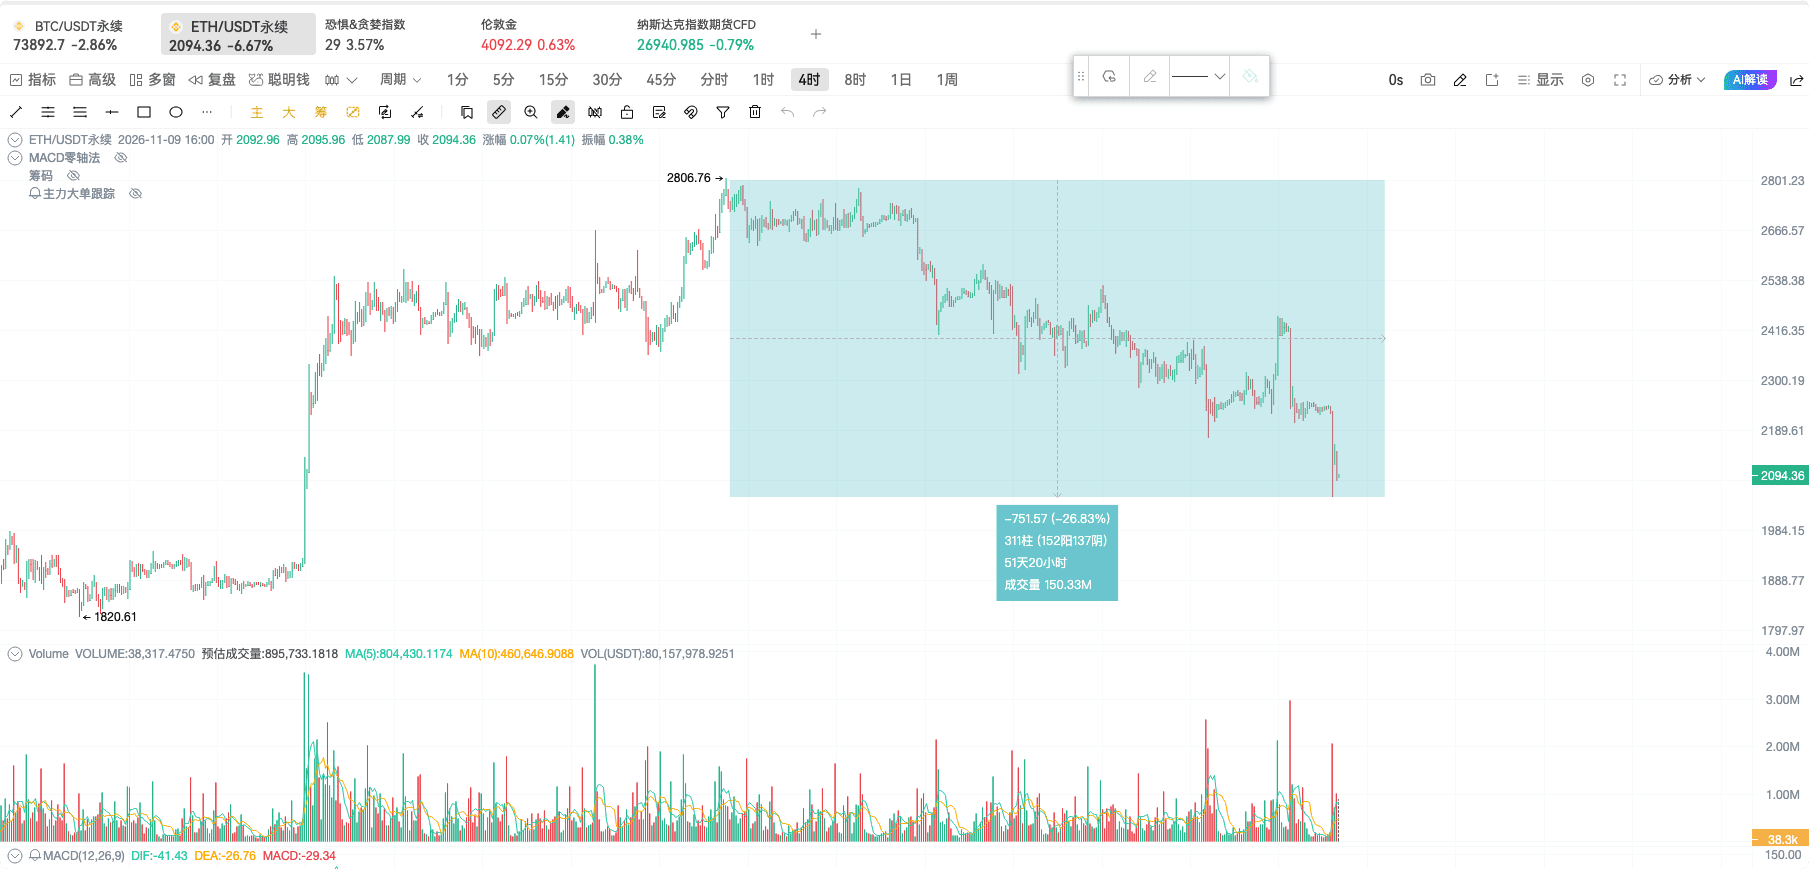
ETH has retraced about 26% in the selected interval shown in the chart. These two numbers tell us how much the decline has been. To find clues about stopping the decline, we need to look at how trading volume behaves during the price dip.
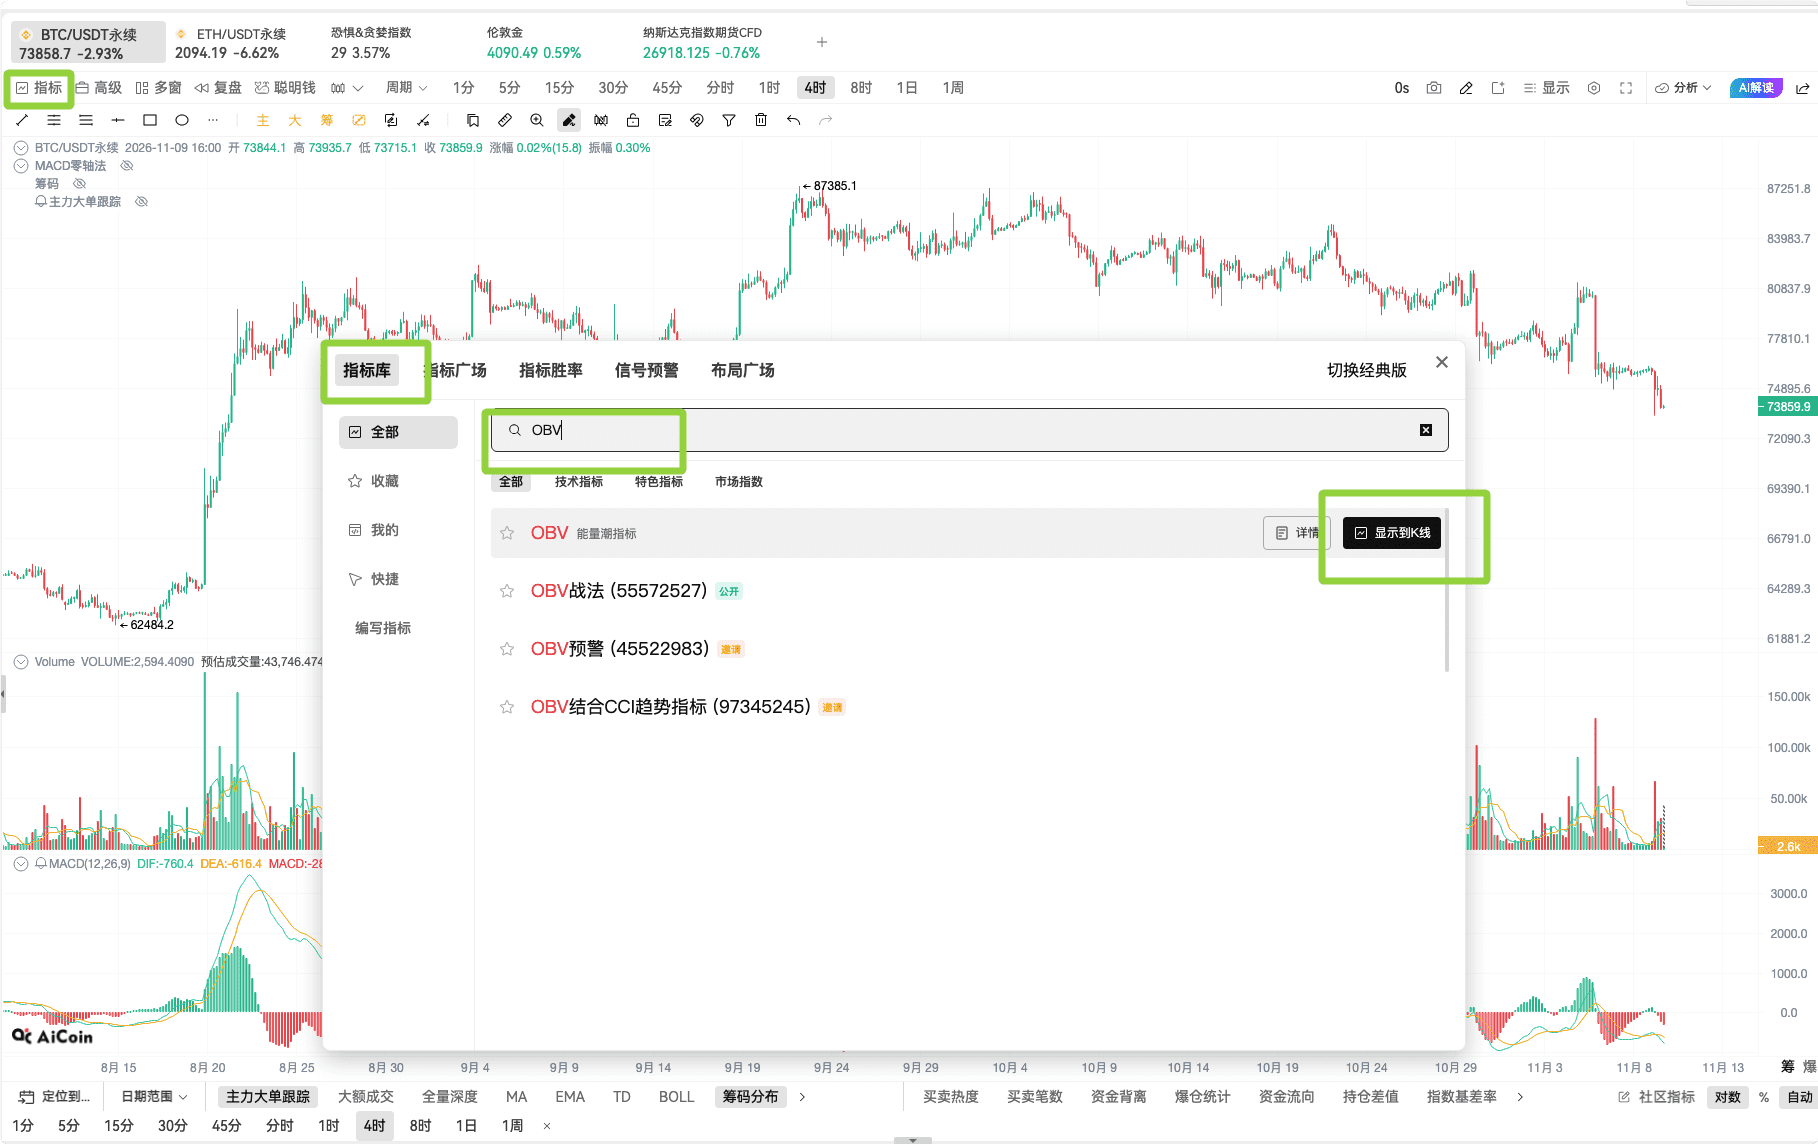
Calling up OBV in AiCoin
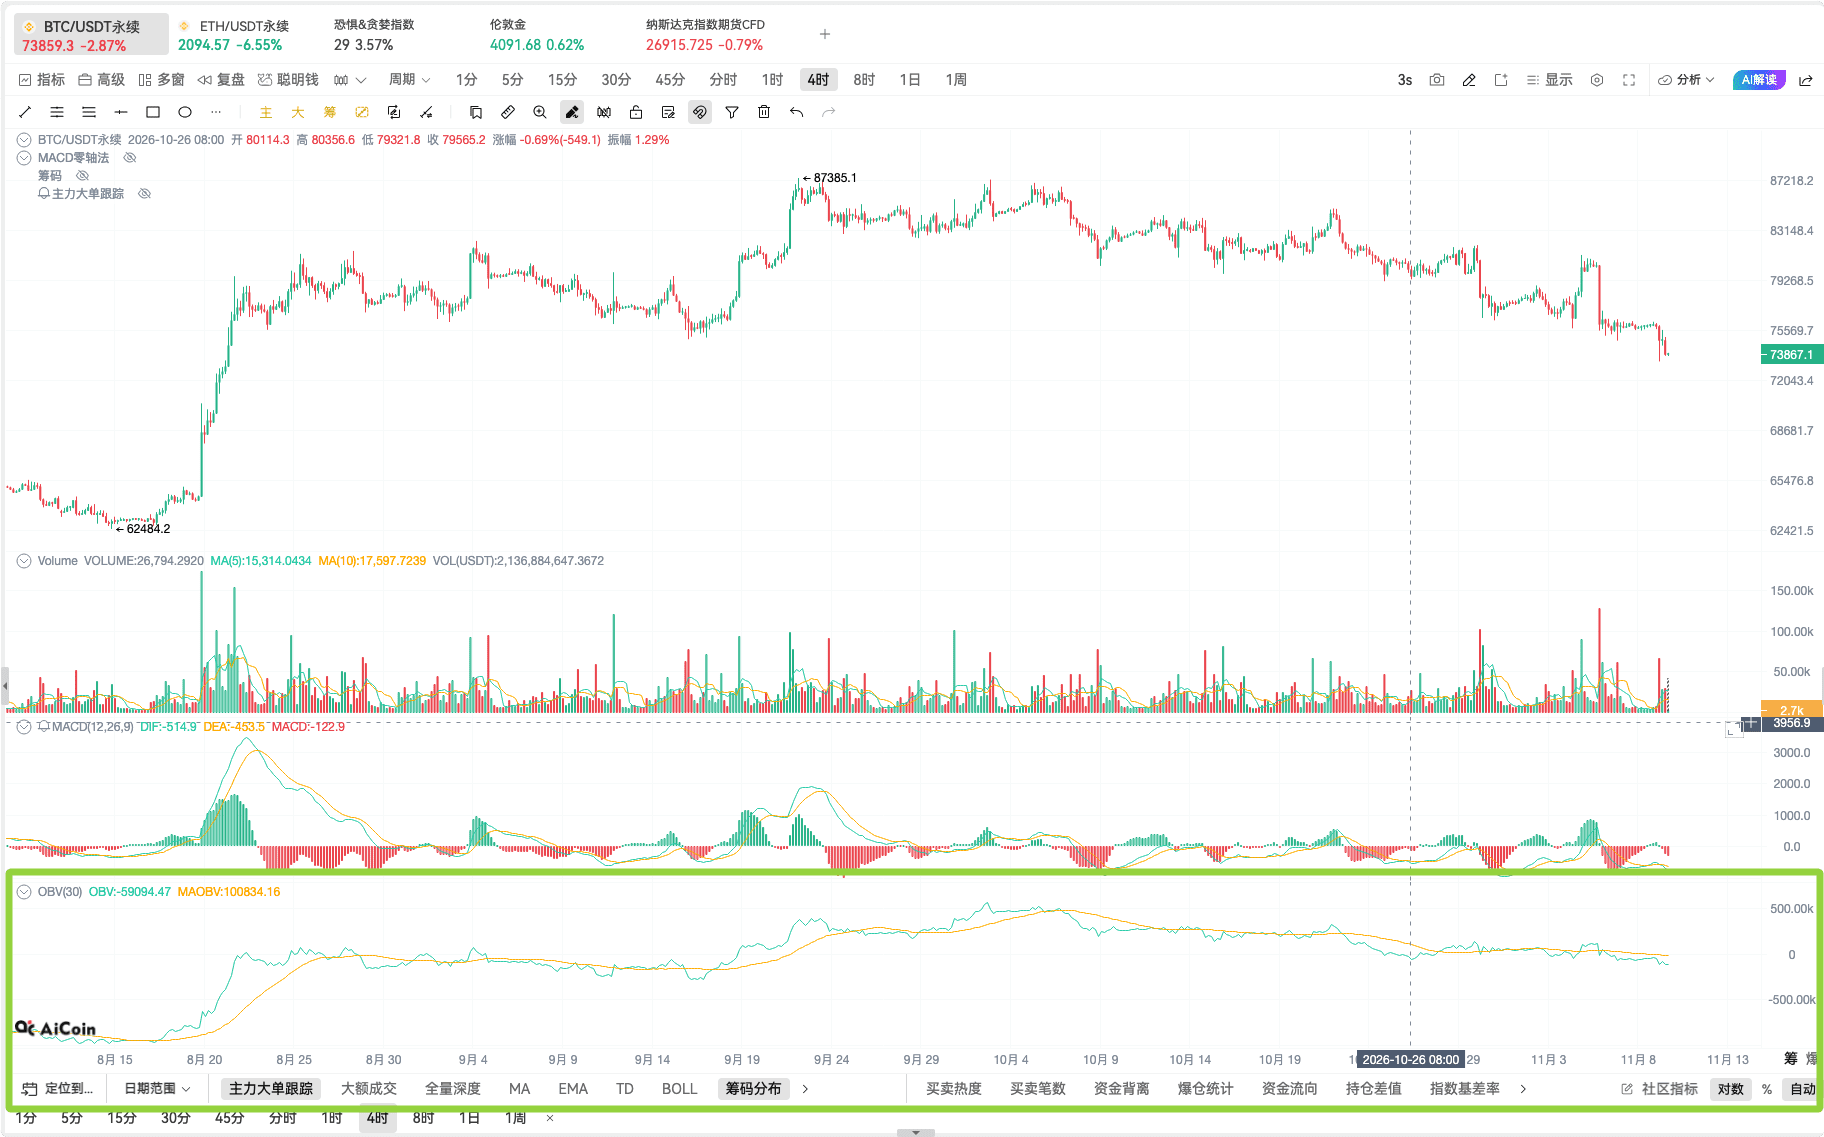
Search for OBV in the indicator menu, also known as "On-Balance Volume." Once selected, the indicator will appear below the main chart.
The calculation of this line is easy to remember. Compare the closing price of this period with the previous period; if it closes higher, add this period's volume; if lower, subtract it, and if even, do nothing. I mainly look at which direction it moves and compare it with the prices above.
Trend in the same direction, divergence indicates change
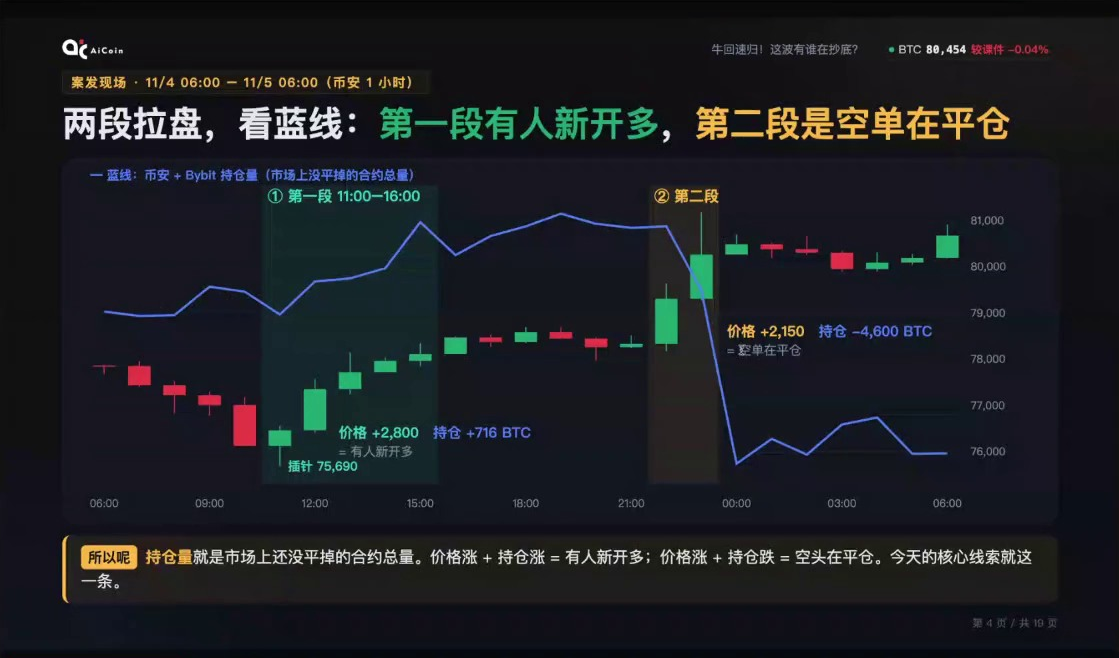
When the price rises, and OBV also lifts, it shows that this recent rise is supported by trading volume. The segments marked with lines in the chart clearly show whether the trends are moving in the same direction when viewed together in the two columns.
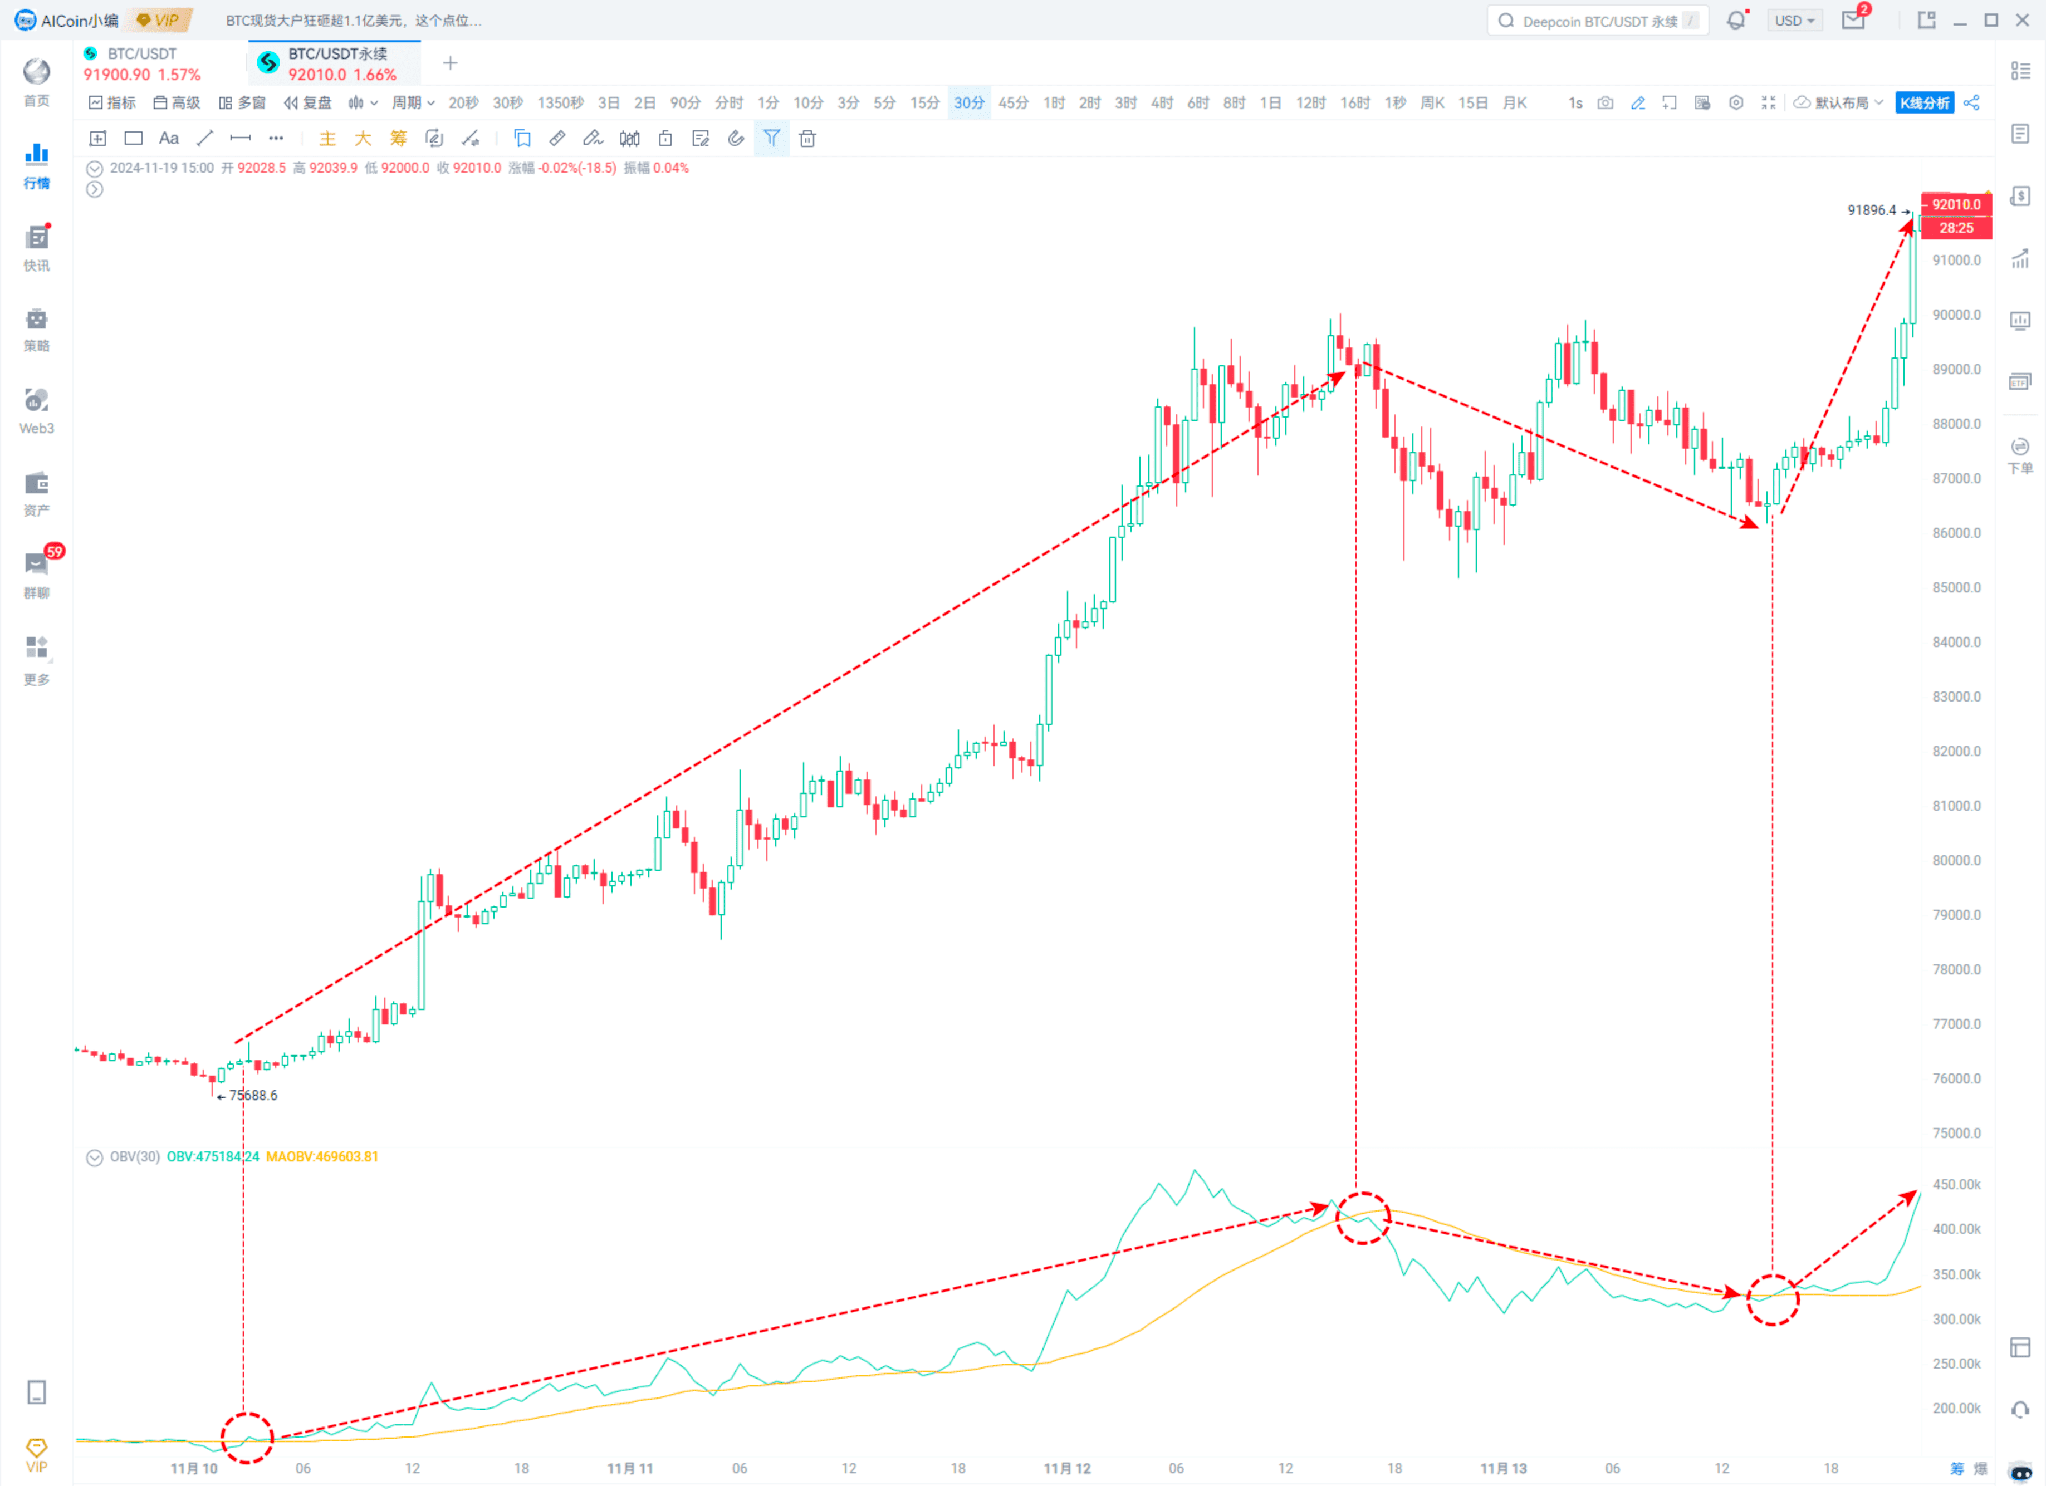
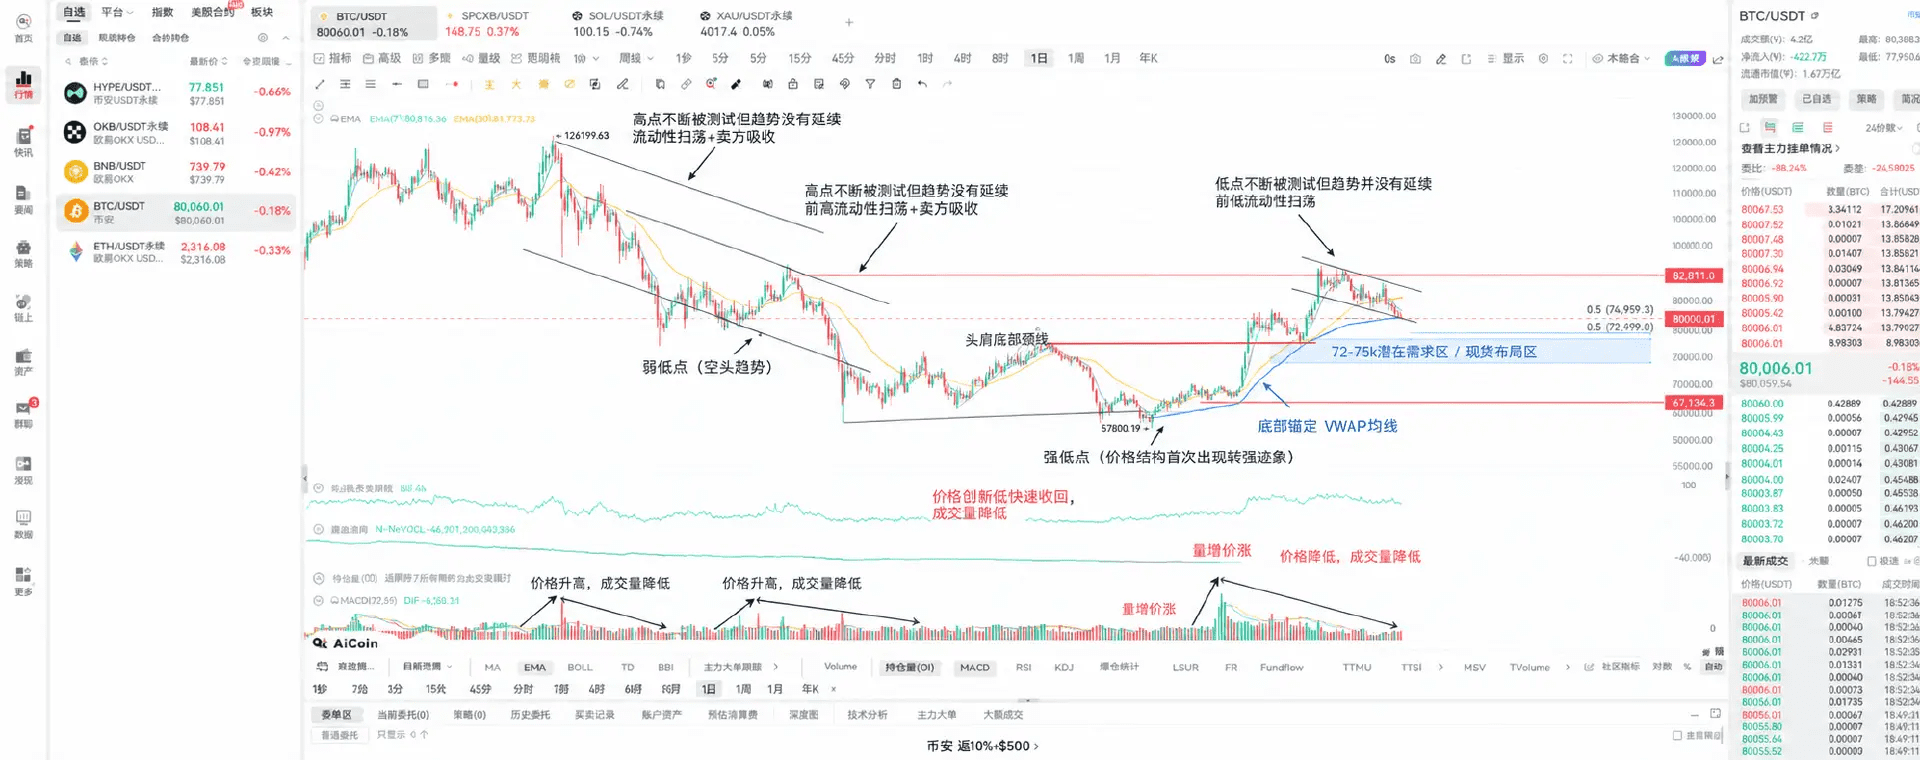
Another pattern occurs when the price is still testing the low points, but OBV turns upward first. This kind of divergence is worth noting, and then we see if the price can stabilize. If OBV lifts first, it merely indicates that the previous decline may be starting to ease.
On the five-minute chart, check if it can hold steady after a sharp rise
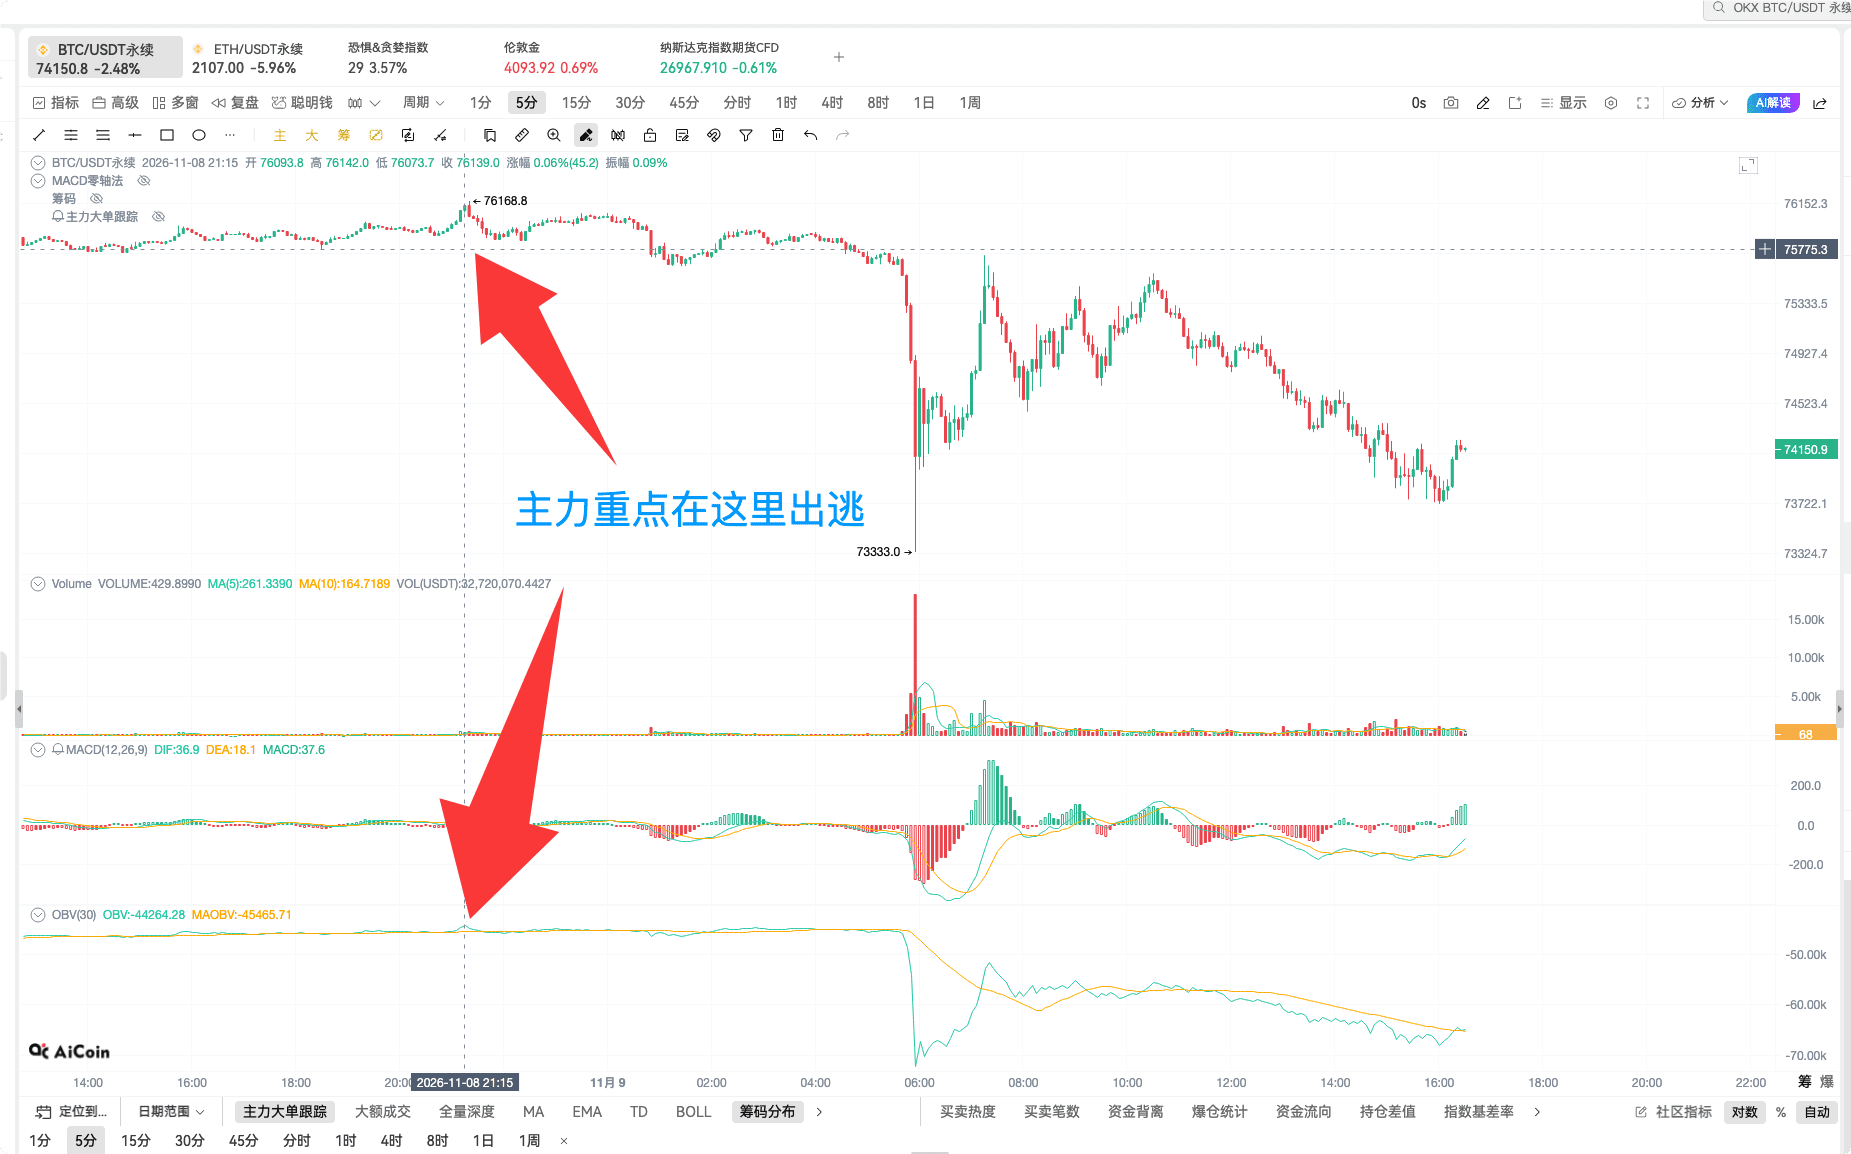
Switching to the five-minute chart, when I see OBV surging sharply, I will shift my focus back to the K-line above to see if the price can hold steady after rising. The arrows in the chart mark a period of short-term sharp rises.
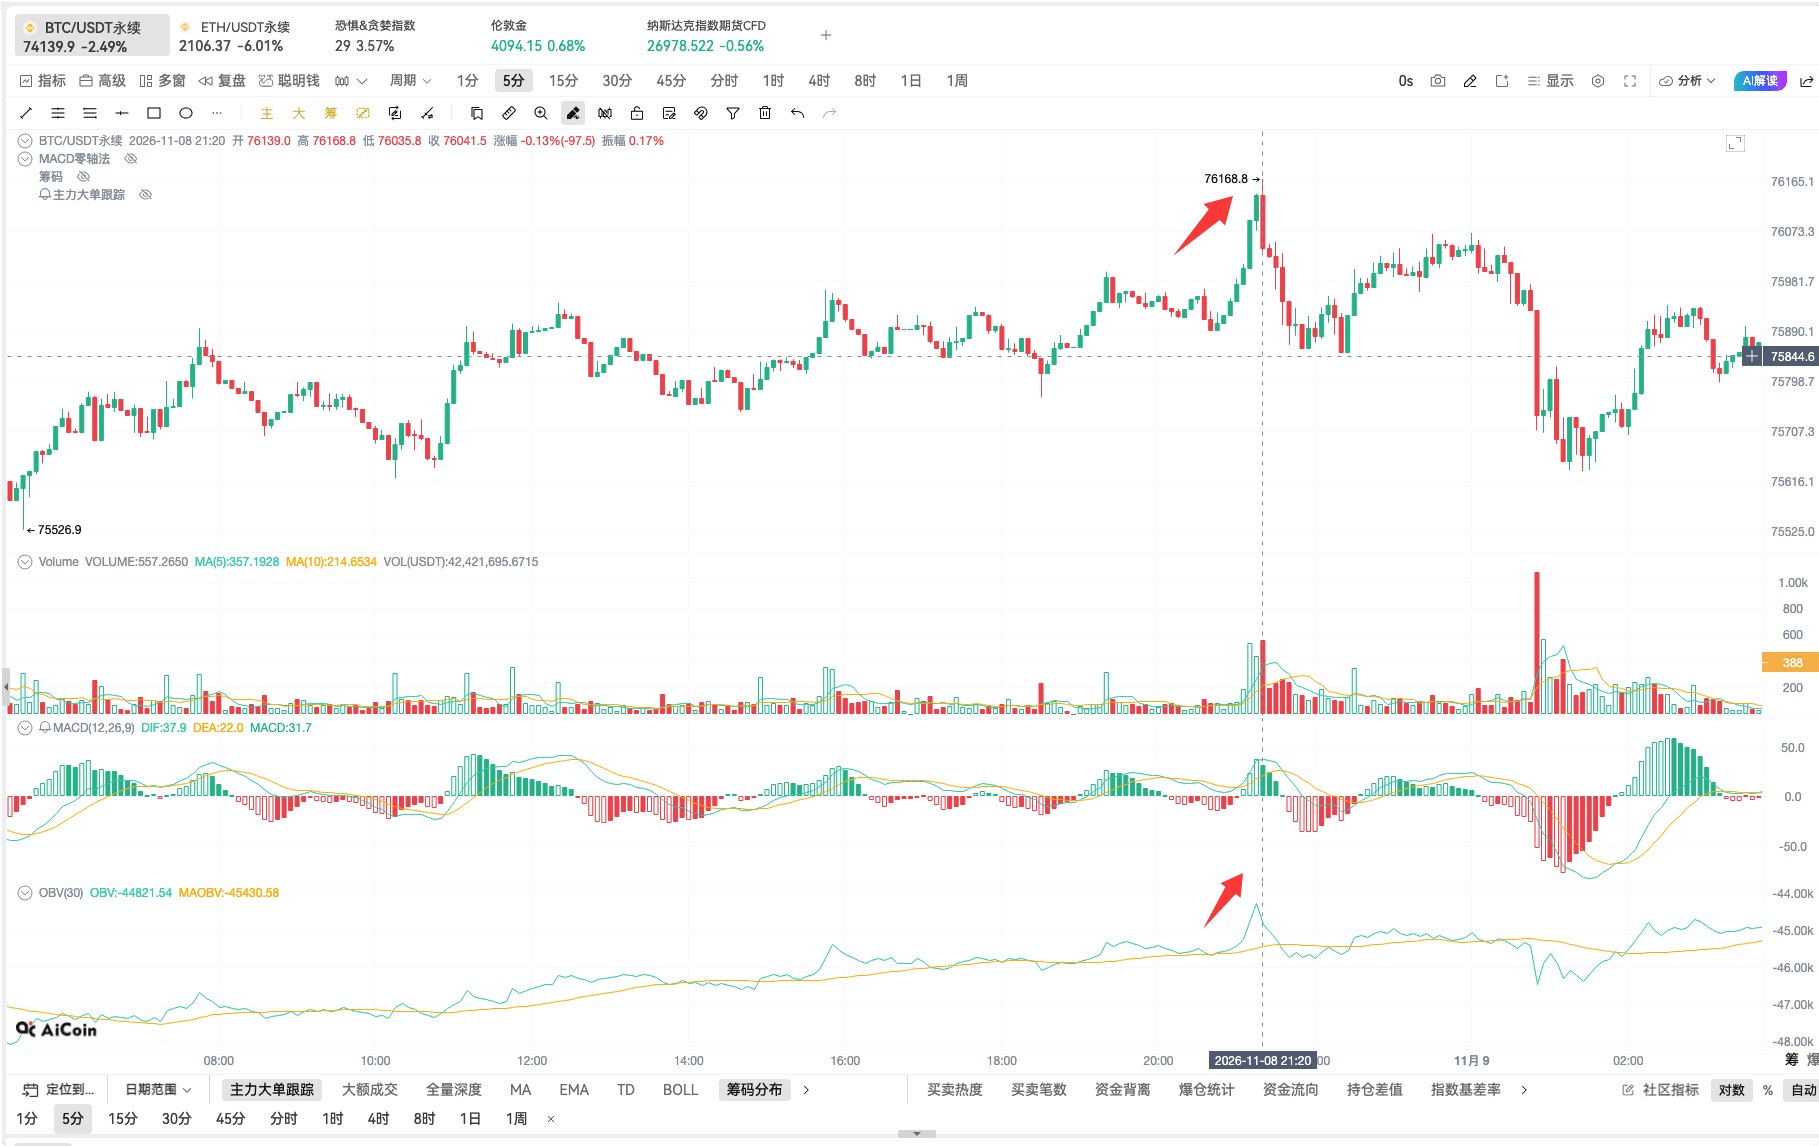
Looking at the price movement after the sharp rise, it did not hold steady, and then it retraced. This kind of movement can indicate risks of selling after a surge. Just looking at the slope of OBV does not reveal who is buying and who is selling.
How to identify a decent bottom divergence
During the live broadcast, the most recent segment saw both price and OBV still moving downward. The two lines were in the same direction, so I would continue waiting.
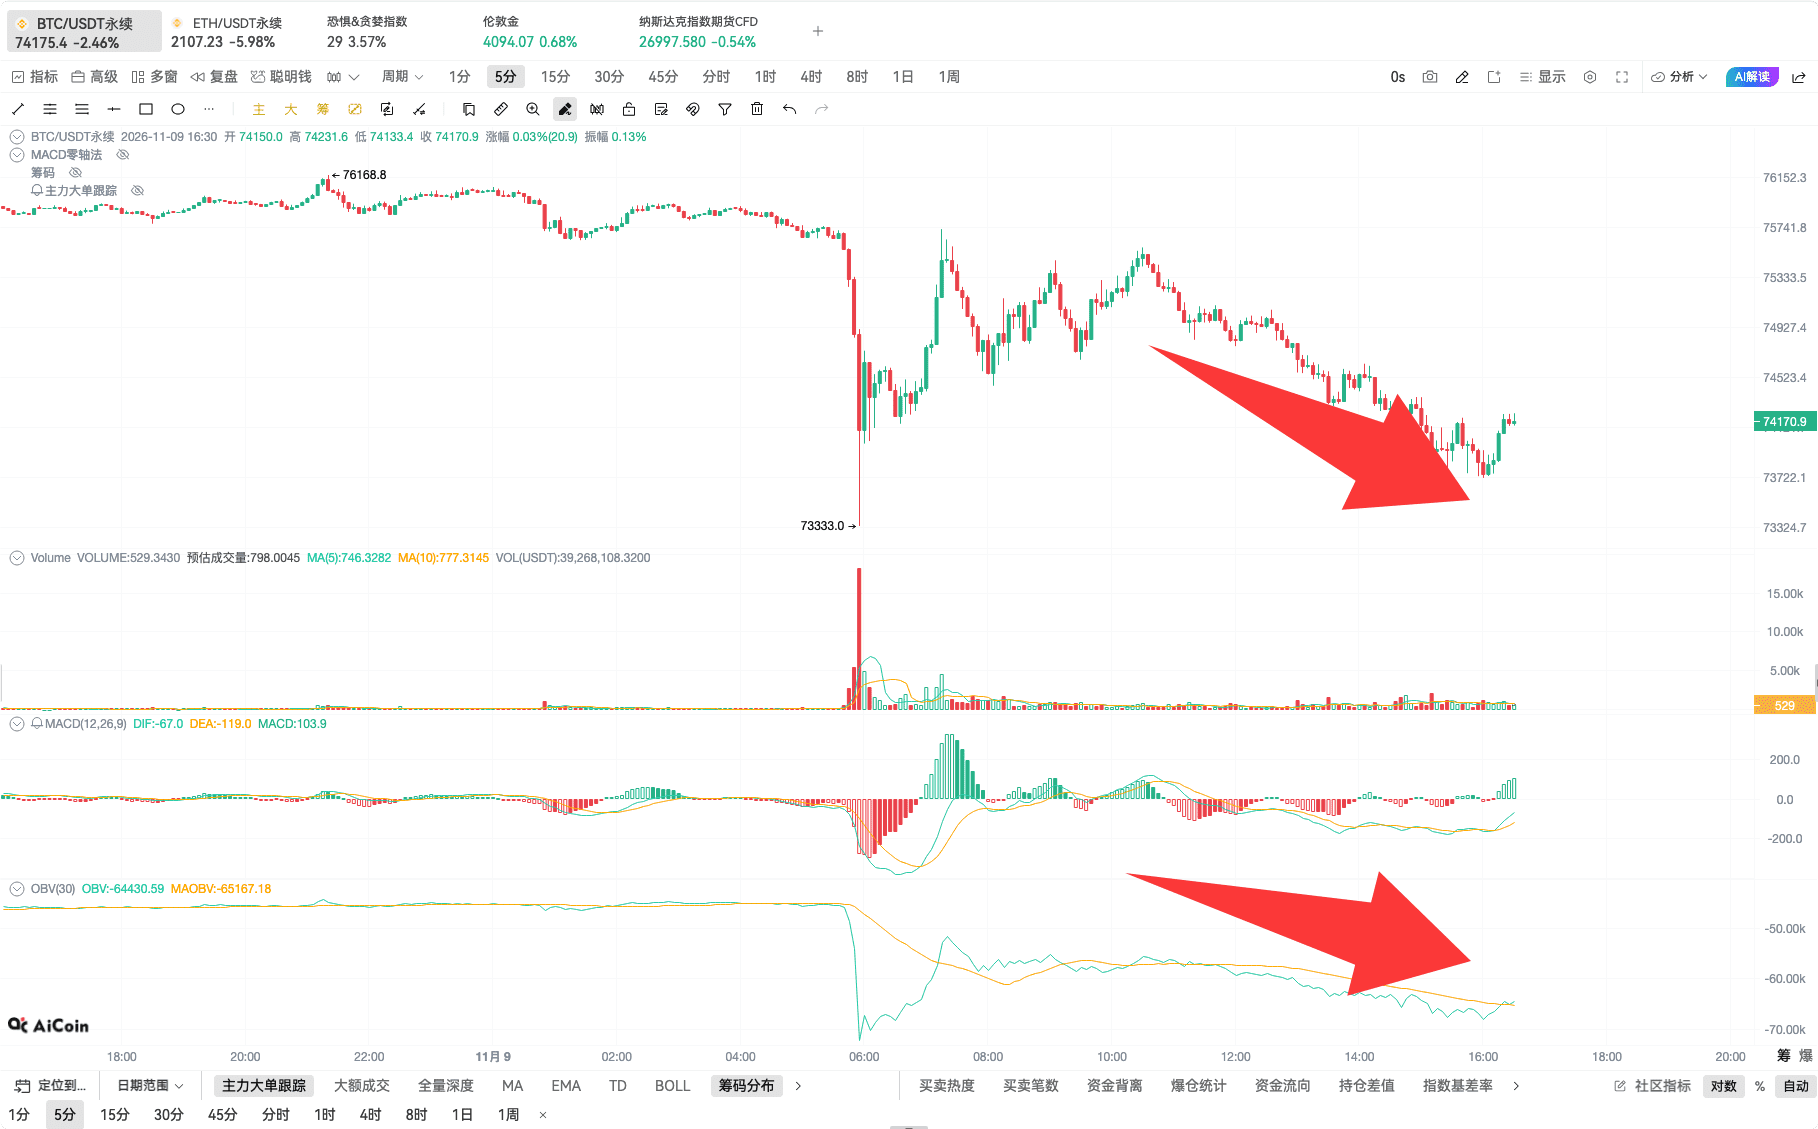
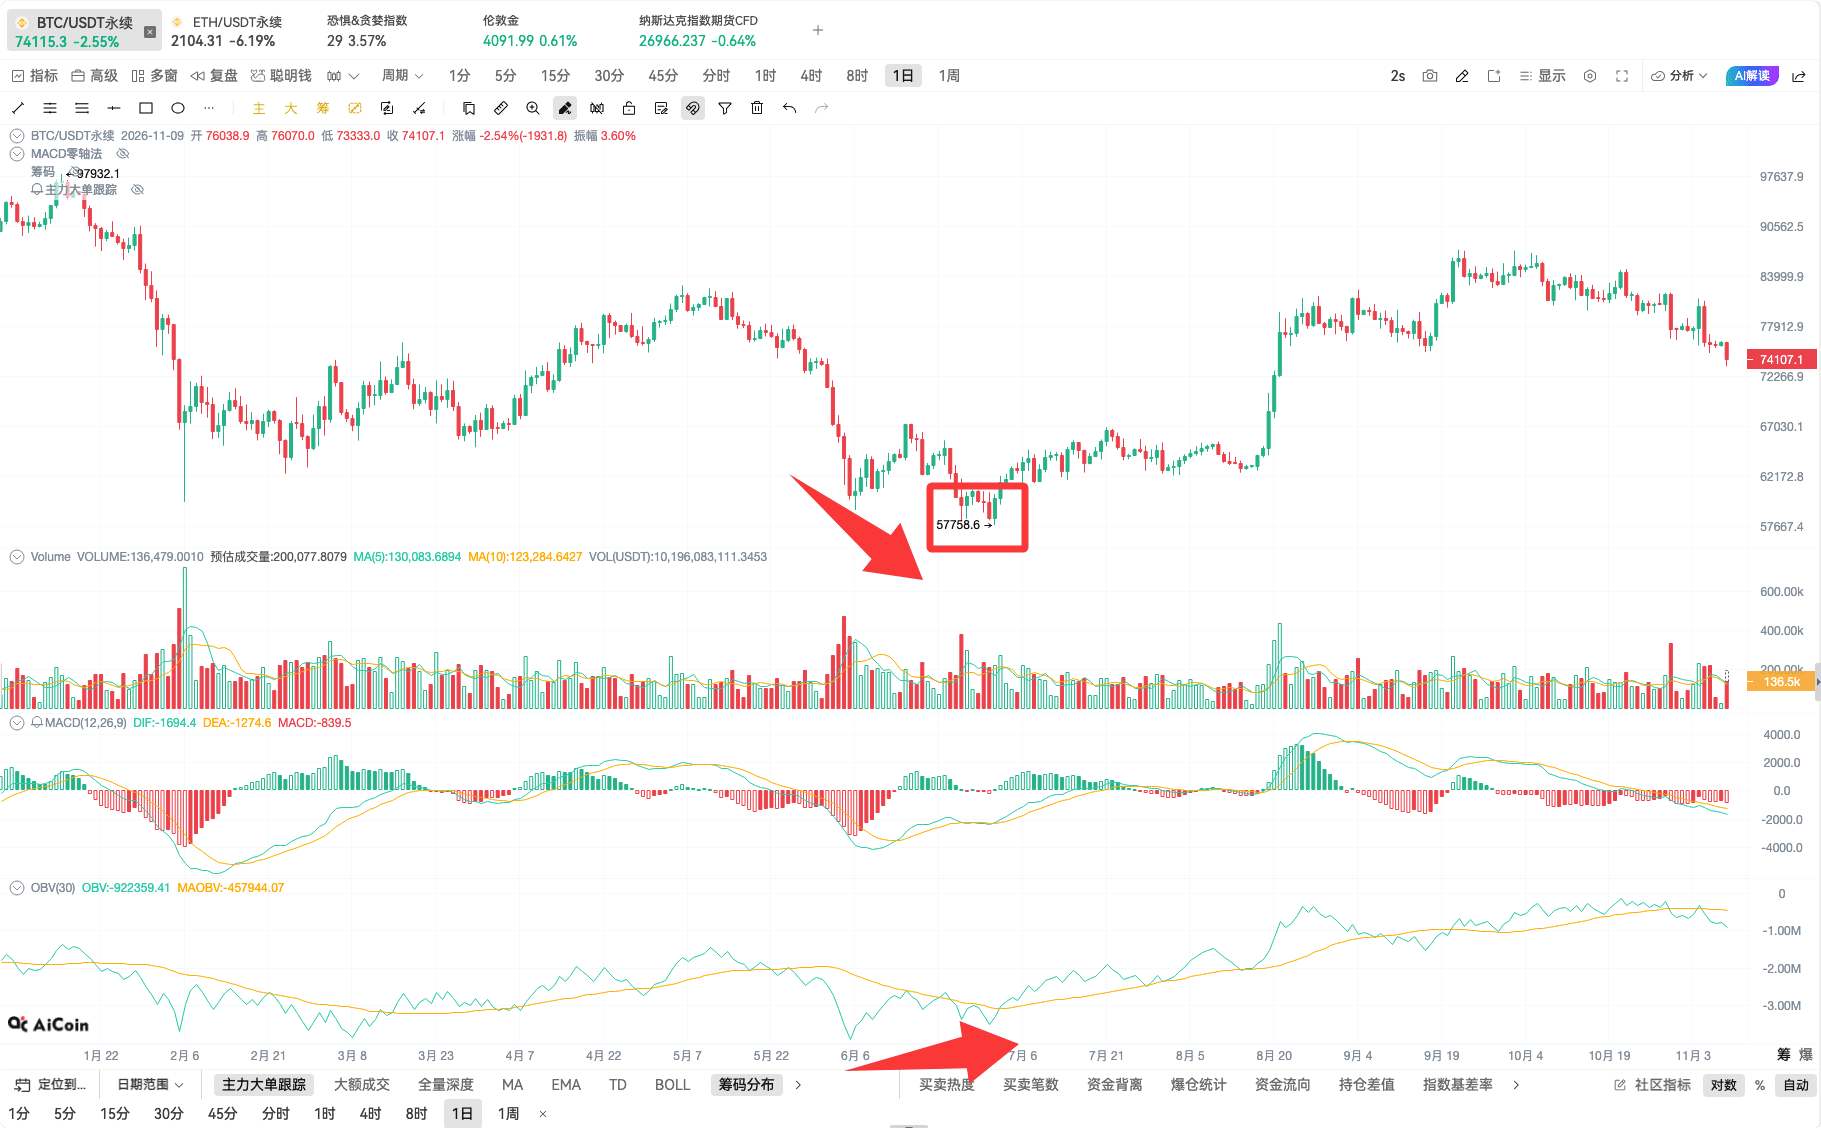
Looking back a bit further, the difference becomes very clear. As the price's low point moved downward, the OBV slowly rose, which is the bottom divergence I was looking for.
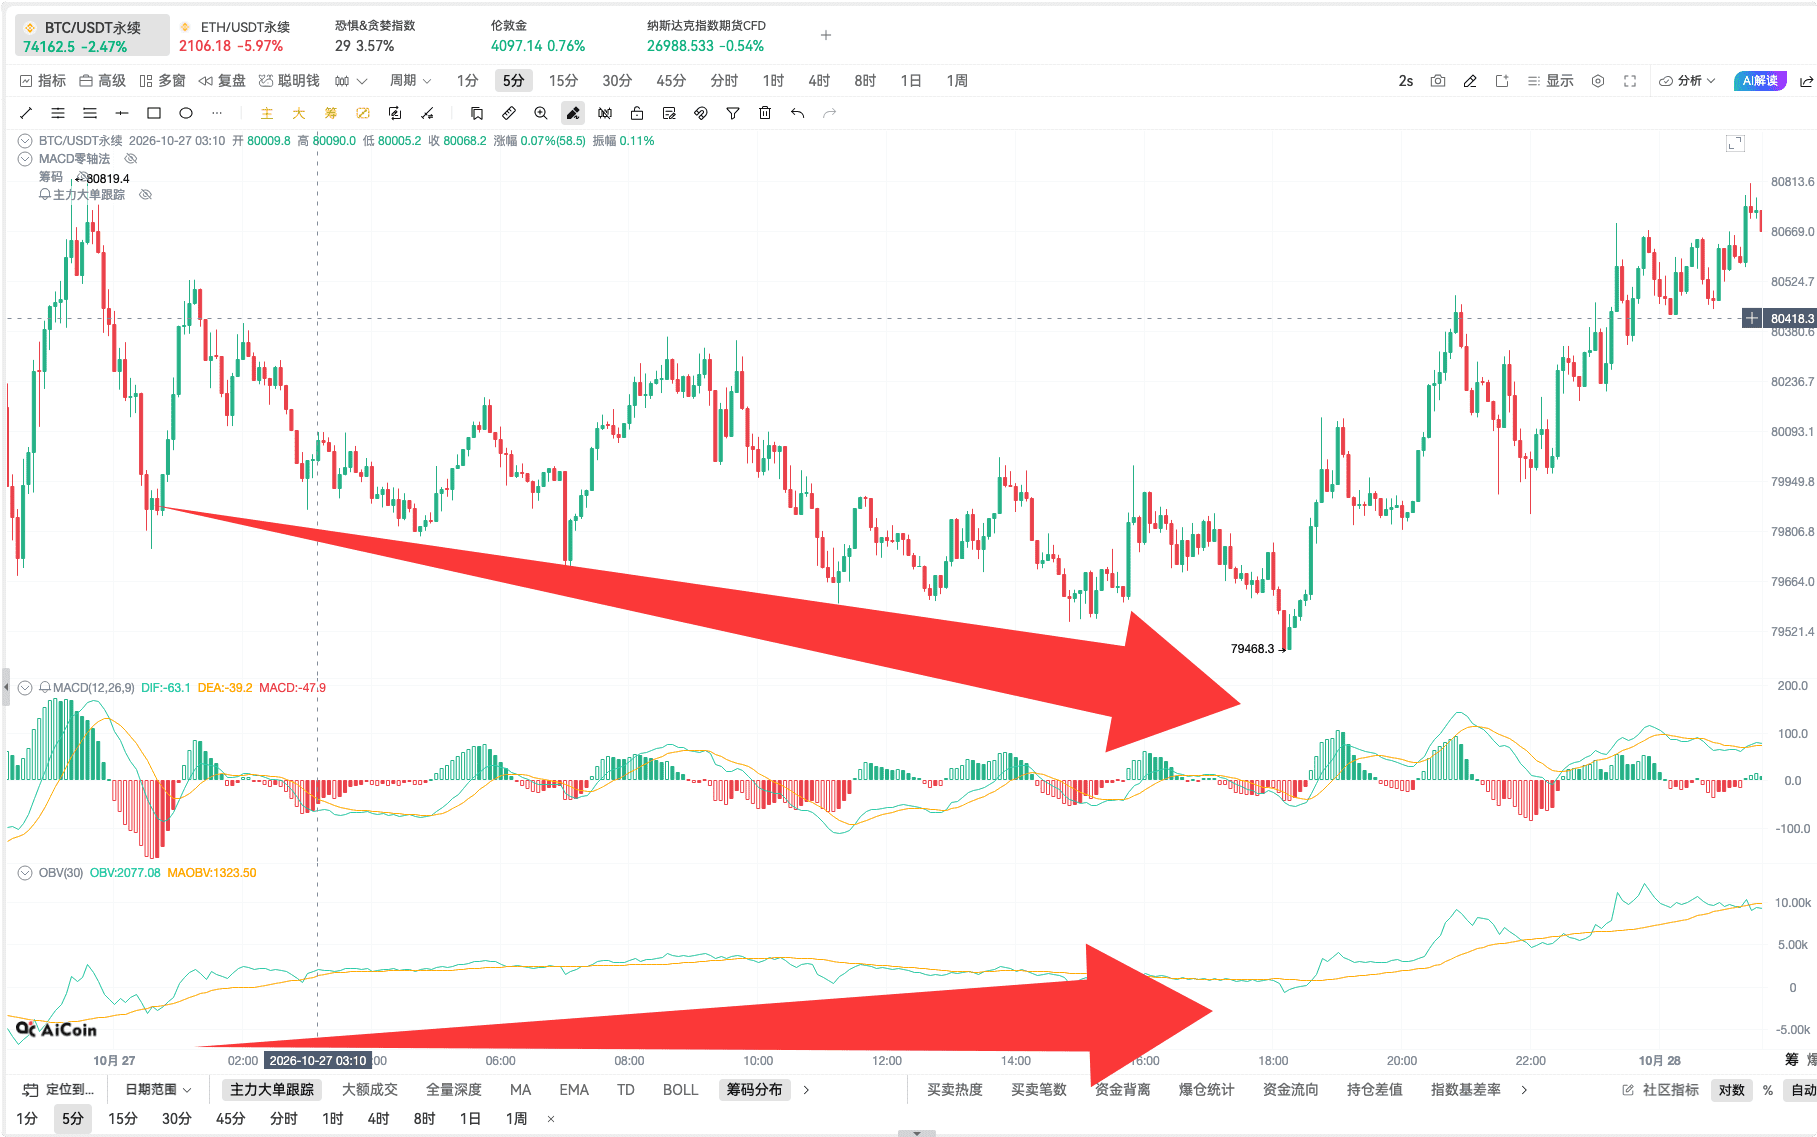
This historical sample later had about a 3% rebound, calculated over the segment shown in the chart. During my review, I will look in this order: whether the price continued to test the lows, whether OBV turned upward first, and whether the subsequent K-line could maintain the low point.
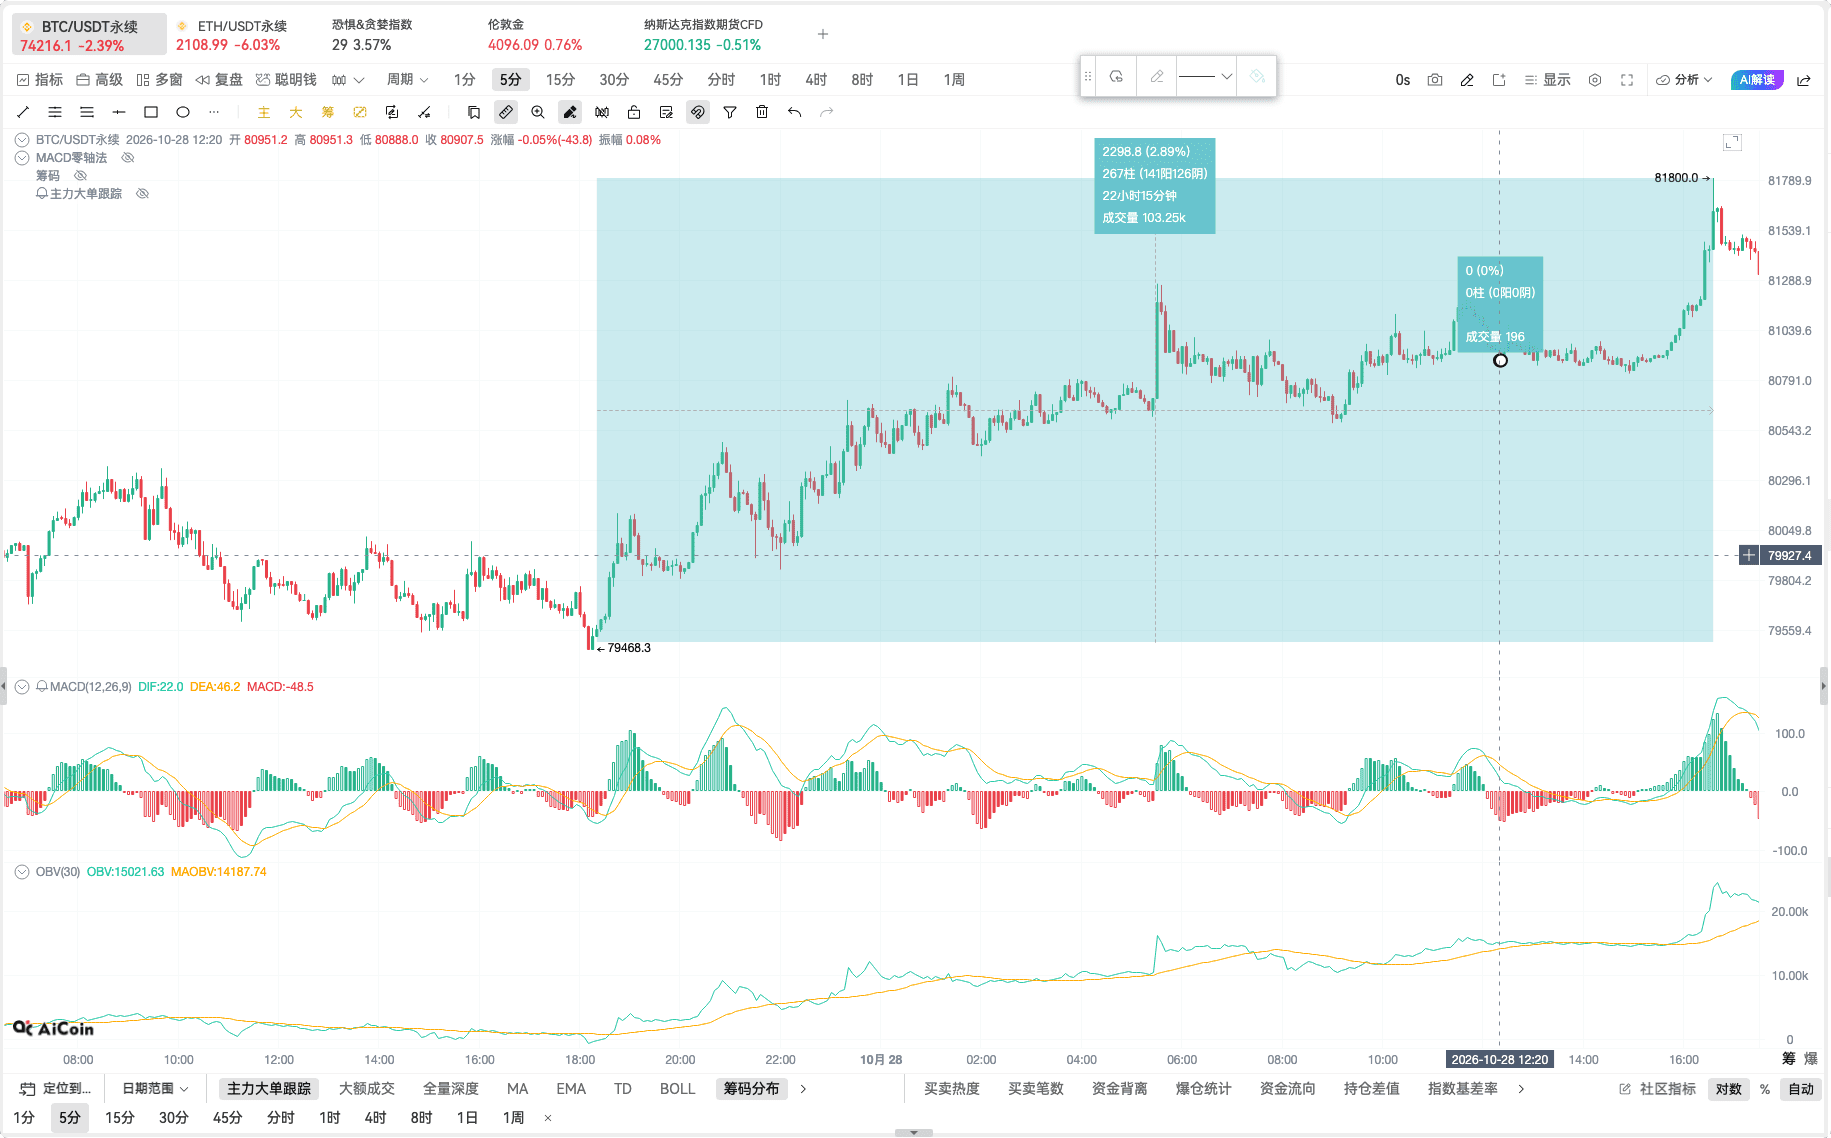
Use EMA52 to confirm which side the price is on
With the direction of OBV known, I will then check the position of the price relative to EMA52. If OBV moves upward and the price can sustain above EMA52, this movement is bullish. The arrows in the chart indicate the direction of both price and OBV.
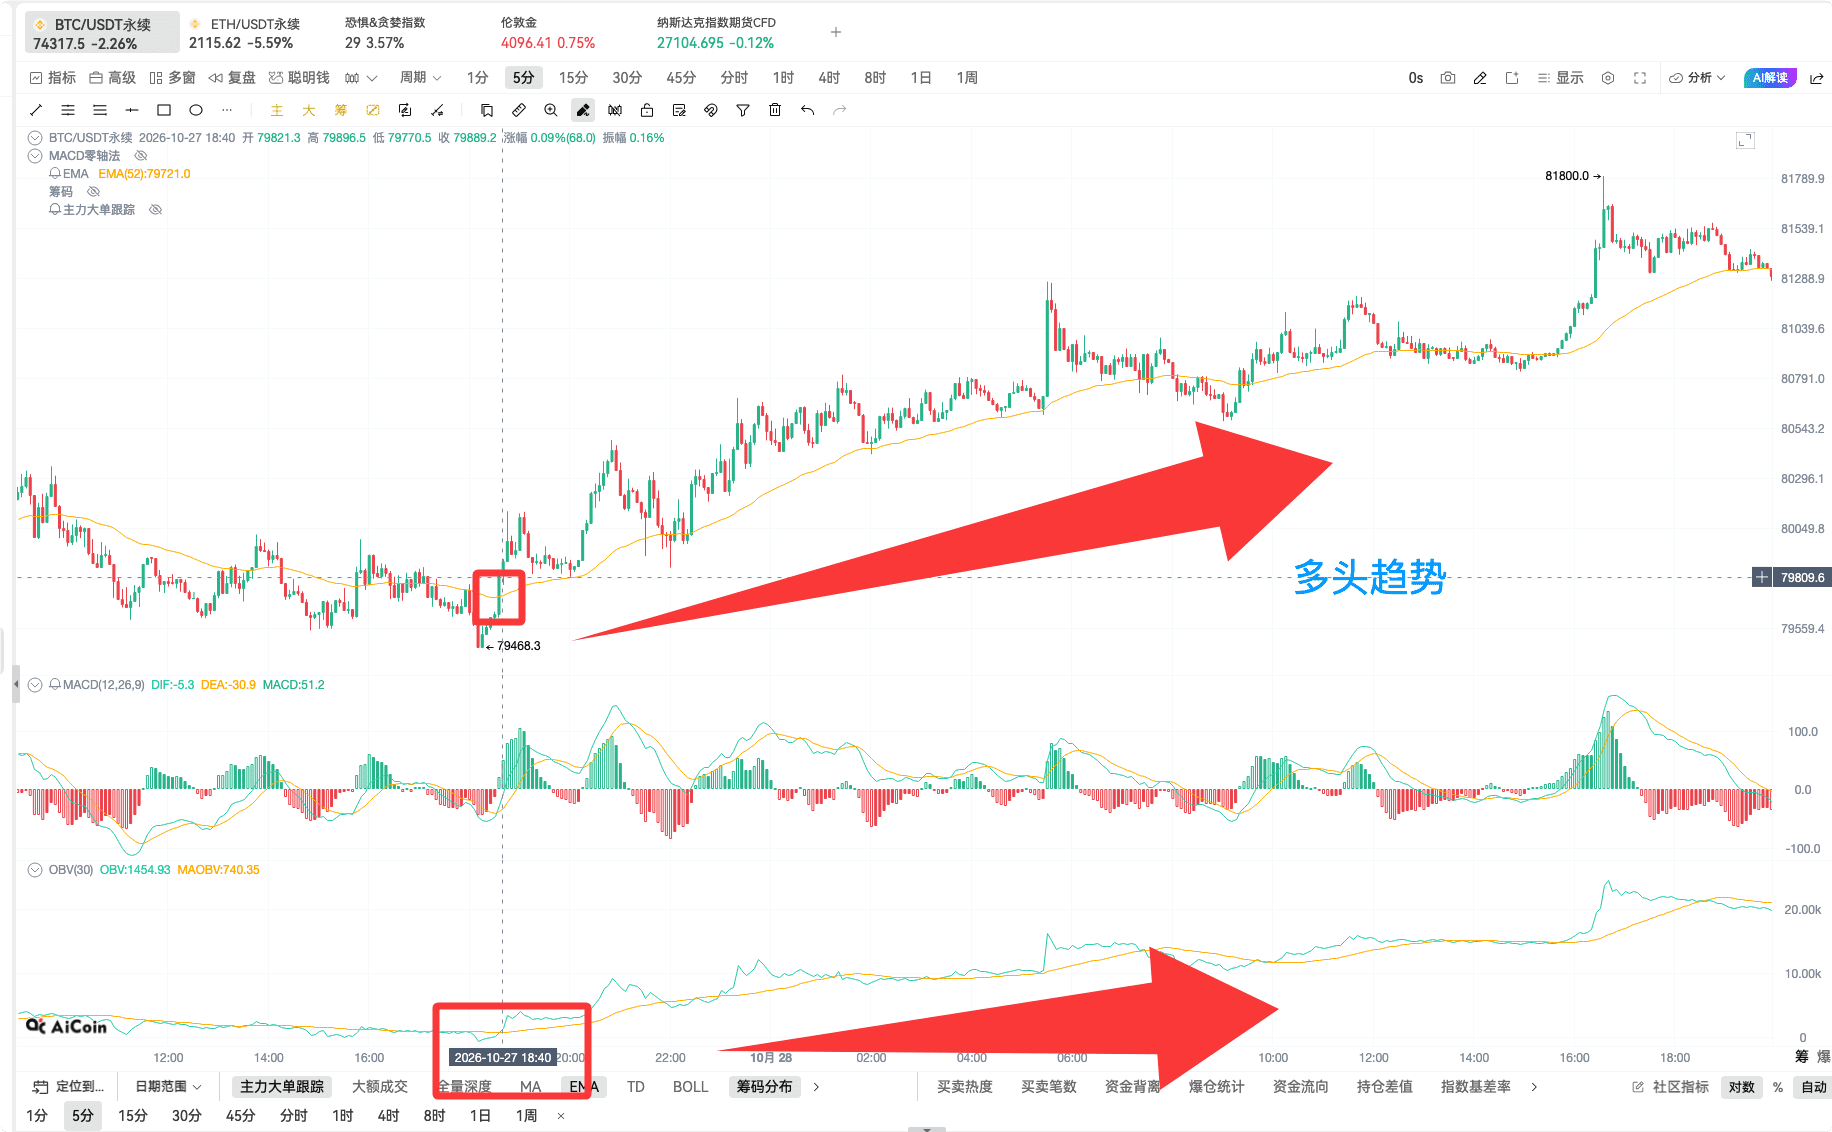
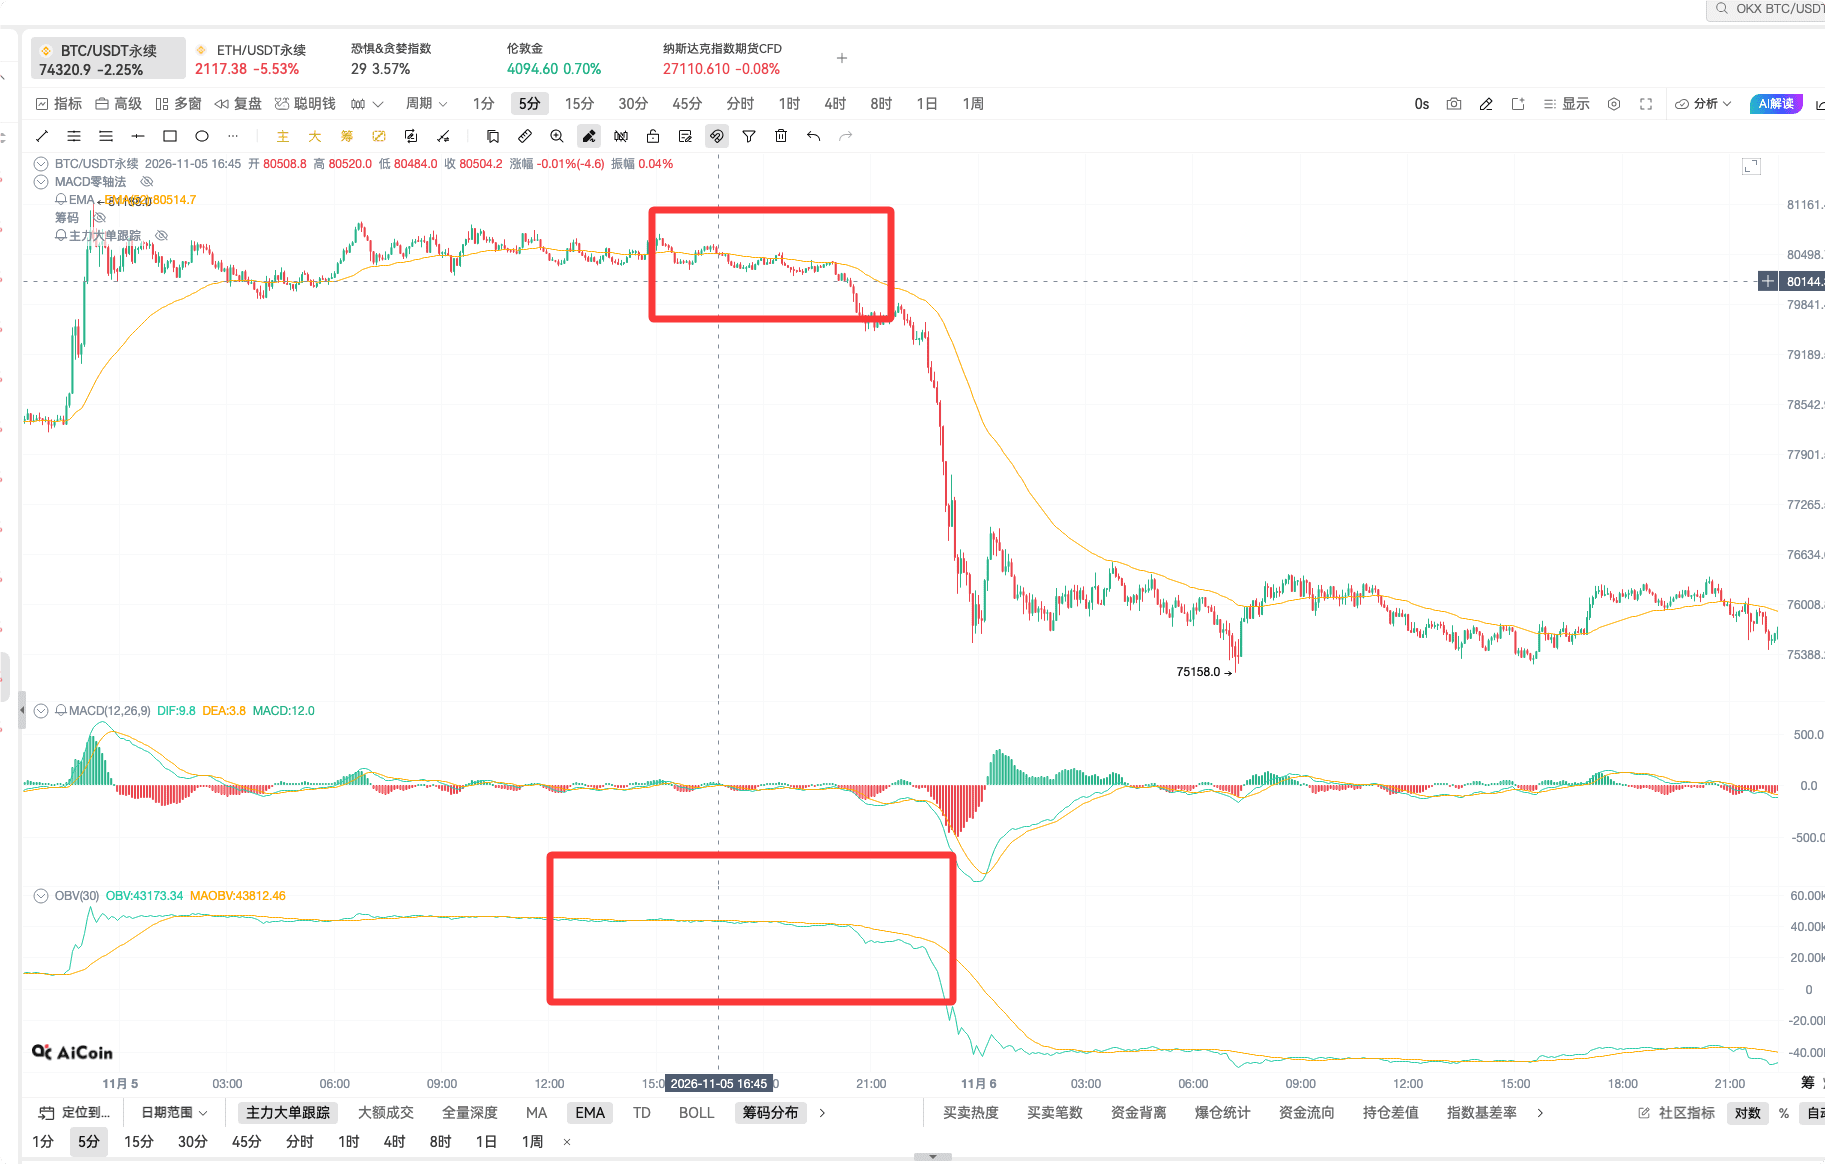
Conversely, if OBV falls from a high point, and the price breaks below EMA52, remaining below the moving average, I will view this as a bearish scenario.
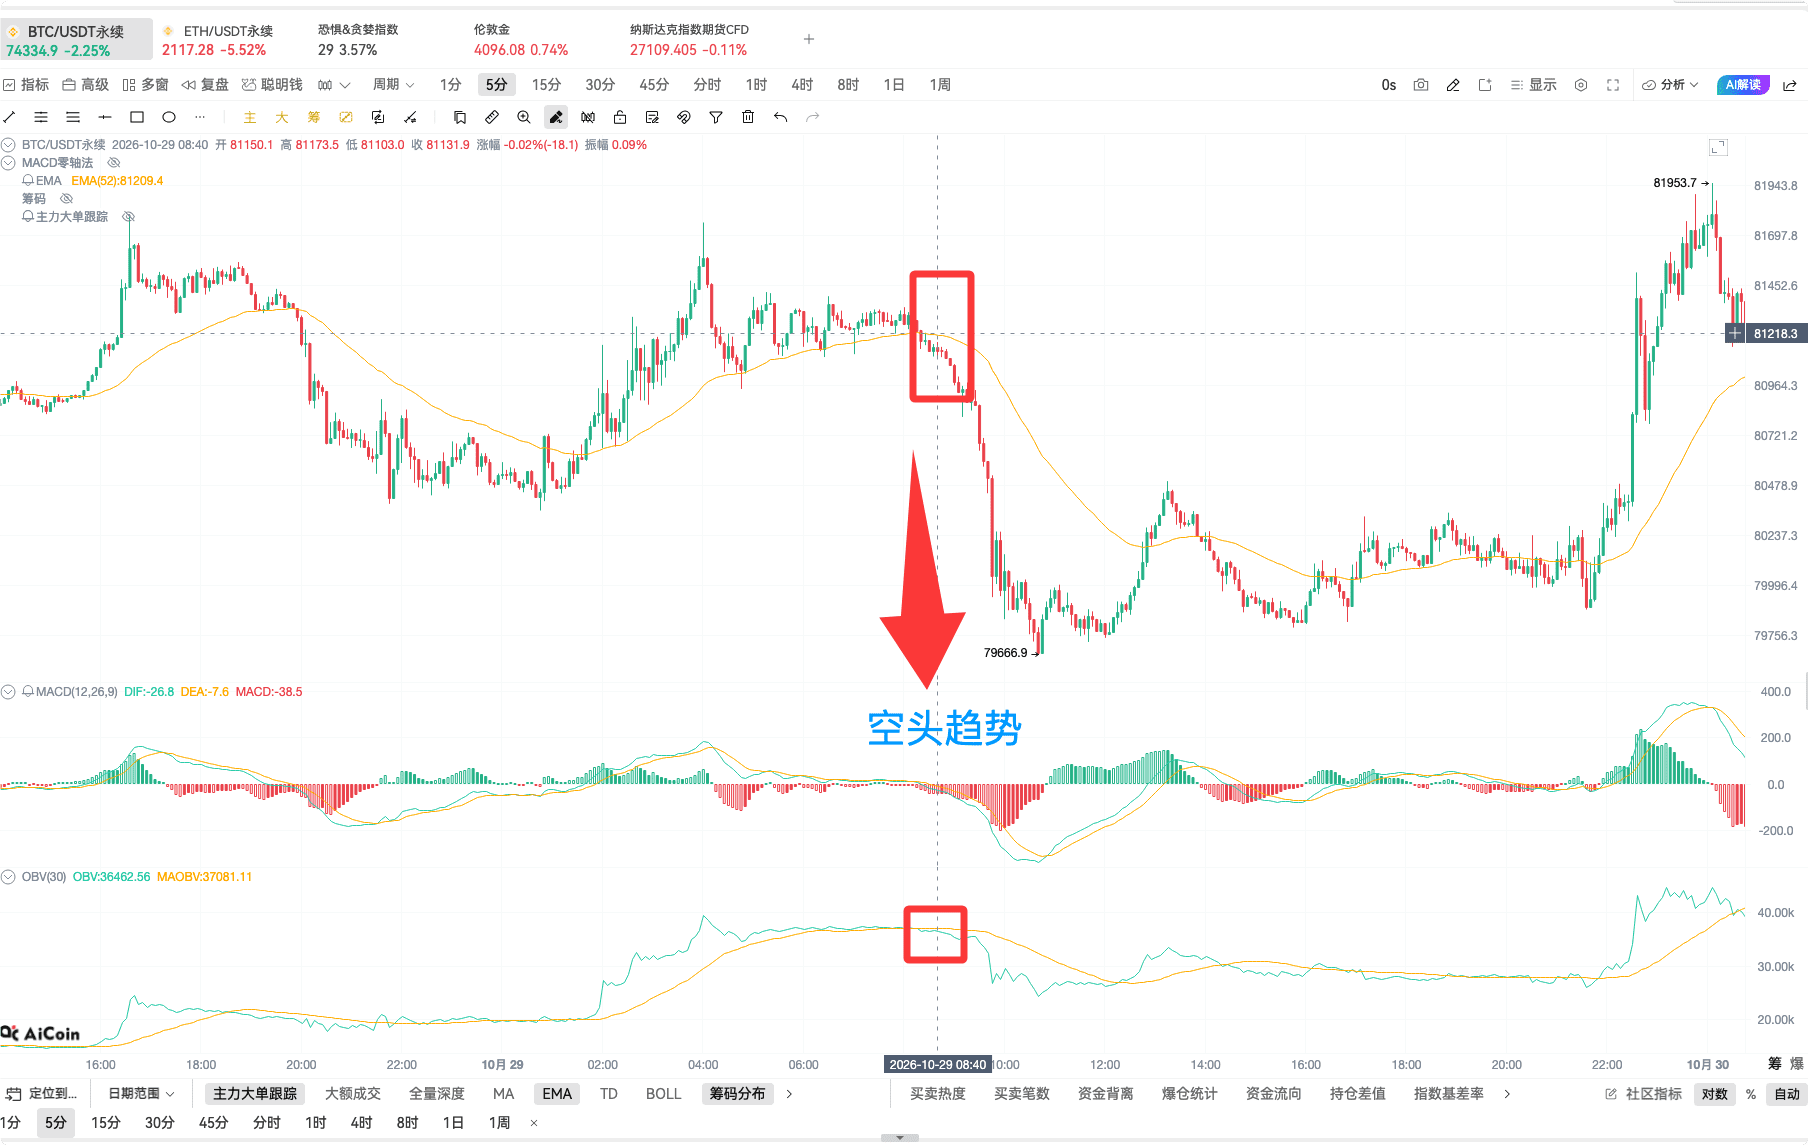
Returning to the most recent segment from the live broadcast, you can read along with the box in the chart. From the top, observe the price's position relative to EMA52, and from the bottom, see if OBV is also weakening.
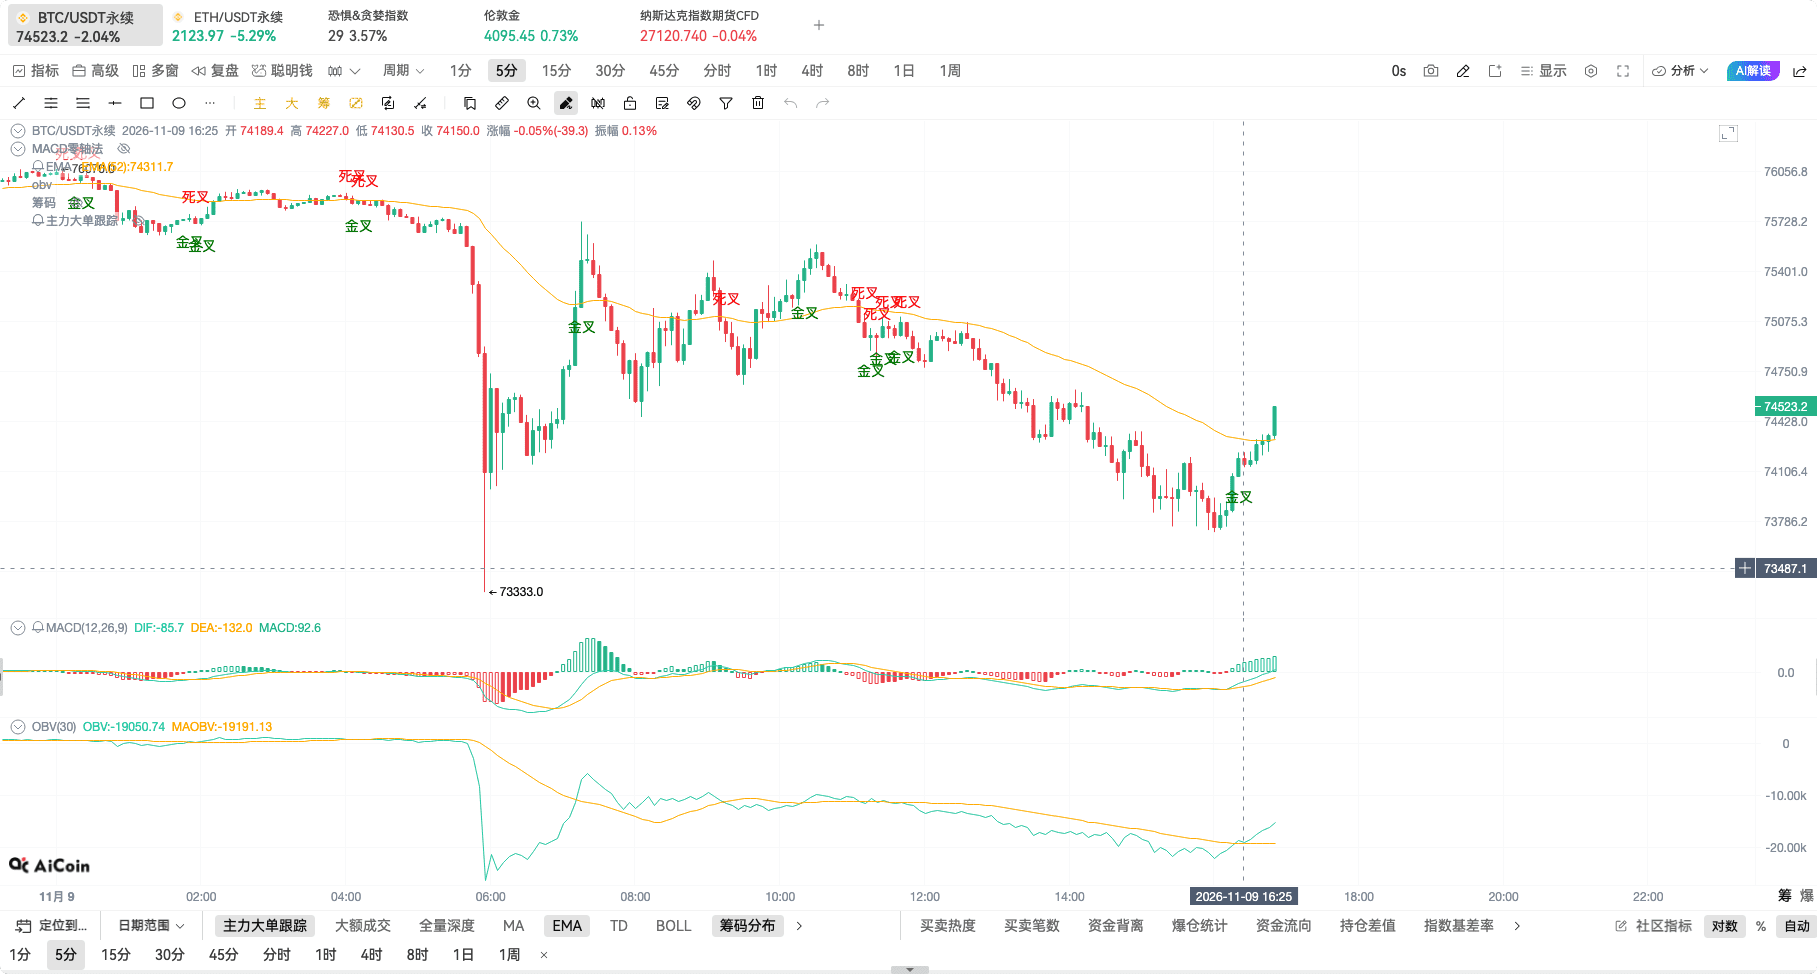
OBV Golden Cross and Death Cross Alert Scripts
I have also included the alert script mentioned during the live broadcast here. The beginning uses EMA52 to assess the price position, and this script compares OBV with its own 30-period moving average. The script marks the cross signals on the K-line in the chart.
// This indicator is created by AICOIN Research Institute. For any usage issues, join the indicators community for consultation.
// @version=2
change = close - close[1]
obv = cum((change > 0 ? 1 : change < 0 ? -1 : 0 ) * volume)
maobv = ma(obv, 30)// Define conditions
is_sell=crossup(obv, maobv)
is_buy=crossdown(obv, maobv)// Define alert conditions for use in the alert addition window
alertcondition(is_sell, title='OBV Golden Cross', direction="sell")
alertcondition(is_buy, title='OBV Death Cross', direction="buy")// Draw on the chart
// plot(obv, title='OBV')
// plot(maobv, title="MAOBV")
plotText(is_sell, title="Golden Cross", text='Golden Cross', color='green', refSeries=low, placement='bottom')
plotText(is_buy, title="Death Cross", text='Death Cross', color='red', refSeries=high, placement='top')// Buy
exitShort(is_buy, price='market', amount=1)
enterLong(is_buy, price='market', amount=1)// Sell
exitLong(is_sell, price='market', amount=1)
enterShort(is_sell, price='market', amount=1)
How to use this in the next market analysis
First, align the directions of price and OBV together. If both sides move in the same direction, follow the current trend. If they diverge, examine whether the price can stabilize. Additionally, add an EMA52 to check whether the price can hold steady on the corresponding side. Especially when looking for rebounds, seeing OBV rising warrants closer attention, waiting for the price to act, making the judgment more solid.
Currently, live broadcasts occur every day, and we welcome you to continue following AiCoin participants! Reserve your spot👇
https://www.aicoin.com/zh-Hans/live/list?tab=upcoming
Join our community to discuss and strengthen together!
Official Telegram community: https://t.me/aicoin_support
AiCoin Chinese Twitter: https://x.com/AiCoinzh
Hype rebate: https://app.hyperliquid.xyz/join/AICOIN88
Binance rebate: https://jump.do/zh-Hans/xlink-proxy?id=3 Invitation code: aicoin668
Coinbase rebate: https://jump.do/xlink?checkProxy=true&proxyId=25 Invitation code: Y8L23JL
免责声明:本文章仅代表作者个人观点,不代表本平台的立场和观点。本文章仅供信息分享,不构成对任何人的任何投资建议。用户与作者之间的任何争议,与本平台无关。如网页中刊载的文章或图片涉及侵权,请提供相关的权利证明和身份证明发送邮件到[email protected],本平台相关工作人员将会进行核查。