Original author: Dong Jing
Original source: Wall Street Journal
Last week, hedge funds finally "raised their hands and surrendered." Goldman Sachs' latest data shows that American fundamental long-short funds significantly reduced leverage in a single week, with the scale of deleveraging reaching the largest since the COVID-19 pandemic crash in March 2020, and the net leverage ratio dropping to the 0 percentile in five years. The positions of U.S. stock players have lightened to levels unseen in the past five years. At the same time, the scale of the sell-off in tech stocks has far exceeded the turbulence seen last summer, and CTA quantitative strategies continue to sell off, with nearly all market sentiment indicators signaling panic.
On Monday (November 9), Goldman Sachs' brokerage data showed that the total leverage ratio of American fundamental long-short funds fell by 8.7 percentage points in a single week, marking the largest weekly decline since the COVID-19 pandemic in March 2020, and the net leverage ratio decreased by 3.7 percentage points to 43.3%, placing it at the 0 percentile in a five-year retrospective. Goldman Sachs trader Pierre Saboureault summarized in Monday's report that the pace of deleveraging has accelerated to its highest rate since July, with the net leverage ratio of fundamental long-short funds hitting a low for one, three, and five years, with last Thursday showing typical characteristics of a "surrender-style" liquidation.
Tech stocks are hit hardest. Since early October, Goldman Sachs' U.S. trading desk clients have net sold over $30 billion in tech stocks (TMT and communication services), far exceeding the sell-off scale of about $21 to $23 billion during the momentum correction in July. Meanwhile, CTA quantitative strategies sold about $11.6 billion in S&P futures and $3 billion in Nasdaq futures over five days last week, and according to model predictions, they will continue to sell in various scenarios in the coming week.
Largest deleveraging since the pandemic: net leverage drops to five-year zero percentile
Goldman Sachs trader Nelson Armbrust detailed the scale of this deleveraging in the "Today's Highlights" report on November 9. The total leverage ratio of American fundamental long-short funds decreased by 8.7 percentage points to 207.5% (26th percentile over one year), while the net leverage ratio declined by 3.7 percentage points to 43.3% (0 percentile over five years). The overall leverage ratio adjusted for beta fell nearly 16 percentage points in a single week, decreasing by 11 percentage points year to date, with the net leverage ratio down 11.6 percentage points, erasing more than half of the total leverage ratio increase of 21.9 percentage points for the entire year of 2025. The long-short ratio of 1.527 is at the 1 percentile for both three and five-year terms.
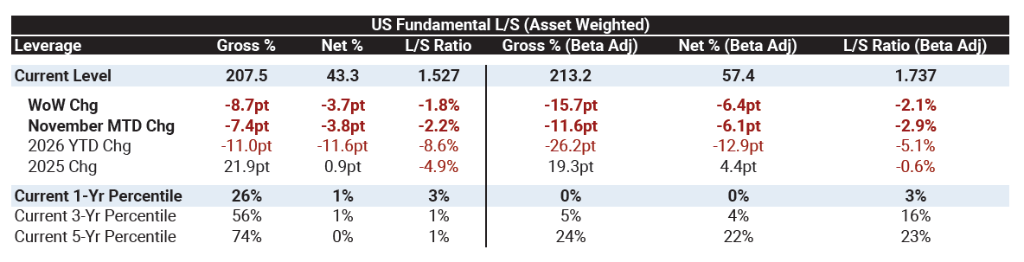
Armbrust stated, "This is a strong signal that positions are being cleaned up."
It is worth noting that if macro accounts and systematic accounts are included in the global brokerage books, the overall total leverage ratio actually slightly increased by 0.1 percentage points to 314.2% (85th percentile over the past year), while the net leverage ratio slid to the 4 percentile, and the long-short ratio fell to the 3 percentile. In other words, there are still a lot of exposures in the market, but almost no confidence.
From a global perspective, Saboureault's data shows that global stocks faced net selling (one-year -1.0 standard deviation), and the pace of deleveraging accelerated (one-year -0.8 standard deviation, marking the largest dollar deleveraging since July), with the scale of long-position selling being five times that of short covering. Individual stocks have seen net selling for eight consecutive weeks, while macro products have experienced net buying for three consecutive weeks. The global fundamental long-short net leverage ratio of 45.3% is the lowest in the past 12 months, at the 0 percentile for both one-year and three-year terms, with the long-short ratio being the lowest for Goldman Sachs' books in the past five years.
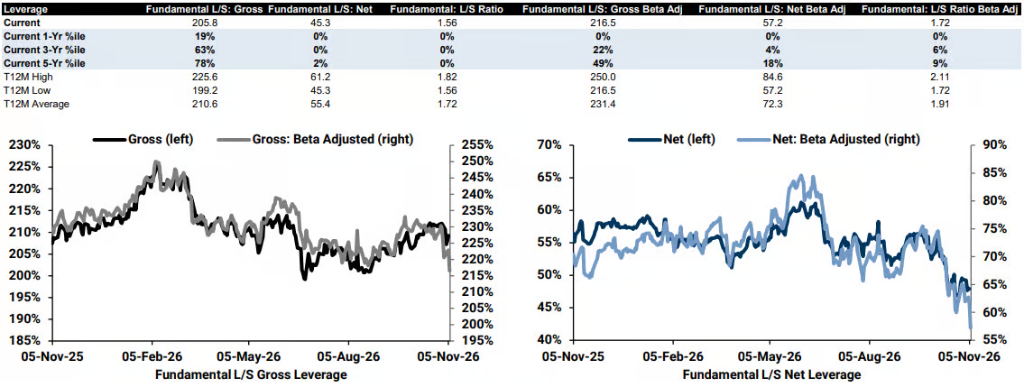
Previously, Morgan Stanley pointed out that the ongoing de-risking this summer and in October was the longest ongoing de-risking stage for L/S funds in 15 years — and that was before last week's "bloodbath." After last week, the net leverage ratio in the U.S. dropped further from 51%, as recorded by Morgan Stanley, to 43%, according to Goldman Sachs' data.
Tech stocks face historic sell-off, industrial stocks reach five-year largest net selling
The tech sector is the hardest-hit area in this round of selling. The information technology sector is the largest in terms of net selling globally and in the U.S., with this week’s net selling ratio of global information technology stocks being on par with the largest net selling week since Goldman Sachs began recording in 2016, and there have been four instances in the past five months that have made it into the top five historic net selling weeks.
Goldman Sachs broker Robbie Stankard pointed out that in percentage terms, the global tech stock selling scale this week is comparable to that of mid-October and September 2024, both being the largest net selling weeks recorded by Goldman Sachs since 2016.
Goldman Sachs trader John Flood wrote in his report titled "The End of Last Week": Since early October, Goldman Sachs' U.S. trading desk clients have net sold about $30 billion in tech stocks (TMT and communication services), contributing about $6 billion last week alone. In contrast, the net selling scale during the July momentum correction was about $21 to $23 billion, and the current round of selling has exceeded that by 30% to 40%. The only positive signal is that on November 6 (Friday), there was a net buying of tech stocks for the first time in seven trading days, amounting to about $1 billion.
The industrial sector has also been affected. Industrial stocks are the second largest net selling sector globally, having recorded the largest percentage net selling in five years, and have faced net selling for four consecutive weeks. At the sub-sector level, electrical equipment, building products, aerospace and defense, trading companies, and distributors led the decline, while passenger airlines and machinery saw net buying. Stankard noted that the decline in electrical equipment and building products is not coincidental — this is related to data center power trades.
In terms of accumulated performance year to date, net selling in the TMT sector has fallen back to near the July low, while the industrial sector's selling scale last week exceeded 3 standard deviations, the highest among U.S. sectors.
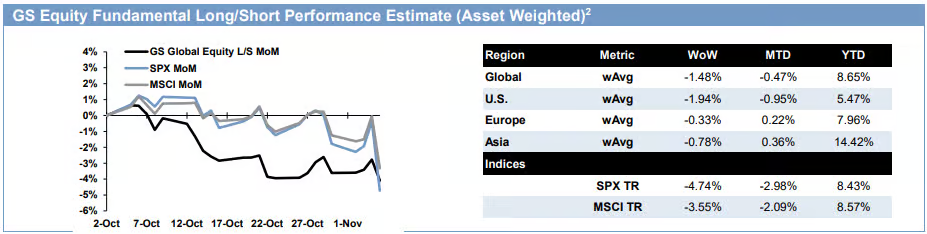
In terms of performance, Goldman Sachs' brokerage estimates show that American fundamental long-short funds lost 1.94% last week, while global similar funds lost 1.48%, and the S&P 500 total return index fell 4.74% during the same period. The return rate of U.S. stock players year to date is only 5.47%, lagging behind the S&P 500’s 8.43%. Tech-themed funds are in an even worse situation, having erased their gains for the year by Thursday.
Position structure: Mag 7 remains near historical highs, residential and power shift to net short
Despite experiencing the largest deleveraging since the pandemic, there are still several noteworthy position structures in Goldman Sachs' books. Flood listed five prominent sectors currently in the brokerage books:
Mag 7 and large-scale cloud computing (net allocation remains close to historical highs)
Residential/home builders (net short in the books, long-short ratio at a five-year low)
Restaurants (long-short ratio at a five-year low)
Power/U.S. electrical equipment (net short in the books, long-short ratio at a five-year low)
Small and mid-cap biotech (still net long, long-short ratio above 3, but at about a three-year low)
The most striking fact is that after experiencing the largest deleveraging since the pandemic, the net allocation to Mag 7 and large-scale cloud computing remains close to historical highs, while the books have turned net short on residential and power/electrical equipment. In other words, while funds are broadly selling tech stocks, they still cling to long positions in "the payers" (i.e. large-scale cloud computing giants). If the market worsens further, this last crowded trade could become the next target for selling.
CTA quantitative strategies: sellers in all scenarios, potentially selling another $45 billion
Last week, CTA quantitative strategies acted as a downward accelerator. It is estimated that CTA sold about $11.6 billion in S&P futures and $3 billion in Nasdaq futures over five days last week.
Even more concerning is the subsequent pressure. Saboureault's summary of systematic strategies shows that systematic/CTA signals are currently negative in 50% to 60% of the global stock market, covering the S&P 500 and most major markets.
Stankard's scenario analysis shows that in the coming week, regardless of market trends, CTAs will be sellers:
- Flat scenario: selling approximately $23.3 billion (with the S&P about $31.1 billion)
- Up scenario: selling approximately $3.9 billion (with the S&P about $23.1 billion)
- Down scenario: selling approximately $48.7 billion (with the S&P about $31.5 billion)
In the coming month, only under a strong upward scenario will CTAs turn buyers (buying about $74 billion, with the S&P about $14.4 billion); under down scenarios, global stock selling could reach about $149.5 billion.
Key technical levels for the S&P 500: short-term approximately 7675 points, mid-term approximately 7549 points, long-term approximately 7084 points. Currently, the index closing price is still above these levels, which is why quantitative strategies continue to sell.
Panic signals are flashing everywhere, the only exception is Goldman Sachs' own sentiment composite indicator
Multiple market sentiment indicators have emitted strong panic signals.
Goldman Sachs' "Panic Index": Armbrust noted that a reading above 9 is historically a good buying opportunity, reaching 9.57 last Thursday and closing at 9.2 over the weekend.
"Surprise Ratio": This metric created by Goldman derivatives experts and strategist Brian Garrett measures the daily price movements of assets relative to the implied volatility of options from the previous day. The S&P 500's this week reached the highest value in 19 years, with the Nasdaq second, and the Russell 2000 within the top five — the degree to which the options market underestimated this volatility is the most significant in over twenty years.
The microstructure of the market is also under pressure: the depth of the S&P futures order book has fallen to $4.15 million, far below the average of $11.4 million; the one-month implied correlation has jumped from below 10% in the summer to about 26%; the spread between implied volatility of the Nasdaq and S&P has widened to nearly 9 percentage points, approaching the 12.6 point record set during the summer momentum collapse; put option skew remains high at 1.20 while call option skew has dropped to 0.76.
Goldman Sachs Risk Appetite Index (GSRAII) has fallen to -0.65 but has yet to reach the -1 strong buy signal level that Armbrust mentioned. At the bottom of the COVID-19 pandemic in March 2020, this index was -2.03.
Retail investors are also starting to waver. Saboureault's comment on retail investors is "they blinked." Last week saw the two most negative daily buy-sell skew readings since early June, with S&P 500 retail net buying falling below zero twice. The AAII survey showed that for the week ending November 4, the bearish sentiment jumped 7 percentage points to 48.4%, 17 percentage points higher than the historical average; the CNN Fear and Greed Index edged up from 19 to 24 but remains in the "extreme fear" range.
The only exception is Goldman Sachs' own U.S. stock sentiment indicator (Sentiment Indicator). This composite indicator covers nine position indicators from institutions, retail, and overseas investors and has actually risen from +0.2 to +0.6. The threshold for light positions signals is below -1.0, which is currently far from reached. The reason is that continuously buying mutual funds and overseas investors have kept this composite indicator in positive territory, making the reverse bullish signal of "everyone is out" still incomplete.
Who is picking up the pieces? Mutual funds and corporate buybacks are counter-trend buyers
The mass liquidation by hedge funds has a counterpoint in the "slow money" buying.
In terms of mutual funds, according to EPFR data, for the week ending November 4, global stock funds had a net inflow of about $89 billion (up from $56 billion the previous week), with about $37 billion flowing into the U.S.; the cumulative net inflow over the past four weeks is about $265 billion, with about $111 billion flowing into the U.S. Tech funds recorded the largest net inflow again, despite AI-related stocks experiencing significant volatility. The scale of cross-border capital inflows into U.S. funds has continued to rise, approaching nearly $1 trillion since 2022.
In terms of corporate buybacks, about 90% of S&P 500 constituents have exited their buyback quiet period, expected to rise to about 93% by the end of this weekend. Goldman Sachs' buyback trading desk report shows that activity accelerated significantly last week, driven by post-election momentum and an active earnings season, with discretionary open market orders rising from 22% the previous week to 33%, and execution volume about 1.6 times last year’s daily average. The buyback authorizations so far in 2026 have reached $1.5 trillion, surpassing the record of $1.37 trillion for the entire year of 2025.
However, supply pressure cannot be ignored — last week saw North American IPOs and follow-ons totaling $16.3 billion, with a cumulative total of $536 billion year to date, and corporate buybacks still need to continue to absorb this supply pressure.
Long-short game: After reshuffling positions, the market bottom may still have to wait for CTA to sell out
Flood, despite going through a tough week, still listed four reasons to maintain a constructive view: S&P 500 Q3 EPS growth rate tracked to 35% year on year; market breadth has improved significantly; S&P 500 P/E ratio is approximately 18 times, at the 31 percentile over the past decade, with the communication services sector at its 4 percentile in its own ten-year history; corporations are actively buying the dips.
According to Goldman Sachs semiconductor analysts cited by Armbrust, relevant stocks have clearly entered oversold territory, presenting an attractive risk-reward ratio for some individual stocks, naming Nvidia, Broadcom, Applied Materials, and Lam Research as favorable.
However, multiple pressures remain unresolved. Saboureault summarized: "Falling oil prices, declining yields, and volatility need to stabilize for funds to re-enter the market." Before volatility stabilizes and the CPI data on Tuesday and Nvidia's earnings report on November 17 materialize, last week may have been a "surrender moment" for hedge funds, but the true market bottom may still require waiting for CTA to complete the remaining selling procedures.
免责声明:本文章仅代表作者个人观点,不代表本平台的立场和观点。本文章仅供信息分享,不构成对任何人的任何投资建议。用户与作者之间的任何争议,与本平台无关。如网页中刊载的文章或图片涉及侵权,请提供相关的权利证明和身份证明发送邮件到[email protected],本平台相关工作人员将会进行核查。


