Last week's cryptocurrency market was driven by news.
On November 4, the midterm election news ignited market sentiment, causing Bitcoin to surge 3.92% in a single day, briefly surpassing $80,000. However, just one day later, a sharp decline in U.S. stocks triggered a collective pullback of risk assets, with the cryptocurrency price falling 5.48% in one day, hitting a low of approximately $75,222, a new low since the adjustment on September 21, and the fear index approached 25 at one point. The transition from exuberance to panic took just one trading day.
HYPE was also not spared. Affected by the systemic decline in U.S. stocks, HYPE's weekly candle closed with a large bearish line, down 15.19%, completely giving back the previous week's gains, with the price dropping back to around $75.
After the drastic fluctuations, the most pressing questions for the market are: Did this "one-day rally" change the existing technical structure? How much longer will Bitcoin's adjustment last? Can HYPE's bullish pattern hold?
In this week's review, we will continue to employ the "52-week moving average confirmation method," wave theory, moving average system, Fibonacci retracement, and "momentum ribbon" quantitative model to analyze and disassemble the trend nature, movement structure, and operational strategies for both Bitcoin and HYPE.
This week's core trading viewpoint summary:
• Current market trend assessment of Bitcoin (see detailed explanation in the first part)
• Daily chart structure analysis of Bitcoin (see detailed explanation in the second part)
• Bitcoin's market forecast and medium- and short-term operational strategies for this week (see detailed explanation in the third part)
• Daily chart structure analysis of HYPE (see detailed explanation in the fourth part)
• HYPE's market forecast and short-term operational strategies for this week (see detailed explanation in the fifth part)
1. Current market trend assessment of Bitcoin
In the two weekly reviews published on August 31 and October 12, we made judgments about the market trend at that time based on our "52-week moving average confirmation method" and its three quantitative principles. As of now, the market has been operating for nearly four weeks; what changes have taken place during these four weeks? This article will use the same quantitative rules to reassess the current trend.
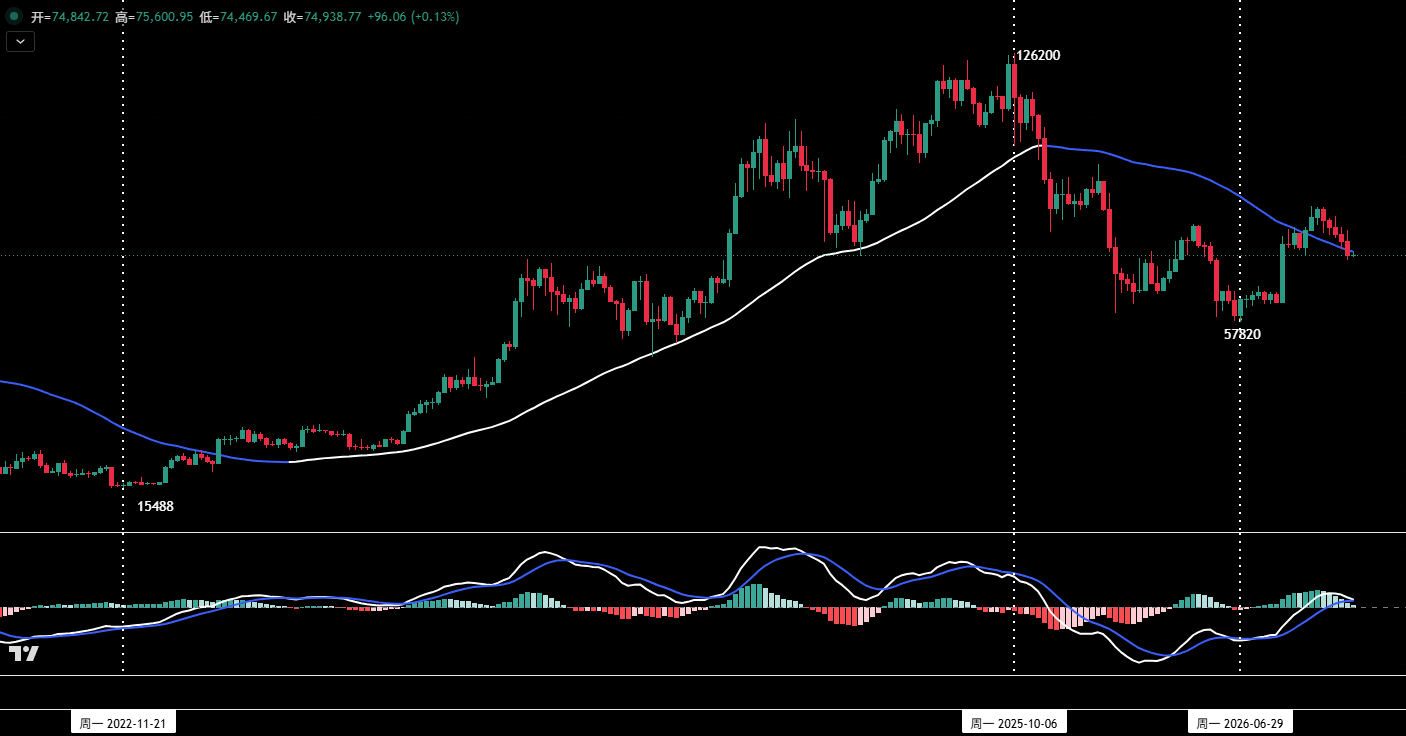
Figure 1 Bitcoin weekly candlestick chart
1. Market characteristics under the weekly framework (as shown in Figure 1)
① The price has stayed above the 52-week moving average for eight consecutive weeks
Since the weekly close on September 14, the cryptocurrency price has successfully broken through and stayed above the 52-week moving average (white and blue) for eight consecutive weeks, basically satisfying the "price breakout principle" of the quantitative rules.
② A phase high has been established, returning for confirmation has lasted five weeks
The price reached a phase high of $87,399 on September 21 and recorded a weekly close phase high of $86,515 on September 28. Since then, the market has continuously retreated from the high, undergoing a return for confirmation, lasting five weeks so far.
③ The 52-week moving average is still declining, with price testing near the average line.
The current 52-week moving average is around $76,110, still trending downward. The closing price last week was approximately $74,900, situated near the 52-week moving average.
2. In summary, based on the current market performance, we draw the following four conclusions:
① "Price breakout principle" has been satisfied, and the transition from bear to bull has begun.
The current market performance has met the "price breakout principle" in the quantitative rules and is in the transitional phase from "bear market" to "bull market." It must be emphasized that a transition does not equal confirmation. Whether the actual change can be completed depends on whether the following two conditions are met.
② The return for confirmation has not yet issued a successful signal
As of last week's close, although the price has returned near the 52-week moving average, no return confirmation signal has been issued yet.
③ The 52-week moving average has not yet flattened
The current 52-week moving average is still in a downward phase, and it has not yet entered the "flattening phase" required by the quantitative rules.
④ Conclusion: This round of rebound still belongs to a severe oversold rebound
The rebound that started from the low of $57,820 on July 1 should still be classified as an oversold rebound and is not sufficient to confirm the establishment of a bull market.
3. Future market focus: How to verify the two thresholds?
① Observe whether the price can receive support and stabilize upward near the 52-week moving average (currently about $76,110). This is the most critical issue in the short term.
② Observe the change in the slope of the 52-week moving average, and when it will change from downward to flat or even upward. This is the final key to confirming a bull market.
Appendix: Quantitative three principles of the "52-week moving average confirmation method."
First, price breakout principle (bear to bull): The weekly closing price breaks through the 52-week moving average and stays above this average line for 2-3 consecutive weeks; if it only pierces in a single week and then falls back, it is considered a false breakout.
Second, return confirmation principle: After the price operates above the 52-week moving average for a period (usually more than 5 weeks), a return confirmation process should occur to further enhance the effectiveness of the breakout.
Third, bull market confirmation principle: The price continues to operate above the 52-week moving average, and the moving average slope turns upward.
2. Daily chart structure analysis of Bitcoin
Last week, the market was influenced by news, leading to extreme reversals over two consecutive trading days. On November 4, midterm election news stimulated the price to surge by 3.92%, with a volatility of 7.1%, surpassing $80,000; just one day later, the significant drop in U.S. stocks dragged the price down 5.48%, with a volatility of about 7.01%, plunging to the lowest point since the adjustment on September 21 at about $75,222, while the fear index approached 25.
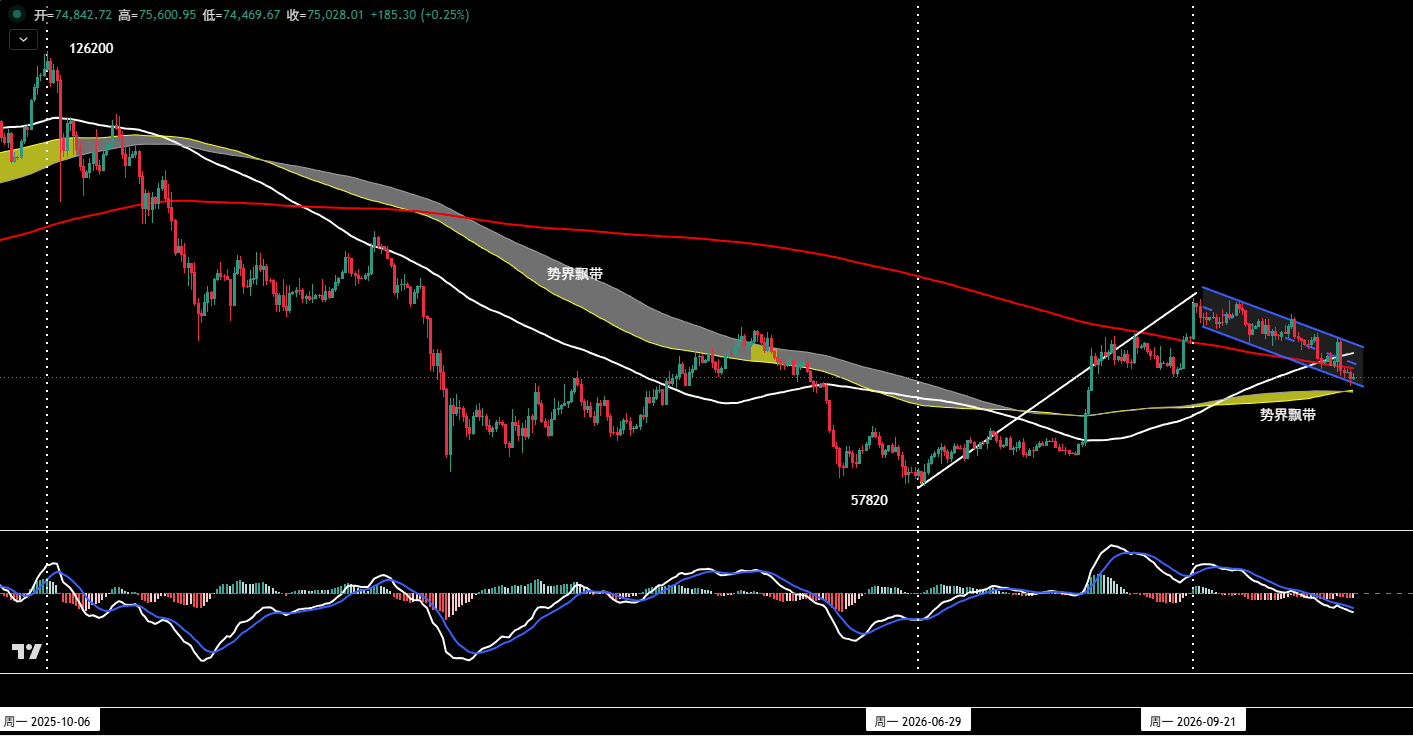
Figure 2 Bitcoin daily candlestick chart
1. Recap: Verification of previous judgments
In the last weekly review, we stated clearly: the adjustment that began on September 21 has entered the bottom region, and after a short-term rebound, there might be a second bottom formation; even if it breaks below the recent low (about $76,265), a daily adjustment wave (ⅰ wave) terminating near $75,000 remains a high-probability event, with no need to panic at that position. The actual trend confirms this. Although news disturbances pierced the support of $75,000, the price still closed near $75,000 last week, indicating strong support at that position.
2. Structure: Four signals for current trend (as shown in Figure 2)
① The channel has not been broken
The price is still operating along the original downward channel. The lower boundary is formed by connecting the two lows on September 24 and October 8, and the upper boundary is a parallel line based on the high on October 5. After the drastic fluctuations last week, the price remains within the channel, with no deviation in the short-term trend.
② Price crossover point has been lost
The price has dropped below the crossover point formed by two important moving averages (white line, red line) at around $77,200; however, the current price is still hovering near the red moving average, not yet completing the "binding force" of exiting that moving average.
③ The 0.382 retracement level remains effective
Based on the previous five-wave increase, the three golden retracement levels for this round of correction are: $76,130 (0.382), $72,610 (0.5), and $69,120 (0.618). The current price has not effectively fallen below $76,130, and the second level (at $72,610) provides stronger support.
④ The market has entered a bottoming stage, with a rebound likely to unfold at any time
As long as no new external negative news emerges this week, the price is expected to digest the selling pressure from November 5 in a volatile manner, gradually entering the bottoming phase, during which a "single needle bottom" pattern may occur. This round of adjustment has lasted 48 trading days, and both the time and space dimensions are basically fulfilled. External news may affect market rhythm but will not alter its direction, and the market will eventually return to its normal operational rules. The ⅱ wave rebound may be delayed but will not be absent.
3. Adjustment within the three-wave framework
① ⅰ wave (adjustment wave): From September 21 to present
• Starting point: $87,399
• Has been ongoing for 48 trading days (still in progress)
• Maximum drop within the range: 15.9%
② Daily chart ⅰ wave adjustment has not ended
Since the price adjustment, regardless of how the news has disturbed it, the price has never broken through the upper channel to commence a rebound repair trend. This indicates that the current adjustment structure has never been broken; the ⅰ wave has not yet ended, and the ⅱ wave rebound has not yet begun.
③ Subsequent trend deduction
Once the ⅰ wave completes, the market is expected to welcome a ⅱ wave rebound, followed by a ⅲ wave adjustment, completing the final bottoming.
4. Momentum ribbon: Long-short quantitative model
As shown in Figure 2, we traced the historical data of the market over nearly nine years and created a long-short operational quantitative model based on probability statistics, namely the "momentum ribbon" (the yellow-gray channel in the figure). The model determination rules are as follows: when the price effectively stands above the ribbon and the ribbon turns yellow, it is deemed a bullish market, and the operation focuses on buying on dips. When the ribbon turns gray, it is determined to be a bearish market, and the operation focuses on selling on highs. Current signals show that the bullish pattern is still continuing.
3. Bitcoin's market forecast and operational strategies for this week
1. BTC's market trend forecast for this week
This week's core viewpoint: Focus on the competition between bulls and bears over the "momentum ribbon."
2. Key resistance levels
• First resistance area: $76,500 to $78,500 (previous important point)
• Second resistance area: Around $82,000 (previous important point)
• Third resistance area: $85,000 to $87,500 (previous important point)
3. Key support levels
• First support level: $72,500 to $73,500 (previous important support level)
• Second support level: Around $69,100 to $70,000 (previous important support level)
4. Operational strategies for this week (excluding impact from unexpected news)
① Medium-term strategy:
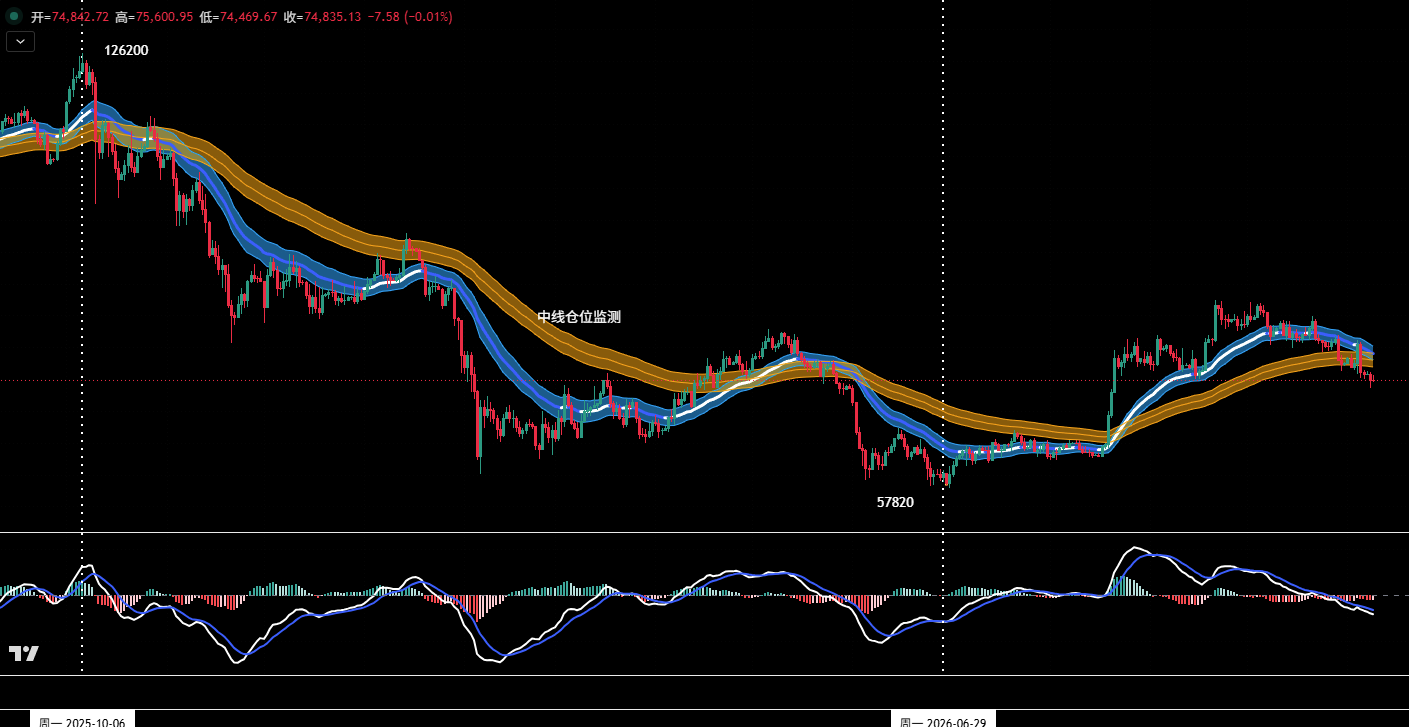
Figure 3 Bitcoin - Daily candlestick chart: (Position monitoring model)
Medium-term watch and wait
As shown in Figure 3, following the market developments last week, the current price has dipped below the "position monitoring channel," but an effective return confirmation has not yet been completed. Before signals are confirmed, the medium-term strategy will be to hold cash and wait, without a directional entry.
② Short-term strategy: Utilize 30% of capital, set stop-loss points, and look for trading opportunities in "price differences" (using 30-minute/60-minute as the operational cycle).
③ In short-term operations, based on the current trend structure analysis, this week's strategy will be primarily to "buy on dips." We pre-plan an operational proposal.
• Light positions in strong support area to test long.
• Opening position: If a clear stabilization pattern occurs in the $72,500 to $73,500 range, and the quantitative model simultaneously issues bottom signals, a light long position can be established, with the position kept under 30%.
• Risk control: Set initial stop-loss level.
• Closing position: When the price rebounds to near key resistance levels and in conjunction with model signals, positions can be closed in batches to lock in profits.
4. Daily chart structure analysis of HYPE
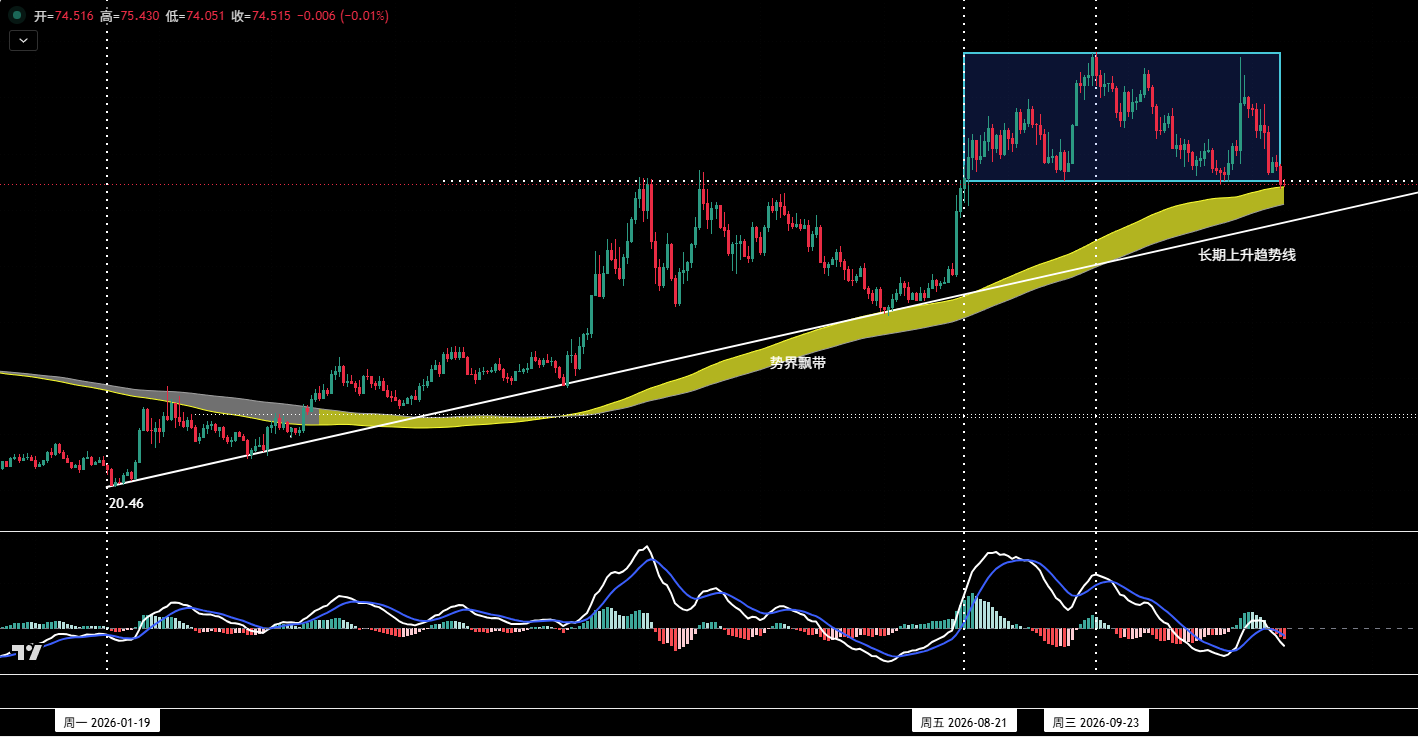
Figure 4 HYPE daily candlestick chart
1. Last week's trend: Structural pullback under external impact
Last week, HYPE was not isolated and experienced a significant pullback due to the spillover impact of a systemic decline in U.S. stocks, with the weekly candle closing down 15.19% at around $74.5 (just below $75). Its body fully covered the bullish candle that rose 15.16% in the previous week, forming a typical "bear engulfing" pattern. It is important to state that the driving force behind this decline was external and not due to a deterioration in HYPE's fundamentals, which provides a basis for assessing the "effectiveness of support" in the future. If support holds, it is a repair after a false kill; if support is lost, the original trend will need to be reassessed.
2. Three-line support system: From trend direction to the lifeline of bulls
① Momentum ribbon: Conditions for determining trend direction
Since HYPE's price successfully stood above the momentum ribbon on March 14, throughout nearly 240 trading days, the ribbon has consistently maintained a yellow color, indicating that the market has been in a bullish state for a long time, and the overall direction has not been disrupted. During this period, there have been several adjustments and returns to the ribbon, but support has always been garnered nearby, restarting the upward trend.
The current upper boundary of the ribbon is about $74.05, the lower boundary is about $71, and the overall slope continues upward. The price has currently retreated to near the upper boundary of the ribbon. If it stabilizes here, the bullish trend continues; if it effectively breaks below, and the ribbon turns gray, then the market may transition between bulls and bears.
② Lower boundary of the box: A watershed for medium- and short-term bulls and bears
After the price broke through the previous high of $76 with volume on August 21, it entered a broad box fluctuation; the upper boundary is about $98, and the lower boundary is about $75.
It is noteworthy that on October 24, the price fell back to the lower boundary of the box, triggering a range rebound of 20%, proving that the lower boundary has strong buying support.
③ Long-term upward trend line: The last barrier for bulls
Since starting to rise from the low point of $20.14 on January 21, HYPE has continually operated along a long-term upward trend line. This line is formed by connecting the starting point and several critical stage low points, marking the "baseline" of the bullish trend, currently positioned near $68.
5. HYPE's market forecast and short-term operational strategies for this week
1. HYPE's market trend forecast for this week
① Key resistance levels:
• First resistance level: $82.5 to $85
• Second resistance level: $88 to $89
• Third resistance level: $95 to $98
② Key support levels:
• First support level: $74 to $75 (upper boundary of the ribbon + lower boundary of the box)
• Second support level: Around $71 (lower boundary of the ribbon)
• Third support level: Around $68 (long-term trend line)
③ Core viewpoints for this week:
This week, pay close attention to whether the price can stabilize at the support level.
2. HYPE's short-term operational strategies for this week
① Test long with light positions if dual support stabilizes:
If the price stabilizes and continuously rises in the $74 to $75 range, those holding cash may consider light positions to test long, limiting positions to under 30%, while setting stop-losses and strictly enforcing them.
② Long entry if long-term trend line stabilizes:
If the price continuously adjusts to the $68 to $71 range and forms a stable bottom, those holding cash may consider light positions to test long, with position control under 30%, setting stop-losses and strictly enforcing them.
6. Special reminders
1. When opening a position: Set the initial stop-loss immediately.
2. When profits reach 1%: Move the stop-loss to the opening cost point (breakeven point) to ensure capital safety.
3. When profits reach 2%: Move the stop-loss to the position of 1% profit.
4. Continuous tracking: After this, for every additional 1% of profit, move the stop-loss synchronously by 1%, for dynamic protection and locking.
The financial market is ever-changing; all analysis and trading strategies require dynamic adjustments. All viewpoints, analysis models, and operational strategies mentioned in this article derive from personal technical analysis and are for personal trading logs only, not constituting any investment advice or operational basis. The market carries risks, and investments require caution; do not base decisions solely on this information.
免责声明:本文章仅代表作者个人观点,不代表本平台的立场和观点。本文章仅供信息分享,不构成对任何人的任何投资建议。用户与作者之间的任何争议,与本平台无关。如网页中刊载的文章或图片涉及侵权,请提供相关的权利证明和身份证明发送邮件到[email protected],本平台相关工作人员将会进行核查。


