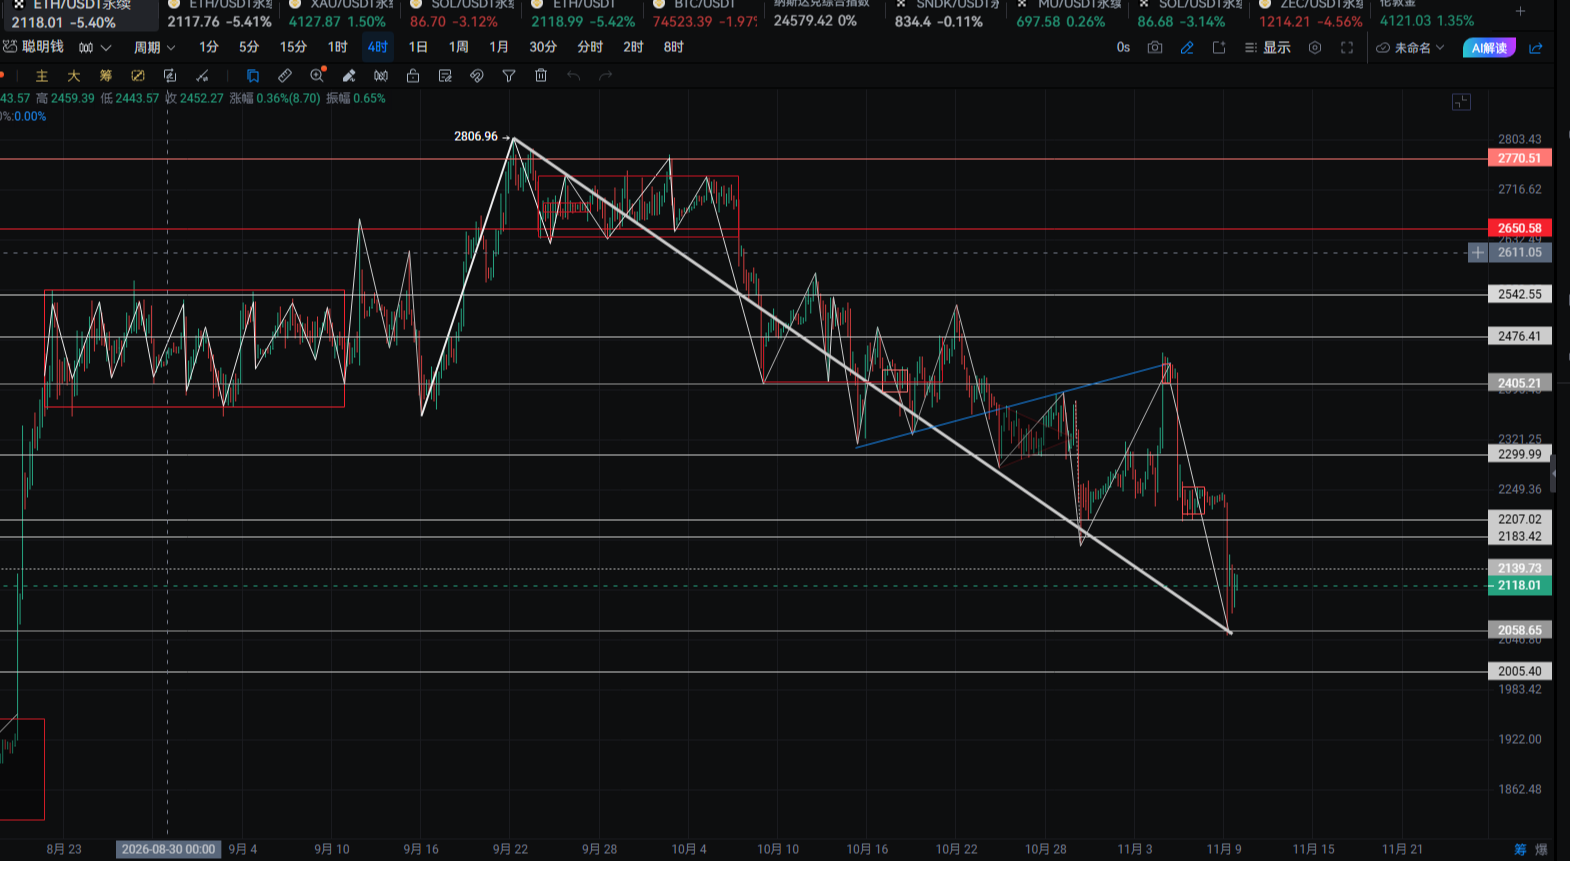
Two pieces of news are worth looking at together this morning. The first is that the US-Iran framework agreement has been initiated, the Strait of Hormuz is immediately opened, the US will unfreeze Iranian assets, and geopolitical risks are significantly easing, leading to an overall boost in risk assets; the second is that US stock AI concept stocks continue to rebound, with the Nasdaq rising 3.28%, COHR soaring 17.28%, and funding risk appetite is on the rise. However, on the other side, the market's liquidation of over $1.2 billion and the losses of long positions amounting to $1.04 billion have not dissipated, and BTC only dropping 6% after the theft of $6.3 billion from Binance indicates that the market structure is more resilient than imagined. Positive and negative forces are colliding, and BTC has not established a clear direction, instead repeatedly hovering close to the 1-hour EMA55, which tests discipline the most in trading.
Current price and time
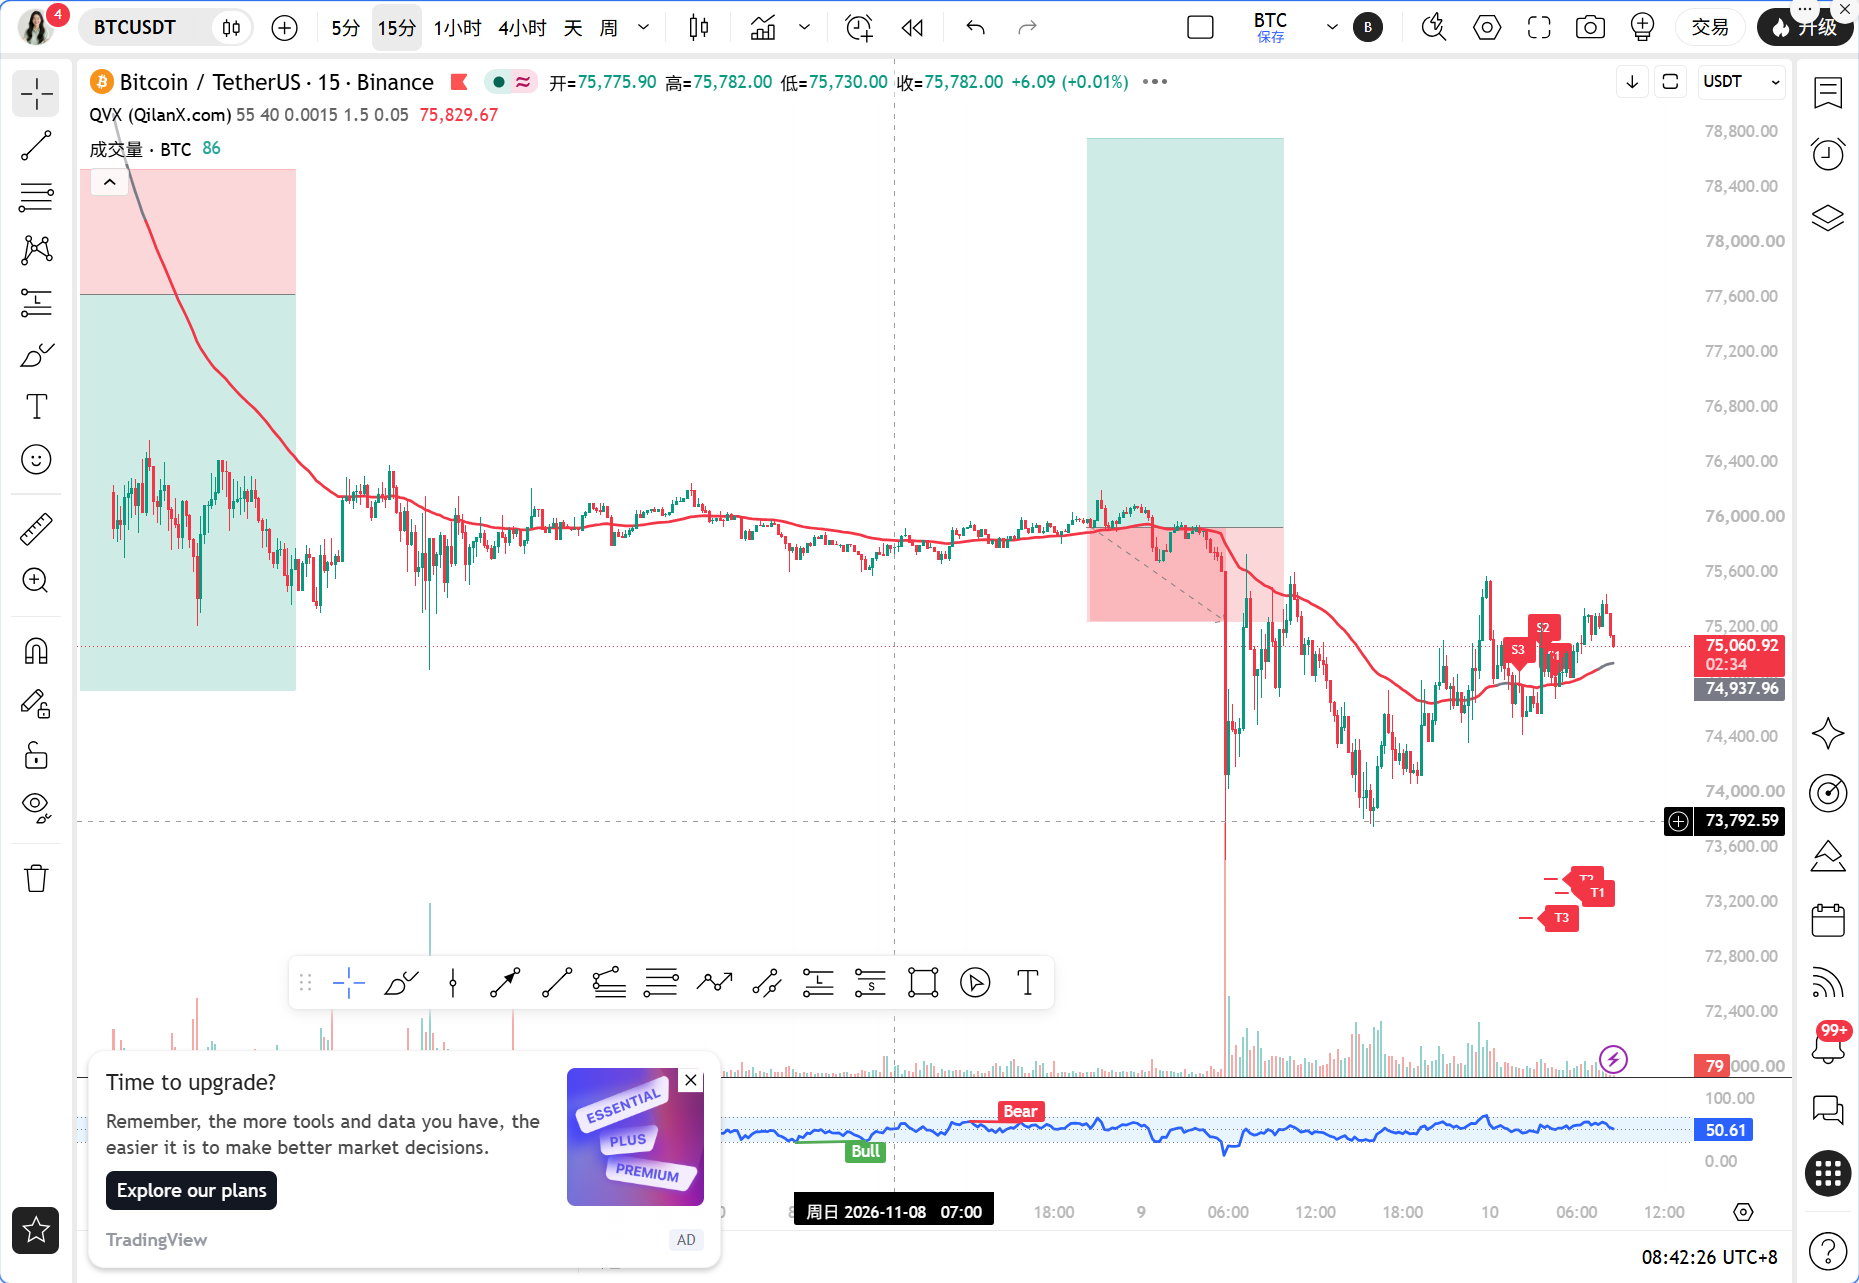
It is now November 10 at 08:41, the latest price of BTC is 75066 USDT, with a 24-hour price change of 0.28%, almost stagnating. The fear and greed index is at 32, still in the fear zone, with a market share of 59.72%, showing no significant sign of funds spreading out from BTC. The price is only 0.19% away from the 1-hour EMA55, a typical tight line fluctuation, making it easy to get caught on both sides when chasing orders at this position.
Multi-period state overview
The daily line direction remains bearish. The daily MA5=75399.49, MA10=76621.33, MA30=79614.57, and the moving averages are still in a bearish arrangement, with the MACD showing DIF=-1721.14, DEA=-1430.41, and a histogram value of -290.72, with green bars still releasing. RSI=32.95 is close to oversold but has not yet formed an effective rebound. The daily level can only be defined as a low-level repair after a decline, without talking about reversal.
Signs of a halt in the 4-hour timeframe began to appear. The 4-hour MA5=75043.59 and MA10=75079.49, with prices staying near these two short moving averages, while the MA30=75952.75 is still pressing from above. The MACD shows DIF=-551.53, DEA=-600.28, and a histogram value of 48.76 has turned red, signaling a recovery of momentum at the 4-hour level, with RSI=43.38 rising from a low level, indicating that the bearish momentum is waning but has not yet turned into bullish dominance.
The 1-hour timeframe is the key today. The 1-hour MA5=75123.88, MA10=75057.90, MA30=74854.96, and the short moving averages are starting to entangle and flatten. The MACD shows DIF=2.32, DEA=-85.63, and a histogram value of 87.95, with red bars expanding, and DIF has just crossed above the zero axis. RSI=62.58 is leaning strong but has not overheated. The issue is at EMA55=75208.70, and the current price of 75066 is still below the dividing line, and the bulls have not yet grabbed the entry ticket.
A short-term weakening has appeared in the 15-minute timeframe. The 15-minute MA5=75217.02 and MA10=75217.00 are almost merged, while the MA30=74951.37 is supporting from below. The MACD shows DIF=103.42, DEA=106.68, and a histogram value of -3.26 has formed a dead cross, with RSI=56.11 being neutral to weak. There is a demand for a shallow pullback, and the timing to chase long is not right.
TPV signal validation
First, let's look at the trend positioning. The current price of 75066 is less than the 1-hour EMA55 of 75208.70, according to TPV system rules, which means it is currently in a bearish trend area, and it has not crossed the first threshold for going long. In the past 8 1-hour candlesticks, there were only 2/8 instances where the closing price was greater than EMA55, and there were 2 crossings. The price's deviation from EMA55 of 0.19% is less than 0.3%, indicating tight line fluctuations, and the probability of oscillation is increasing, but the system currently determines that it does not meet the standard oscillation threshold, suggesting it may still be at the tail end of a unilateral trend. In other words, the direction has not been fixed, but the discipline must be established first.
Compare the three conditions for going long one by one. The first condition is that the price must stabilize above EMA55, requiring two consecutive 1-hour closing prices greater than 75208.70; currently, there is not even one, so it does not meet this requirement. The second condition is for support to stabilize; the 1-hour MA30=74854.96 area is a recent effective low point, and if the price pulls back to this area and shows a long lower shadow or bottom formation, it would count as valid, but it has not yet pulled back for verification. The third condition is for bearish momentum to exhaust; the 1-hour MACD's red bars continue to expand, and RSI has risen from a low position to 62.58, partially satisfying this condition, but the 4-hour and daily levels remain underwater, so the level of momentum exhaustion is insufficient. Only one of the three conditions is satisfied, so the conditions for going long are not established.
The conditions for going short are also incomplete. The price is indeed below EMA55, but only by 0.19%, and the 1-hour MACD's red bars are expanding while the 4-hour bars have turned red, showing that rebound momentum is still present, which does not meet the requirement of a weak rebound. At this time, going short would be betting directionally at a tight line position, leading to a poor risk-reward ratio.
The conclusion is very clear: the TPV system currently does not provide signals for actively going long or short, only giving interval indications. There is a resistance level above at EMA55=75208.70 and a support level below at the 1-hour MA30=74854.96, with prices operating in this narrow range, waiting for the closing price to provide an answer.
On-chain/Funding situation
The fear and greed index is 32, and market sentiment is still in fear territory. In this sentiment, rebounds are likely to be short-lived, but this is also a common characteristic of bottom areas. The market share of BTC remains high at 59.72%, indicating that funds are still concentrating towards BTC, and the outflow from altcoins has not ended. Events like the stopping of block production on the Injective mainnet and supply chain attacks on Swarm will further suppress altcoin sentiment. In terms of liquidation data, there have been over $1.2 billion in liquidations and $1.04 billion in losses for long positions; leverage has been cleaned out, and the motivation for a continued sharp drop in the short term is weakening, but a rebound also requires new incremental funds. The US-Iran agreement and the 7.3% drop in oil prices are favorable for inflation expectations, and the Nasdaq's rebound is also improving risk appetite. These are potential incremental sources, but transmitting to the crypto market will take time.
Key defense and attack levels
The first line of defense above is the 1-hour EMA55=75208.70, which is the dividing line of the TPV system; the closing price needs to stand above and confirm with two consecutive candlesticks for it to be considered a turn to bullish. The second level above is the 4-hour MA30=75952.75, which is the pressure center at the 4-hour level. The first support below is the 1-hour MA30=74854.96, and the second support is the 75043 to 75079 area where the 4-hour MA5 and MA10 are located. If the price breaks below 74854.96, the daily low area will be tested again. The upper bound of the range is 75208, the lower bound is 74855, with less than 0.5% space in between, showing a clear characteristic of narrow fluctuation.
Trading ideas
Direction: Currently, it is mainly for observation, waiting for the TPV signal confirmation before taking action, without guessing the direction.
Conditions for entering a long position: Two consecutive 1-hour closing prices must stand above 75208.70, and a pullback must not break the 75066 to 75123 area, showing a stabilization pattern, with the 1-hour MACD red bars maintaining expansion and RSI not falling below 50 – only when all three are met can one enter. The entry reference is the range of 75250 to 75300, with a stop loss set below 74850, and the first target at 75952, the second at 76621.
Conditions for entering a short position: Two consecutive 1-hour closing prices must fall below 74854.96, and any rebound touching 75066 to 75123 must encounter resistance, showing a long upper shadow or a bearish engulfing pattern, with the 1-hour MACD red bars shortening and turning green; only when all three conditions are satisfied can one enter. The entry reference is the range of 74900 to 74950, with a stop loss set above 75300, and the first target at 74300, the second at 73800.
If the price continues to oscillate tightly between 74855 and 75208, do not actively open positions; instead, engage in short-term high selling and low buying in this range, controlling positions within 20%, with strict stop losses set 0.3% outside the range.
Risk warning
There is a high probability of false breakouts in tight line markets; any crossing by a single candlestick does not count; confirmation must wait for the closing price, and stop losses are always more important than judgments.
Follow the Qinglan Crypto Classroom to seize more trading opportunities together! You are welcome to visit the official website www.qinglan.org
📊 Qinglan TPV Trading Strategy Backtest Reference
🕒 Last Backtest Time 11-10 07:00:02
Total Analysis: 5010 Backtests: 5000 Accuracy Rate: 75.7% (3784/5000)
免责声明:本文章仅代表作者个人观点,不代表本平台的立场和观点。本文章仅供信息分享,不构成对任何人的任何投资建议。用户与作者之间的任何争议,与本平台无关。如网页中刊载的文章或图片涉及侵权,请提供相关的权利证明和身份证明发送邮件到[email protected],本平台相关工作人员将会进行核查。