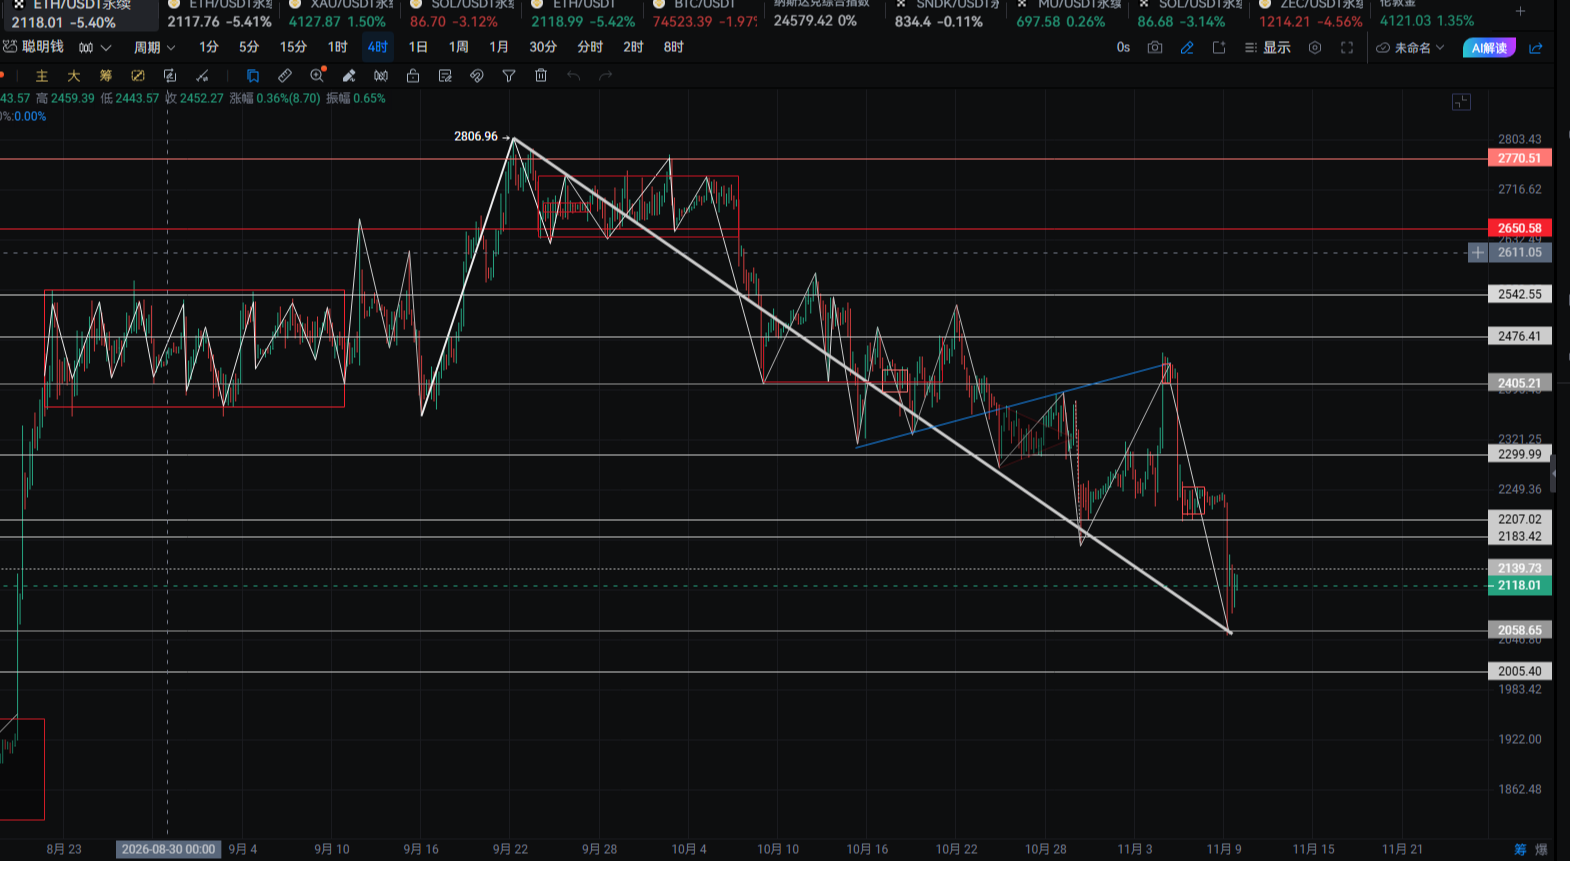
Crypto Circle Academician: On November 10, Ethereum (ETH) was precisely pierced and then pulled back, is it washing out or building a top?
Since the high point of 2806, the two cakes have retreated 24% cumulatively, and market sentiment has rapidly switched from FOMC to Fear. Many people ask me: Is it a trend reversal or a medium-term adjustment now? I won't give a direct conclusion, but instead will break down the current daily and 4-hour structures using four dimensions: EMA moving average system, MACD volume, Bollinger Bands channel, and TD sequence. This article is suitable for friends willing to spend time analyzing the market. Follow me for ongoing output on multi-cycle resonance, key level identification, and risk-reward calculation methods. First, a disclaimer: the following is only personal technical observation and does not constitute investment advice.
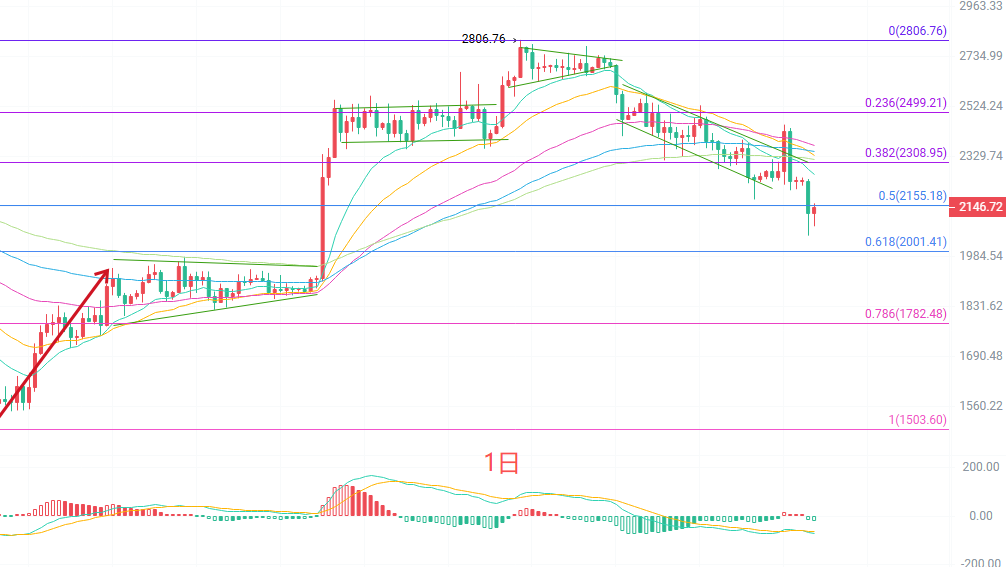
The daily candlestick is a doji with a long lower shadow, indicating that there is buying support around 2080. However, the moving average structure looks bad: the price at 2131 has broken below EMA15 at 2263, EMA30 at 2333, and EMA60 at 2370, all showing a typical bearish arrangement. The MACD downward momentum has not been fully released. The lower Bollinger Band at 2121 was just pierced intra-day but then recovered, which is a watershed for bulls and bears; maintaining above here indicates a rebound from an oversold condition, while breaking below indicates the next level down.
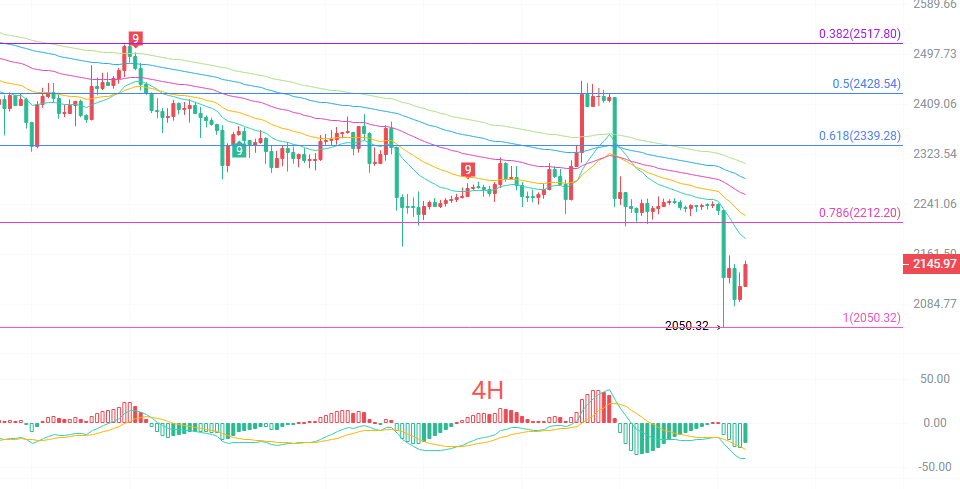
The 4-hour candlestick is the strongest since the rise in August. The current price is 2131, standing below all EMAs, and the moving averages are in perfect bearish arrangement. The MACD is below the zero axis with green columns, and the DIF continues to cross below the DEA, showing no signs of a golden cross in the short term. The lower Bollinger Band at 2105 has the price tightly adhering to it, and the Bollinger Bands are opening wider, indicating that the downward trend has not yet finished. TD signals have appeared, and the strength of the rebound will be suppressed layer by layer.
Short-term reference:
Northbound from 2100 to 2050 faces resistance, stop loss at 30 points, target looking at 2185 to 2220.
Southbound from 2220 to 2270 stagnates, stop loss at 30 points, target looking at 2150 to 2100.
Specific operations should focus on real-time market data, and for more detailed information, you can consult the author. The article is published with a delay, and suggestions are for reference only; risks are to be borne by oneself.
Friendly Reminder: The above content is synchronized update by the Crypto Circle Academician on major trading platforms such as Binance, OKEX, Huobi, etc. For more content, you can add me as a friend in Binance OKEX and join my fan group.
免责声明:本文章仅代表作者个人观点,不代表本平台的立场和观点。本文章仅供信息分享,不构成对任何人的任何投资建议。用户与作者之间的任何争议,与本平台无关。如网页中刊载的文章或图片涉及侵权,请提供相关的权利证明和身份证明发送邮件到[email protected],本平台相关工作人员将会进行核查。