In the U.S. stock market, the trading volume leaderboard reflects capital transactions, the price increase leaderboard reflects price performance, while the trending searches leaderboard observes market attention.
Attention does not equal capital, nor does it equal future price increases, but it can help users quickly identify: which companies, indices, and themes are frequently searched and discussed by investors recently.
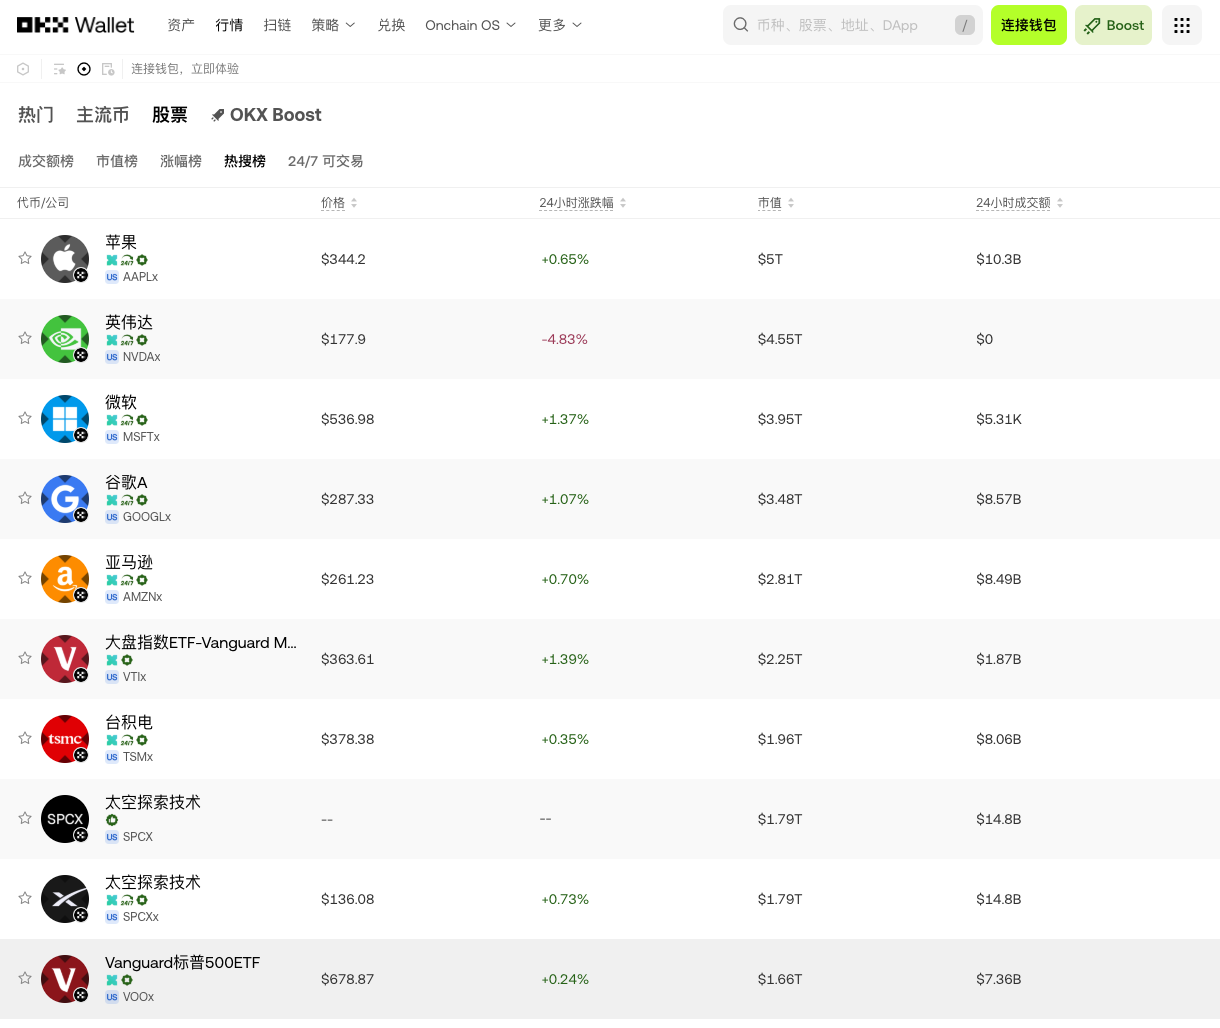
On November 9, 2026, the OKX Wallet U.S. stocks trending searches leaderboard shows that market attention is focused on Apple, Nvidia, Microsoft, Google, Amazon, Vanguard Large Cap Index ETF, TSMC, SpaceX-related assets, and Vanguard S&P 500 ETF among others.
The top ten assets also cover four main lines:
- U.S. Tech Giants: AAPLx, NVDAX, MSFTx, GOOGLx, AMZNx;
- Index Assets: VTIx, VOOx;
- Semi-conductor Industry Chain: TSMx;
- High Attention Non-listed Companies/Tokenized Assets: SPCX and SPCXx.
The value of this leaderboard is not to tell users "you must buy the top asset," but to provide a real-time map of market attention: which assets investors are currently focused on discussing, and which themes may become the starting point for further research.
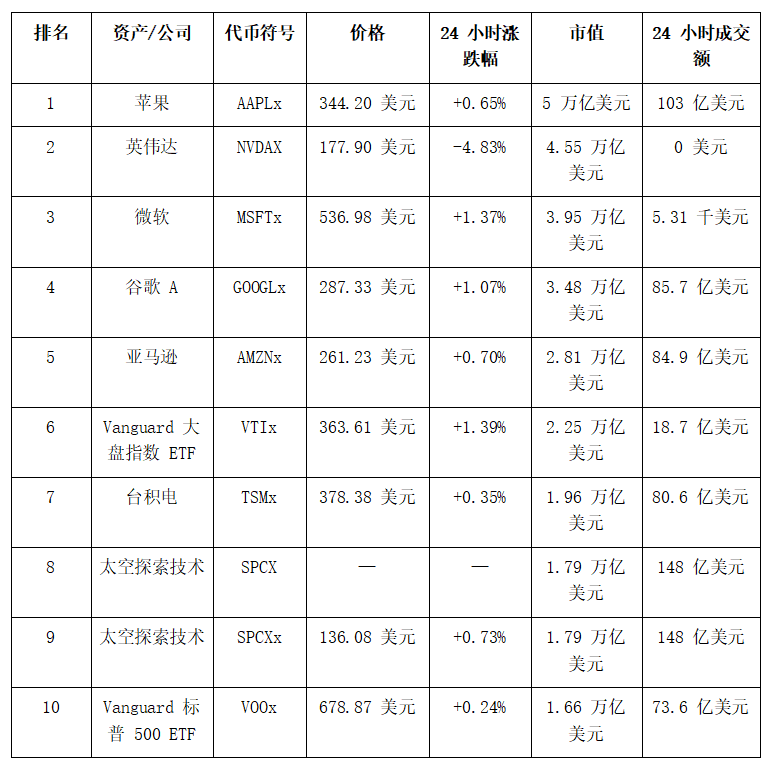
Top Ten Trending Data
According to the data from November 9, 2026, the OKX Wallet trending searches leaderboard displays the following data:
Trending First: Why is Apple Still the Center of Market Attention?
Apple ranks first on the trending searches leaderboard, with AAPLx priced at $344.20, a 24-hour increase of 0.65%, and a market capitalization of approximately $5 trillion, with a 24-hour trading volume of approximately $10.3 billion.
Apple maintains high attention not only due to its large market cap but also due to several variables impacting its valuation:
- iPhone product cycle;
- Service business and subscription revenue;
- AI features and ecosystem;
- Sales in China and other major markets;
- Supply chain and product release rhythm;
- Buybacks, cash flow, and profit margins.
The appearance of AAPLx at the top of the trending searches indicates that the market's attention to Apple is still persistent. For investors, trending searches can serve as a research entry point, but the real need for further verification is whether the search heat translates into sustained transactions, how much future growth is already factored into the current market price, and whether there are recent earnings reports, product launches, or policy catalysts.
Being popular does not mean being cheap. Quality companies may also experience valuation corrections due to overly high expectations.
Nvidia Trending Second: A Signal of Attention with a 4.83% Drop
Nvidia ranks second, with NVDAX priced at $177.90, a 24-hour drop of 4.83%, and a market capitalization of approximately $4.55 trillion.
Nvidia is a core observation in the AI computing industry chain. The market typically trades around the following questions:
- Will GPU demand continue to grow;
- Will data center and cloud providers sustain capital expenditures;
- New product deliveries and supply chain conditions;
- Return on AI investments from major customers;
- Competitive pressures and self-researched chip alternatives;
- Can high valuations be absorbed by performance growth.
It is worth noting that while Nvidia is the second trending search, its daily decline of 4.83% is significantly higher than that of most assets on the leaderboard.
This suggests that the trending searches leaderboard may not capture a purely bullish sentiment; it may also reflect increased discussion triggered by drastic fluctuations. For data analysis users, "rising trends + price declines" are often more worthy of research than a simple increase: it could represent risk reassessment, profit-taking, news impact, or market repricing for future growth.
Microsoft, Google, Amazon: AI Themes Expand from Chips to Cloud and Applications
MSFTx: Up 1.37%, Focus on Enterprise AI Monetization
Microsoft ranks third, with MSFTx priced at $536.98, a 24-hour increase of 1.37%, and a market capitalization of approximately $3.95 trillion, with a trading volume of about $5.31 billion.
Microsoft's research focus typically includes Azure cloud growth, AI service commercialization, Copilot subscriptions, enterprise software demand, and data center capital expenditures.
GOOGLx: Up 1.07%, Observing Advertisement, Cloud, and AI Competition
Google A ranks fourth, with GOOGLx priced at $287.33, a 24-hour increase of 1.07%, and a market capitalization of approximately $3.48 trillion, with a trading volume of about $8.57 billion.
Google's market focus can be broken down into:
- Search advertising and commercialization capability;
- Google Cloud growth;
- AI models and product ecosystem;
- Impact of AI assistants on search entry;
- Capital expenditures and data center construction;
- Regulatory and antitrust policies.
The trending searches for GOOGLx, along with its high trading volume, indicate that it is not only a topic of discussion but also has significant market trading attention. Under the AI theme, Google, Nvidia, Microsoft, and Amazon are not identical assets; they represent different segments such as models, cloud, advertising, infrastructure, and platform entry.
AMZNx: Up 0.70%, Trading Cloud Computing and Consumer Platforms
Amazon ranks fifth, with AMZNx priced at $261.23, a 24-hour increase of 0.70%, and a market capitalization of approximately $2.81 trillion, with a trading volume of about $8.49 billion.
Amazon's core observation variables include AWS growth, e-commerce profit margins, advertising business, logistics efficiency, and AI infrastructure investments.
The trending searches value of AMZNx lies in its combination of AI trading with consumption, e-commerce, and cloud services. The market is not just discussing who is producing AI chips, but also examining who can translate AI investments into revenue, profits, and cash flow.
Index ETFs Enter Trending Searches: The Market Seeks More Diversified Expressions
VTIx: Covering U.S. Large-cap Assets
Vanguard Large Cap Index ETF ranks sixth, with VTIx priced at $363.61, a 24-hour increase of 1.39%, and a market capitalization of approximately $2.25 trillion, with a trading volume of about $1.87 billion.
Compared to individual tech stocks, large-cap index ETFs offer more diversified market exposure. They are suitable for observing the risk appetite of the overall U.S. stock market, rather than betting on a single company's business.
The increase in VTIx is among the higher levels on the leaderboard, and its trading volume reaching the billion-dollar level indicates that the market's trending searches are not only focused on AI giants but also on broader large-cap asset allocation.
VOOx: Market Representativeness of the S&P 500
Vanguard S&P 500 ETF ranks tenth, with VOOx priced at $678.87, a 24-hour increase of 0.24%, and a market capitalization of approximately $1.66 trillion, with a trading volume of about $7.36 billion.
Both VTIx and VOOx entering the trending searches top ten provides an important comparison:
- VTIx is more inclined towards the overall U.S. large-cap market;
- VOOx represents large companies in the S&P 500;
- Both can serve as tools for observing the overall market risk appetite;
- However, index assets are also influenced by interest rates, economic cycles, and valuation changes.
When index ETFs and tech giants simultaneously enter the trending searches, it indicates that investors may be paying attention to two types of issues: one is the growth opportunities of specific companies, and the other is how to participate in the overall performance of the U.S. stock market through more diversified assets.
TSMC: A Key Semiconductor Manufacturing Link in Trending Searches
TSMC ranks seventh, with TSMx priced at $378.38, a 24-hour increase of 0.35%, and a market capitalization of approximately $1.96 trillion, with a trading volume of about $8.06 billion.
TSMC is a representative manufacturing link in the semiconductor industry chain. Unlike Nvidia's chip design and Microsoft's and Amazon's cloud platforms, TSMx mainly reflects advanced process, foundry, AI chip orders, and global semiconductor capital expenditures logic.
TSMx has a high trending search ranking and high trading volume, indicating that when the market focuses on the AI industry chain, it does not only look at application platforms and chip brands, but also pays attention to manufacturing capabilities and supply chain bottlenecks.
Research related to TSMC should pay attention to:
- Demand for advanced processes;
- AI chip orders;
- Capacity utilization;
- Client concentration;
- Geopolitical and supply chain risks;
- Capital expenditure plans.
SPCX and SPCXx: Must Differentiate Between Two Display Items
The eighth and ninth positions both display "Space Exploration Technologies," but the symbols are SPCX and SPCXx, which cannot be directly mixed as one asset.
The data is:
- SPCX: Price displayed as “—”, 24-hour fluctuation displayed as “—”, market capitalization approximately $1.79 trillion, trading volume approximately $14.8 billion;
- SPCXx: Price approximately $136.08, 24-hour increase of 0.73%, market capitalization approximately $1.79 trillion, trading volume approximately $14.8 billion.
For SPCXx, users can further study its asset mapping, trading mechanisms, liquidity, and tradable regions; for SPCX, confirmation is needed regarding why the price data is not displayed, whether trading is supported, and whether the page data is complete.
How should the trending searches leaderboard be used together with the trading volume leaderboard?
The meanings of the trending searches leaderboard and the trading volume leaderboard are different, and they should not replace each other.
Trending Searches Leaderboard Answers: What is the Market Discussing?
It is suitable for discovering changes in interest regarding themes, companies, and assets. Rising trends may stem from price increases, drops, news, earnings reports, social media, or market controversies.
Trading Volume Leaderboard Answers: Where is the Capital Executing Trades?
Trading volume is closer to actual trading activities, but it must also be assessed alongside liquidity, trading depth, and data statistical metrics.
Methods for Combined Usage
Users can create a simple four-quadrant chart:
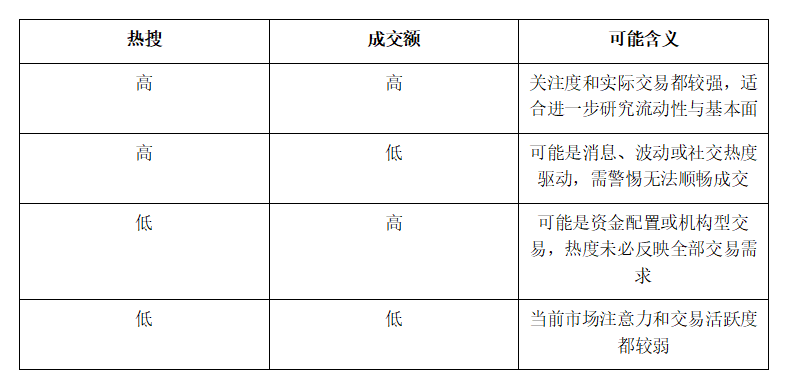
Apple, Google, Amazon, and TSMC simultaneously hold high trending positions and high trading volumes, aligning closer to a combination of “attention + trading activity”; NVDAX and MSFTx, however, show a contrast with high trending searches but relatively low trading volumes, needing closer verification of page statistics and tradable status.
What Practical Use Do the Top Ten Trends Have for Beginners?
Used as a Research List, Not a Buy List
The trending searches leaderboard can help beginners quickly establish research subjects and avoid aimlessly searching among thousands of assets.
Used to Observe Changes in Market Narratives
If AI, semiconductors, and index ETFs appear consecutively over several trading days, it indicates that related themes may continue to attract market attention; if the list switches rapidly, it may reflect short-term sentiment and accelerated capital rotation.
Used to Cross-Verify Product Availability
For on-chain U.S. stocks and tokenized assets, trending searches are just the first step. Users also need to check trading buttons, prices, liquidity, quotes, networks, asset descriptions, and regional restrictions.
Used to Build One's Own Observation Framework
Trending assets can be categorized into indices, tech giants, semiconductors, cloud services, consumer platforms, and special event targets, and track price, trading volumes, news, and fundamental changes.
The Value of OKX Wallet: From Discovering Trending Searches to Trade Execution
The OKX Wallet U.S. stock page provides various observation dimensions such as trending searches leaderboard, trading volume leaderboard, market capitalization leaderboard, and price increase leaderboard. Users can first discover subjects of attention through the trending searches leaderboard, then switch to other leaderboards and asset details for verification.
For data analysis platform users, a reasonably effective usage process is:
- Discover market subjects of attention from the trending searches leaderboard;
- Check trading volume and market capitalization, confirm capital and asset scale;
- Compare 24-hour price fluctuations, identify strong, weak, and highly volatile assets;
- Review company fundamentals, earnings reports, industry positioning, and recent news;
- Verify mapping, liquidity, and tradable regions of tokenized assets;
- Before trading, confirm quotes, slippage, network, and fees;
- Start with small amounts, and do not blindly increase positions based on trending search rankings.
Conclusion
On November 9, 2026, the OKX Wallet trending top ten shows that market attention is primarily focused on Apple, Nvidia, Microsoft, Google, Amazon, index ETFs, TSMC, and SpaceX-related items.
Among them, Apple ranks first, Nvidia, while trending second, has seen a 4.83% drop on the day, Microsoft, Google, Amazon, and TSMC have slightly increased, with VTIx rising by 1.39%, while SPCX and SPCXx need to be strictly differentiated.
This leaderboard tells us not "which stock will definitely rise," but rather which directions the current market is focusing on:
AI and tech giants remain the main line, index ETFs provide diversified observation, semiconductors represent industry chain prosperity, and special assets bring higher information and liquidity risks.
Exclusive Benefits for AiCoin Users
Use OKX Web3 Wallet to "Invest in Assets Worldwide"!
Bind invitation code 【AICOIN88】 to enjoy a 20% trading cost saving (Gas optimization and other benefits)!
Download/upgrade OKX Web3 Wallet now to catch the trend:
https://jump.do/xlink?checkProxy=true&proxyId=24
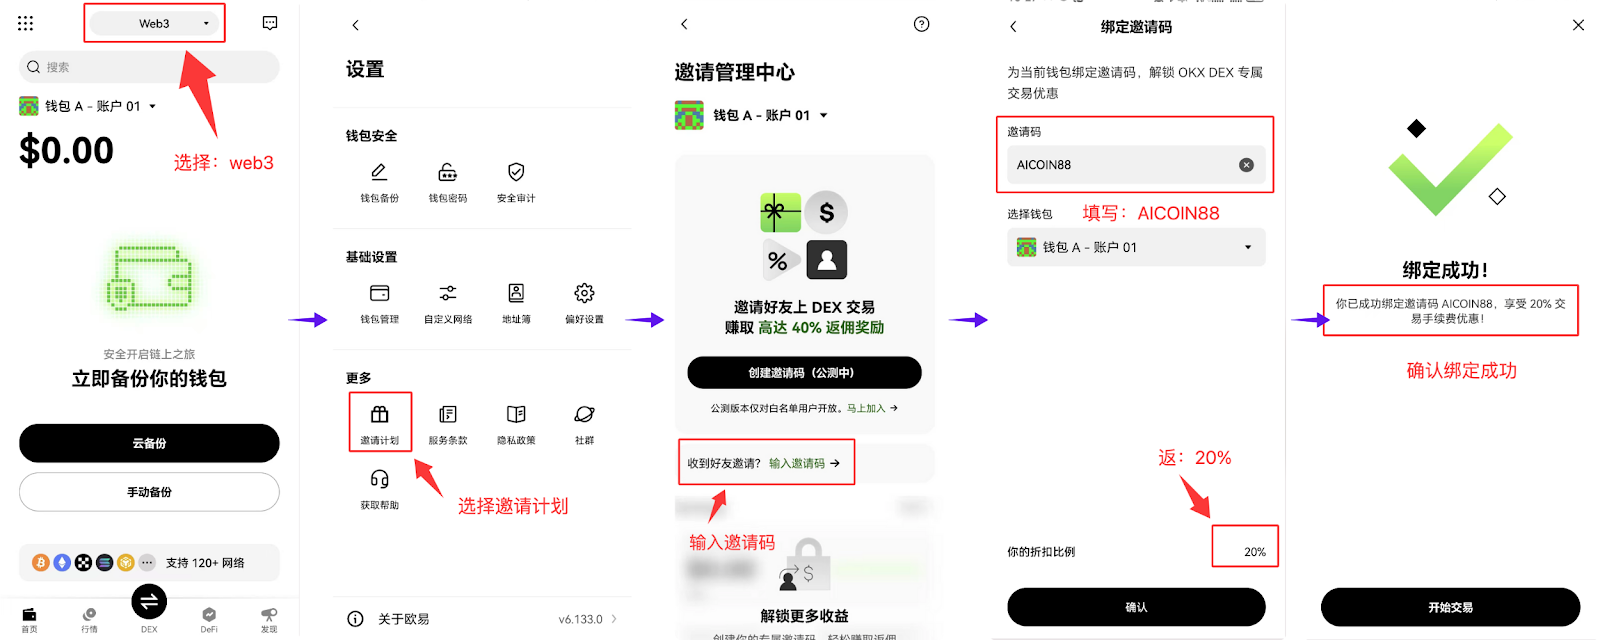
Use exclusive invitation code 【AICOIN88】 to bind OKX Wallet, operation is convenient on the web as well!
https://web3.okx.com/ul/joindex?ref=AICOIN88
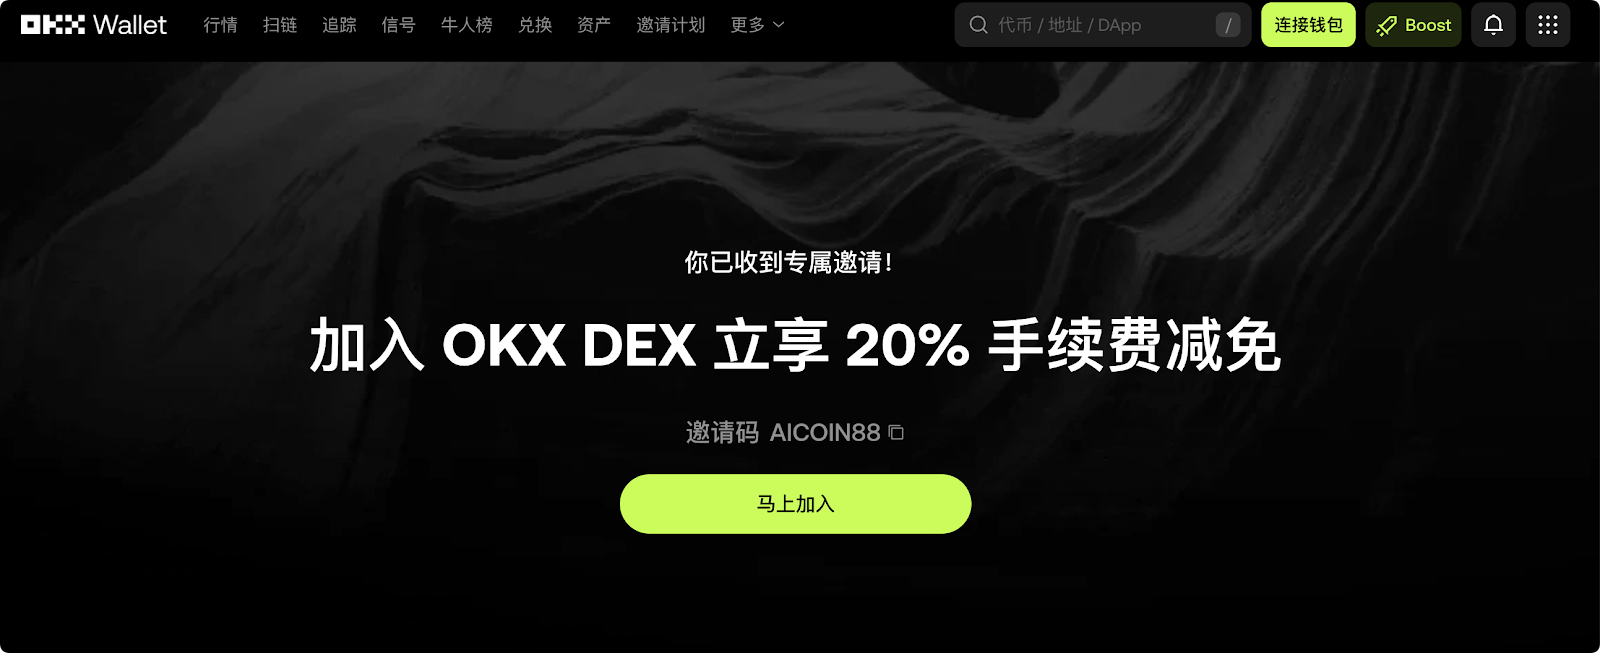
Don’t wait, set up OKX Wallet, bind the offers, and gain new wealth!
免责声明:本文章仅代表作者个人观点,不代表本平台的立场和观点。本文章仅供信息分享,不构成对任何人的任何投资建议。用户与作者之间的任何争议,与本平台无关。如网页中刊载的文章或图片涉及侵权,请提供相关的权利证明和身份证明发送邮件到[email protected],本平台相关工作人员将会进行核查。