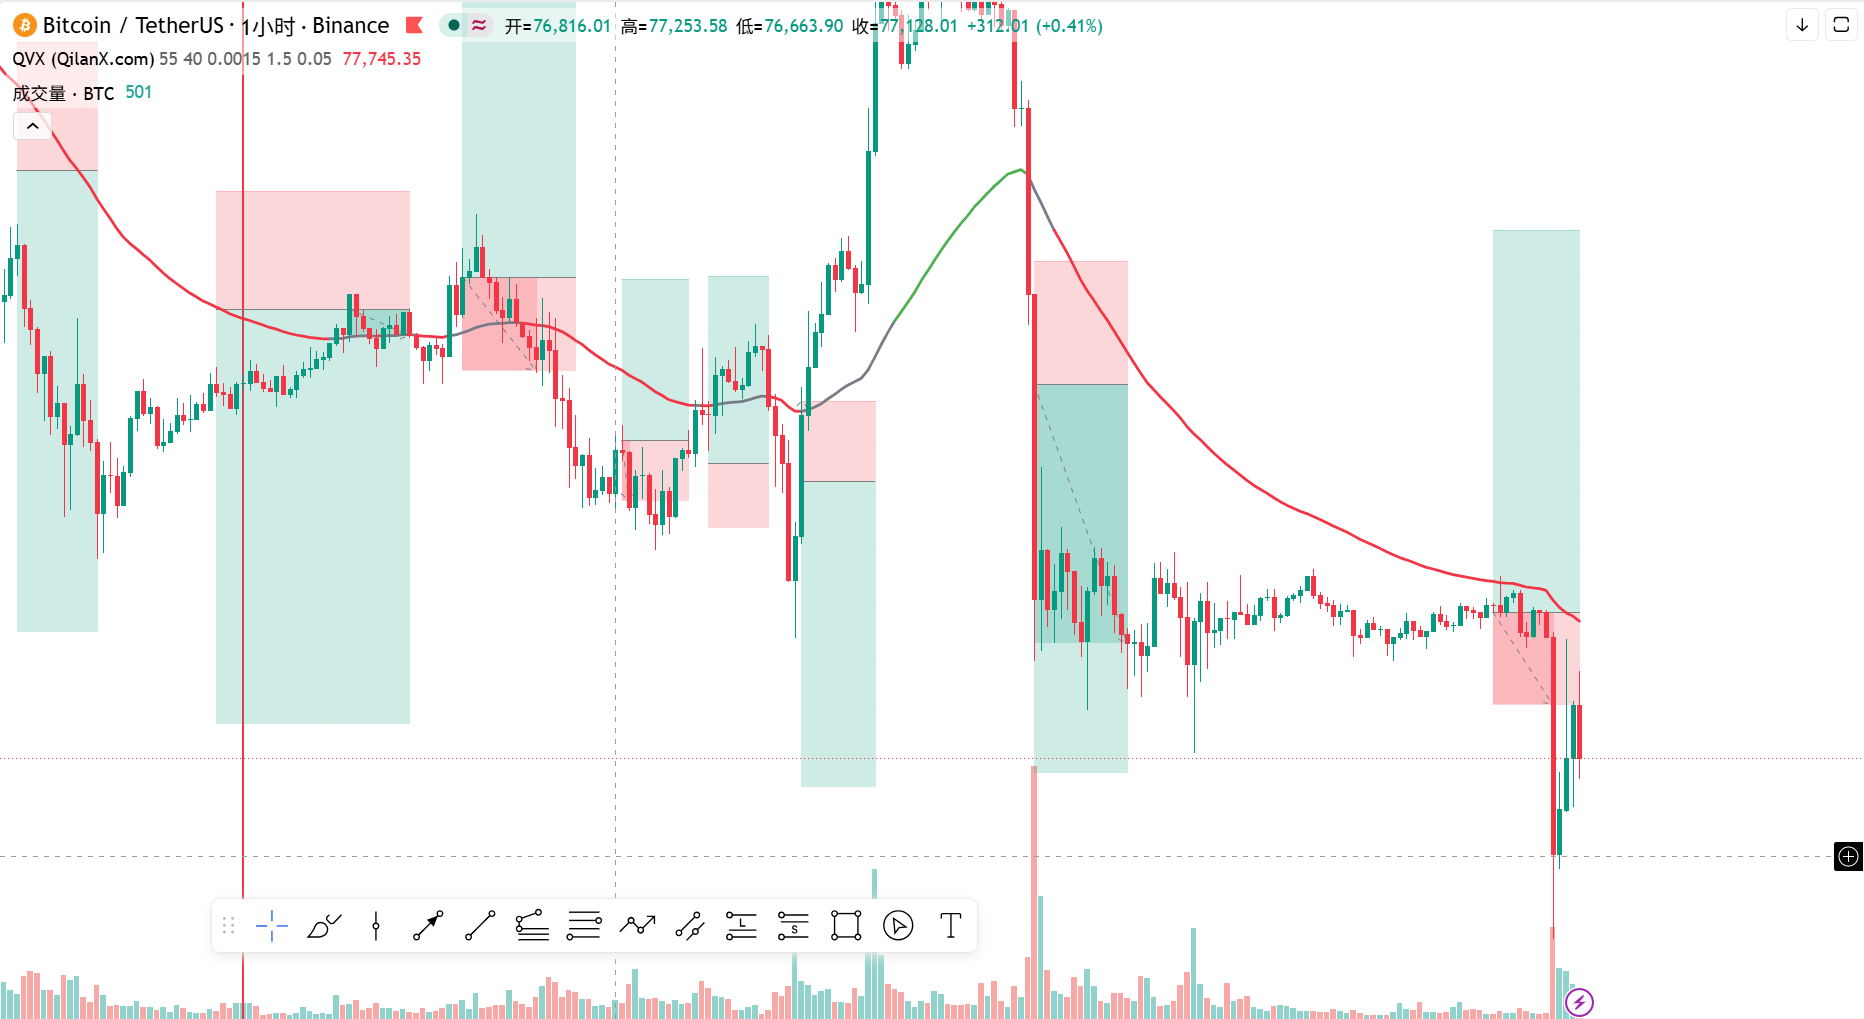
This morning's market likely woke many teammates up with mobile push notifications. Bitcoin experienced a flash crash down to 73510 USDT, with over 715 million long positions liquidated within an hour, high-leverage longs were almost completely washed out, and ETH/BTC simultaneously hit a new low, causing market sentiment to drop to freezing point. Adding to the headache is the macro situation, where the probability of a 25 basis point rate hike by the Federal Reserve in December has already risen to 77%, and expectations for tighter liquidity are again being imposed, pressing down on the valuation ceiling for risk assets. With these two pieces of news combined, the short-term outlook is a classic negative resonance.
However, sister Qinglan wants to remind everyone not to look only at the bearish side. On Hyperliquid, the BTC short positions held by whales have piled up close to 900 million USD, reaching a new high since October 2025, indicating extreme crowding among shorts. Once the price starts to rise, the short squeeze effect will be very intense. The Fear and Greed Index is at 29, indicating that the market is in a state of fear, with the funding rate returning to neutral, suggesting that long leverage has been largely washed out, leaving the remaining chips cleaner. Therefore, the core issue now is not "whether it will drop," but "which side to stand on at this position."
Current Price and Time
Current time is November 09, 09:31, BTC price is 74729 USDT, with a 24-hour change of -1.05%, and BTC market share at 60.24%. The market share remains high, indicating that capital is seeking refuge in Bitcoin, while altcoins face greater pressure, which also explains why ETH/BTC is hitting new lows.
Multi-Cycle Status Overview
First, looking at the daily chart. Daily MA5 = 75476.09, MA10 = 76809.03, MA30 = 79883.51, the moving averages are in a bearish arrangement, with the price below all moving averages. The daily MACD shows DIF = -1731.05, DEA = -1365.72, and the histogram = -365.34, remaining under water and still negative, with daily RSI = 34.24, approaching oversold but not at extremes. The daily characterization: low area within a bearish trend, any rebound is a repair, not a reversal.
Next, looking at the 4-hour chart. 4-hour MA5 = 75512.94, MA10 = 75688.91, MA30 = 76910.98, also in a bearish arrangement. The 4-hour MACD has just formed a death cross below the zero axis, with DIF = -592.14, DEA = -552.52, and the histogram = -39.62, showing weak momentum. But note that the 4-hour RSI is only 24.72, already in the oversold area, which means the downward pressure at the 4-hour level is narrowing, and a technical rebound may occur at any time.
The 1-hour chart is the core for today. 1-hour MA5 = 74684.93, MA10 = 75257.49, MA30 = 75673.20, the price of 74729 is just above MA5 but still below MA10 and MA30. The 1-hour MACD shows DIF = -275.60, DEA = -160.18, and the histogram = -115.42, indicating that short momentum is still present, but the histogram is not continuing to enlarge. The 1-hour RSI is at 34.83, showing a slight rebound from the low. Most importantly, the 1-hour EMA55 = 75708.44, and the current price is still 1.29% below it, placing the price below EMA55.
At the 15-minute level, MA5 = 74958.12, MA10 = 75003.10, MA30 = 75301.17, the price is below the 15-minute moving averages. The 15-minute MACD shows DIF = -192.02, DEA = -209.47, and the histogram = 17.45, which has turned positive, indicating short-term repair momentum. The 15-minute RSI is at 54.01, leaning towards neutral but warm. The short-term is trying to stabilize, but the strength is limited.
TPV Signal Verification
According to sister Qinglan's TPV system rules, one by one comparison. In terms of trend positioning, the current price of 74729 is less than the 1-hour EMA55 of 75708.44, clearly placed in a bearish trend area, which is indisputable.
Conditions for going long: First, the price must stabilize above the 1-hour EMA55 and require two consecutive 1-hour closing prices above EMA55, while the current price is 1.29% below EMA55, which does not meet this condition. Second, a support stabilization pattern, after the sharp drop to 73510, quickly recovered, there is a long lower shadow, but further confirmation with subsequent candlesticks is needed. Third, fading downward momentum, although the 1-hour MACD histogram is negative, the contraction signs are not obvious, and the RSI has rebounded from low but is still at 34.83, and no bullish engulfing pattern has appeared. Only half of the three conditions have been met, so the conditions for going long are not established.
Conditions for going short: First, the price is under pressure below the 1-hour EMA55, with two consecutive 1-hour closing prices below EMA55, which is satisfied. Second, a pressure blockage pattern: the price rebounded to around 75000 and couldn't push higher, with the 15-minute MA30 at 75301 acting as resistance, showing signs of an upper shadow. Third, rebound weakness, with the 1-hour MACD histogram still negative, and the RSI at 34.83 is not back to the strong zone, indicating a true lack of rebound momentum. The three items are basically satisfied, but note the 4-hour RSI has already reached 24.72, and the cost-effectiveness of chasing shorts is decreasing at this position.
For the oscillation judgment, in the past 8 hourly closing prices, the number above EMA55 is 3/8, breaking through once; the current price is 1.29% away from EMA55, which does not meet the oscillation threshold, and the system judges it to be in a one-sided trend. In other words, it is not a stage of horizontal grinding now, and the direction choice will arrive relatively quickly.
On-chain/Funding Situation
The Fear and Greed Index is at 29, indicating fear. Historically, this position has often been an area for phased layout, but not a zone for bulk buying. BTC market share at 60.24% remains high, indicating obvious capital risk aversion. The funding rate returning to neutral implies that both long and short leverage are not extreme, which is actually a good sign, as the market does not have obvious one-sided crowded premiums. What is truly noteworthy is the nearly 900 million USD shorts by whales on Hyperliquid, which is a double-edged sword hanging overhead: if the price doesn’t rise, the shorts continue to press down; if the price climbs past a key point, a squeeze can happen very quickly.
Key Offensive and Defensive Positions
The first defense above is the 1-hour EMA55 at 75708, which is the demarcation line of the TPV system and the most important observation point today. If the price cannot hold above it, the short structure remains unchanged; once it rises above it and closes two consecutive hourly candles above, only then can we talk about a trend reversal. Further up are the 1-hour MA30 at 75673 and the 4-hour MA5 at 75512, which are densely packed between 75500 and 75700, forming a pressure zone.
For support below, the first is the low point of the sharp drop to 73510, which is the last defense for the longs; falling below it means the washing hasn't ended yet. The second is the psychological support at 74000. Below that is around 73000.
Trading Ideas
Direction: Currently, the TPV system determines it to be in a bearish trend area, the main idea is to short on rebounds, but not to chase shorts. Because of the 4-hour RSI being oversold and the shorts being extremely crowded, chasing shorts risks hitting a short squeeze rebound.
Entry Conditions: For going short, the price needs to rebound to the pressure zone between 75500 and 75700, which is near the 1-hour EMA55, showing a long upper shadow or a 15-minute top formation, while the 1-hour MACD histogram doesn't continue to shorten, only then consider entry. For going long, it must wait for the price to close above 75708 with two consecutive hourly candles and to retrace without breaking this level, only then does it meet the TPV long condition, at which time you can take a small position to bet on a short squeeze.
Stop Loss: For going short, place the stop-loss above 76200, which is about 0.6% above EMA55, to prevent false breakouts. For going long, set the stop loss below 74500; if it breaks below the low point of the morning, it’s a wrong call.
Target Position: For shorts, the first target is 74000, the second target is 73510, and if it breaks below this, look towards 73000. For longs, the first target is 76500, the second target is 77200, near the daily MA10.
Risk Warning
In one sentence: Interest rate hike expectations and whale shorts are squeezing from both sides, a market change may happen at any time, strictly carry stop-losses, and don’t use leverage to bet on direction.
Follow the Qinglan Crypto Classroom to seize more trading opportunities! Welcome to visit the official website www.qinglan.org
📊 Qinglan TPV Trading Strategy Backtesting Reference
🕒 Last Backtest Time 11-09 07:00:02
Total Analysis: 4986 Backtested: 4976 Accuracy Rate: 75.8% (3771/4976)
免责声明:本文章仅代表作者个人观点,不代表本平台的立场和观点。本文章仅供信息分享,不构成对任何人的任何投资建议。用户与作者之间的任何争议,与本平台无关。如网页中刊载的文章或图片涉及侵权,请提供相关的权利证明和身份证明发送邮件到[email protected],本平台相关工作人员将会进行核查。