Today BTC closed at 75999, down from 87385, pausing for the first time at this level to catch its breath.
The daily candlestick chart looks a bit bad: the price has already broken below EMA15 at 78006, EMA90 at 78030, and EMA120 at 77702. The MACD green bars are still expanding, and the bearish momentum has not yet been fully released. The BOLL middle line at 79116 is a wall above, while the lower line at 74215 is the floor below. The TD sell count has reached 4, indicating that the correction is likely not yet finished.
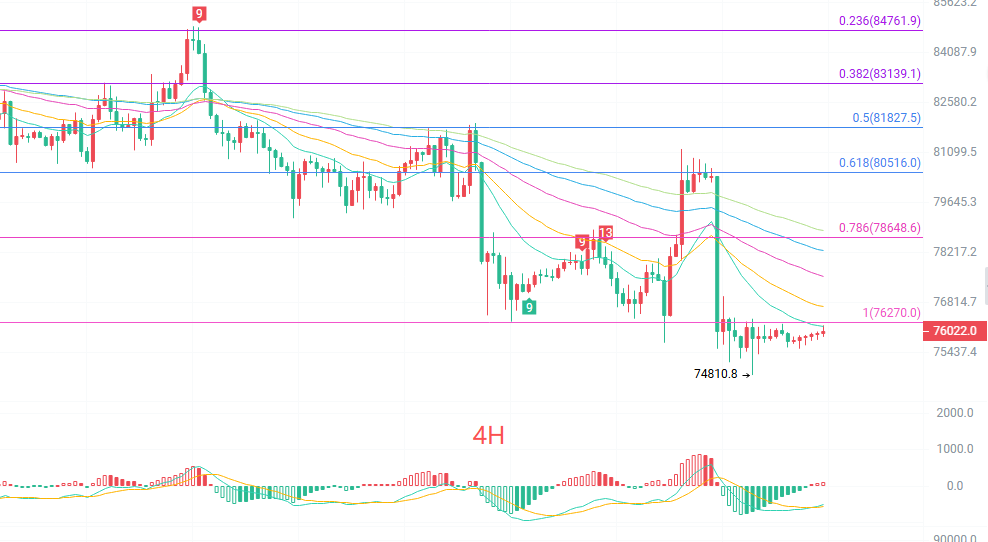
The four-hour candlestick chart is slightly easing: after being pulled up from 74810, it has been sideways for two days. The MACD green bars are converging, just turning into small red bars, and DIF is about to cross above DEA. However, the price is still pressed below EMA15 at 76160 and EMA30 at 76693, belonging to a stage where it cannot fall further or rise, a tug-of-war phase.
Personal observation, not advice:
Try long: stabilize with light positions at 75300—75500 on a pullback, stop loss below 74500, target 76600-77200
Try short: stabilize with light positions at 76600—76800 on a rebound, stop loss above 77300, target 75500-74800
Position not exceeding 20%, if wrong, accept it
The market does not believe something is cheap, only recognizes patterns and stop losses. Profit and loss are self-responsible, follow me for daily reviews together.
免责声明:本文章仅代表作者个人观点,不代表本平台的立场和观点。本文章仅供信息分享,不构成对任何人的任何投资建议。用户与作者之间的任何争议,与本平台无关。如网页中刊载的文章或图片涉及侵权,请提供相关的权利证明和身份证明发送邮件到[email protected],本平台相关工作人员将会进行核查。