Crypto Circle Academician: November 8 Ethereum (ETH) daily candlestick cross star + 4-hour bearish arrangement: At this position of 2239, both sides are waiting for the other to make the first move.
What I actually want to say at the beginning is: the essence of trading is not prediction, but response. At this position of 2239, neither side has an absolute win rate; it’s a contest of whose stop loss is smaller, whose position is lighter, and whose patience is greater. I will update the movements of key positions and structural evolution daily in my friend circle, without drawing big pies or showing multiple earnings; I will only synchronize the signals of multi-cycle resonance and TD counting. This method cannot make you wealthy overnight, but it can place you in the candidate seat for "one profit" in this market of 70% losses, 20% breaks even, and 10% profits. The above is a personal technical review note, not investment advice, and please ensure that the contract leverage is controlled within a range you can withstand liquidation.
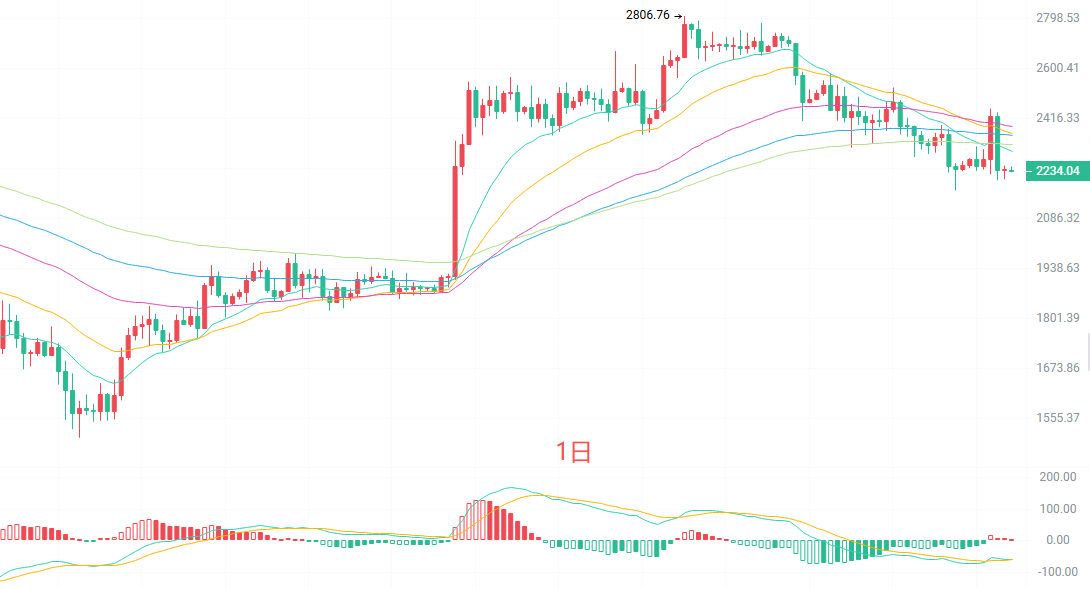
The daily candlestick shows a typical cross star after a decline with shrinking volume. Structurally, the price has broken below the EMA15 and the middle band of the Bollinger Bands at 2325, but the EMA120 report at 2326 is still slowly rising, indicating that the mid-term bullishness is not completely extinguished. The MACD here is just below the zero line and has just turned weakly upwards, which is not a reversal signal. The upper pressure zone at 2325—2362 is a dense area of entrapment, while the lower Bollinger Bands lower line at 2174 and the previous low of 2172 are the last line of defense for bulls. The daily level is currently in a conflict between a bearish continuation and the budding of a double bottom, requiring a volume-increasing bullish candlestick to provide falsification.
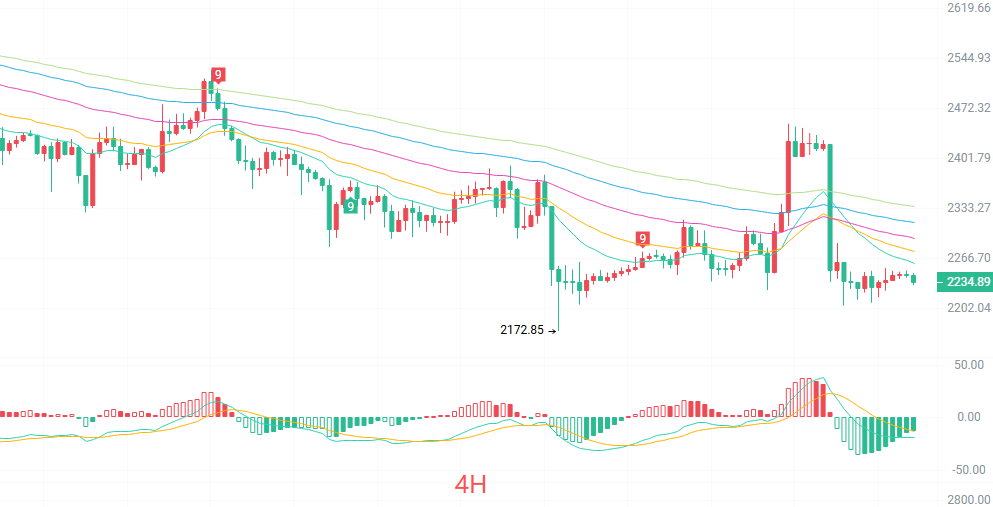
The four-hour candlestick rebounded to 2430 and then fell back again, currently hovering at 2239. The price is positioned below the EMA15, and the short-term moving averages EMA30/60/90/120 are all in a bearish arrangement diverging downward, which is a standard downward trend structure. It is worth noting that the MACD corresponding to the rebound high point of 2430 did not synchronize to a new high, forming a hidden top divergence, indicating that the upward momentum has already weakened. The Bollinger Bands are narrowing, and the middle line of 2298 has turned from support to pressure; it’s now in a weak oscillating bearish pattern.
Short-term reference:
Going north from 2210 to 2180 met with resistance, stop-loss 30 points, target looking at 2300 to 2350.
Going south from 2270 to 2300 is stagnant, stop-loss 30 points, target looking at 2240 to 2190.
Specific operations should be based on real-time market data; for more information, you can consult the author. The article release has a delay, and suggestions are for reference only; risk is to be borne personally.
Warm reminder: The above content is updated synchronously by the crypto circle academician on major trading platforms such as Binance, OKEx, Huobi, etc. More content can be found by adding me as a friend in Binance OKEx and joining my fan group.
免责声明:本文章仅代表作者个人观点,不代表本平台的立场和观点。本文章仅供信息分享,不构成对任何人的任何投资建议。用户与作者之间的任何争议,与本平台无关。如网页中刊载的文章或图片涉及侵权,请提供相关的权利证明和身份证明发送邮件到[email protected],本平台相关工作人员将会进行核查。