Crypto Circle Academician: The most cruel part of the drop to 11.8 Bitcoin (BTC) is that it doesn't give you a chance to rebound and exit.
The effectiveness of technical analysis comes from consistency, not win rate. All parameters in this article come from the real-time reading of the current candlestick. If any indicator like TD sequence, EMA, MACD, or BOLL fails, the framework becomes invalid immediately. Trading is a game of probability, and stop-loss is the only variable you can control. The above is personal research notes and does not constitute investment advice. Please make independent decisions regarding high leverage contracts. If this framework has reference value for you, feel free to follow, and I will share updates at the first moment during the next dual-cycle resonance.
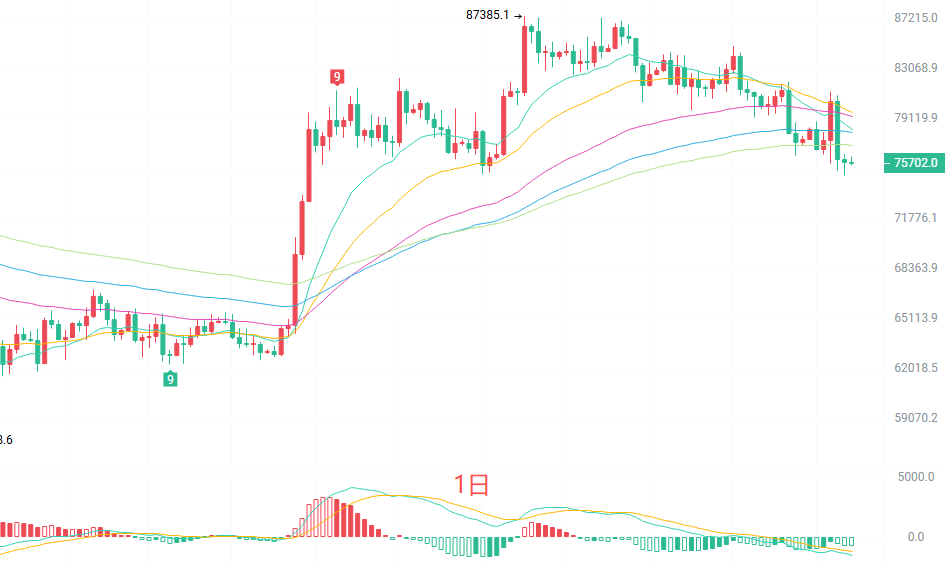
The daily candlestick has broken below all five EMA moving averages and is showing a bearish arrangement, with the short period at the bottom and the long period at the top, which is the weakest structure. The green bars on the MACD are still expanding, indicating that the downward momentum has not exhausted. The middle line of the Bollinger Bands at 79407 has turned into resistance, while the lower line at 74570 is the only support below. The TD countdown has reached the third count, and the daily-level adjustment is not yet complete.
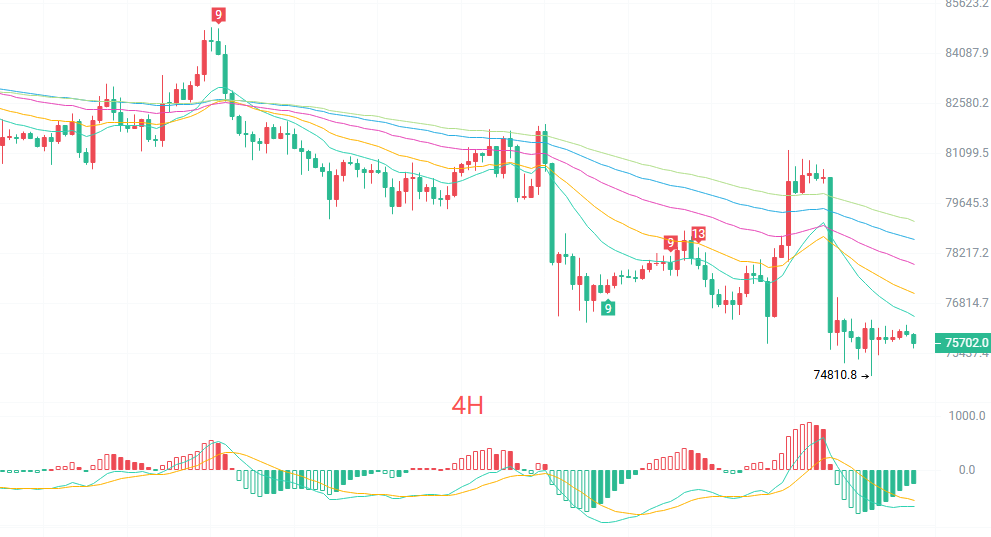
The four-hour candlestick on November 5 shows a large bearish candle that dropped directly from 78500 to 74810. Subsequently, three candlesticks consolidated with decreasing volume around 75700, and even the EMA15 reported at 76465 could not recover. This kind of sharp drop without a rebound typically indicates a continuation of the downtrend rather than a bottoming out. Moving averages are also arranged bearishly, with EMA30, 60, and 90 exerting layer upon layer of pressure. The MACD continues to open downward below the zero axis, with short-term bears still dominating. The Bollinger Bands are opening downward, with the middle line at 77374 being the short-term watershed for bulls and bears, and the lower line at 73342 being the target in extreme cases.
Short-term reference:
Northbound resistance at 75200 to 74700, with a stop-loss of 500 points, targeting 77000 to 78500.
Southbound stagnation from 78500 to 79000, with a stop-loss of 500 points, targeting 77500 to 76500.
Specific operations are based on real-time market data. For more information, you can contact the author. The publication of this article may have a delay; the advice is for reference only, and risk is borne by you.
Friendly reminder: The above content is synchronized updates from Crypto Circle Academician on major trading platforms such as Binance, Okex, Huobi, etc. For more content, you can add me as a friend in Binance Okex to join my fan group.
免责声明:本文章仅代表作者个人观点,不代表本平台的立场和观点。本文章仅供信息分享,不构成对任何人的任何投资建议。用户与作者之间的任何争议,与本平台无关。如网页中刊载的文章或图片涉及侵权,请提供相关的权利证明和身份证明发送邮件到[email protected],本平台相关工作人员将会进行核查。