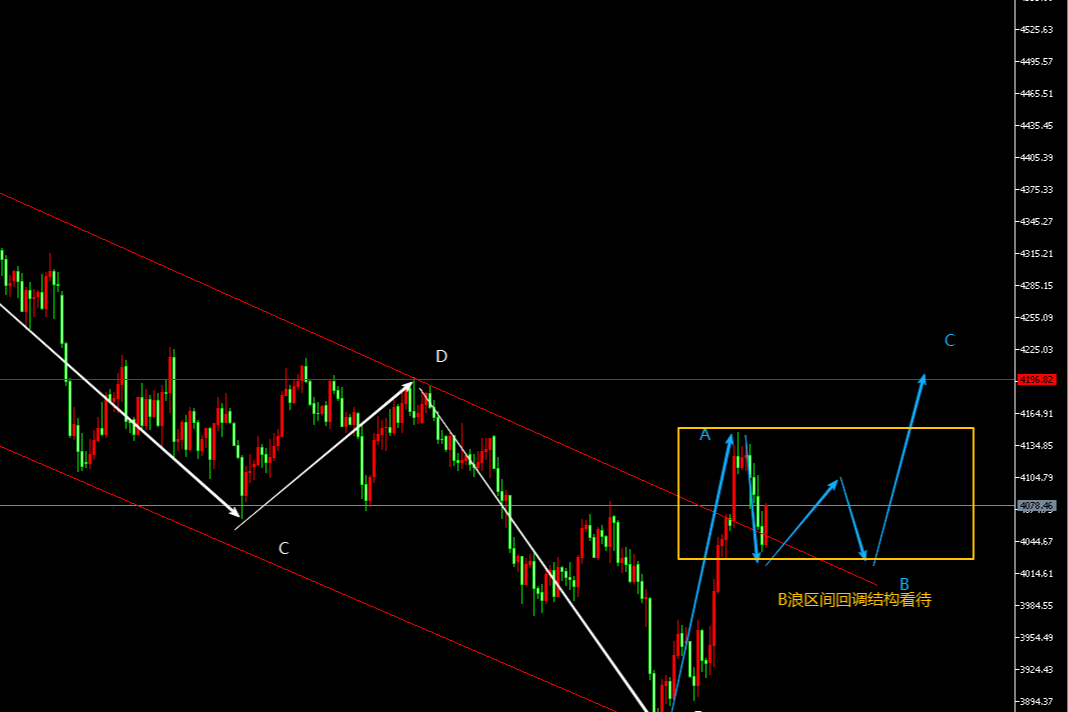
Cryptocurrency Scholar: 11.7 Ethereum (ETH) Multi-Cycle Resonance Breakdown: Daily Oversold, 4H Death Cross, Two Trigger Conditions Under Cycle Misalignment
The daily line is adjusting structurally after the main upward wave that retreated from the 2806 high point, and the 4-hour cycle has just completed a short-term death cross confirmation. This account does not provide any investment advice; it only uses the EMA moving average system, MACD momentum, Bollinger Bands, TD sequences, and previous highs and lows to structurally analyze price behavior. By following this account, you will gain access to: daily K-line and 4H dual cycle moving average bullish and bearish arrangement readings, MACD histogram contraction and expansion momentum switches, Bollinger Band convergence and opening volatility states, as well as key trigger conditions based on previous lows and highs and EMA resonance levels. Technical analysis is a probabilistic tool, not a crystal ball.
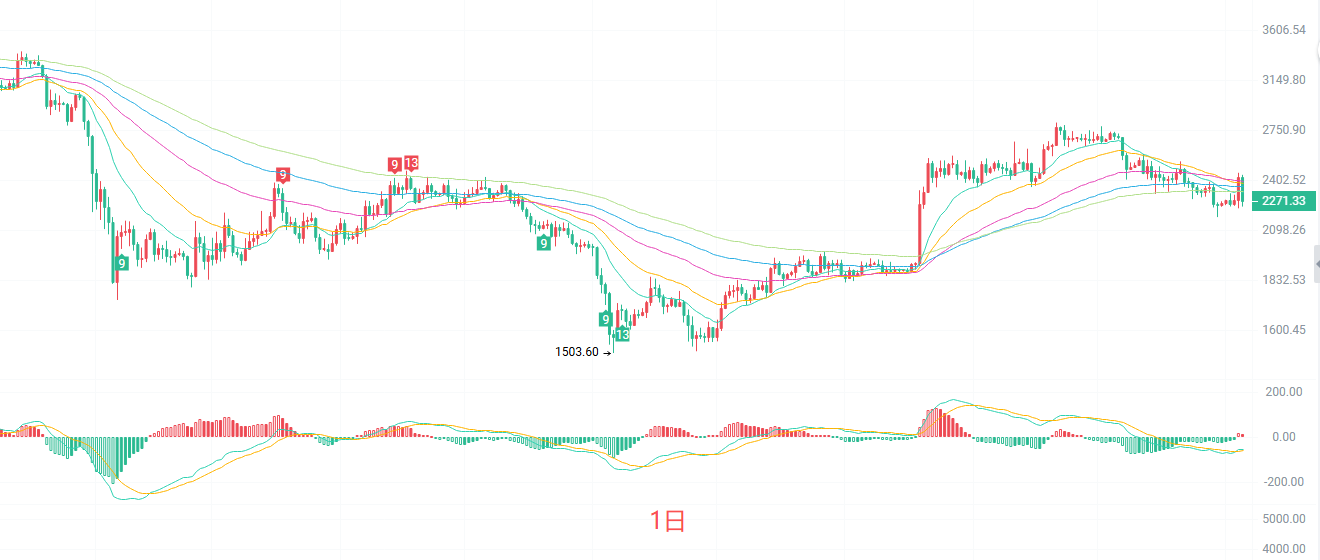
There are several hard facts regarding the daily K-line: First, the current price of 2217 is below the EMA, the moving averages are in a bearish arrangement, and the medium to short-term trend is still downward. Second, the MACD histogram has just turned from green to red, indicating a preliminary signal of declining momentum, but the two lines remain significantly below the zero axis, so a reversal cannot be discussed. Third, the lower Bollinger Band is at 2180, and the current price is right at the lower band, indicating short-term oversold conditions, but the lower band itself is not a bottom.
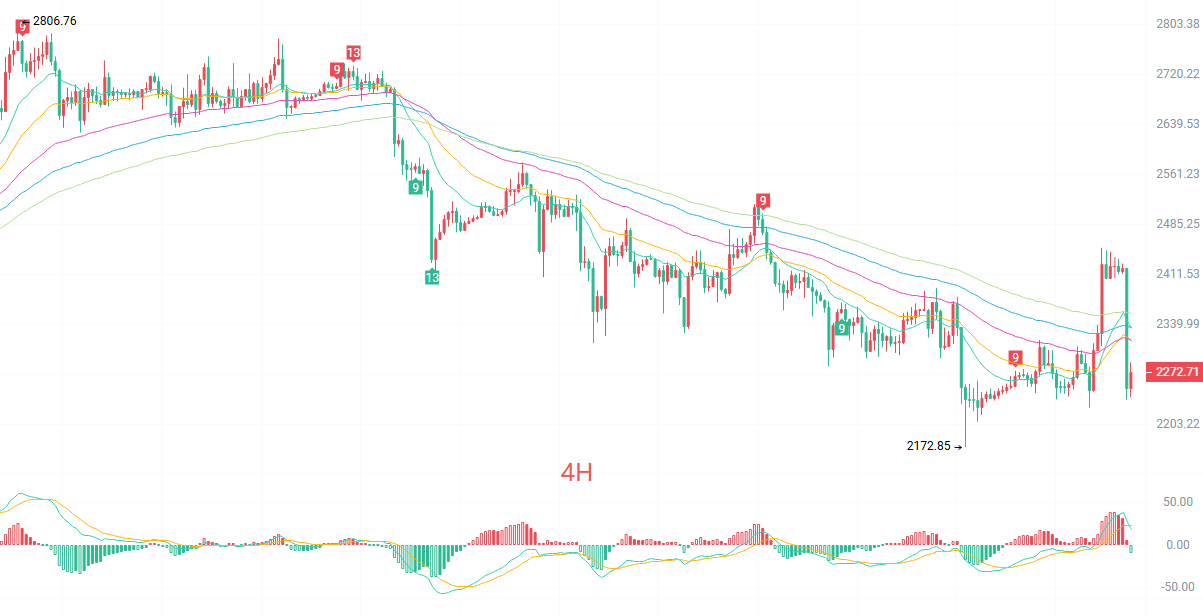
The 4-hour K-line structure is weaker than the daily line; EMA15 is at 2276, EMA30 is at 2288, and EMA60 is at 2302, all pressing down from above, and they are in a bearish arrangement. The key change is in the MACD: DIF has just crossed below DEA, and the histogram is expanding, indicating a newly formed death cross, which means the short-term still needs to seek a downward balance. The lower Bollinger Band is at 2152, and the recent low of 2172 is the last line of defense. In other words, the current formation is a continuation of a downward trend, not a bottoming formation.
Short-term reference:
Going north from 2220 to 2190 faces resistance, stop loss at 30 points, target at 2300 to 2350.
Going south from 2190 to 2170 is stagnant, stop loss at 30 points, target at 2240 to 2190.
Specific operations should be based on real-time market data. For more detailed information, you can consult the author; the article publication may have delays, and suggestions are for reference only, with risks borne by the reader.
Warm reminder: The above content is simultaneously updated on major trading platforms such as Binance, OKEx, Huobi, and others. For more content, you can add me as a friend and join my fan group in Binance and OKEx.
免责声明:本文章仅代表作者个人观点,不代表本平台的立场和观点。本文章仅供信息分享,不构成对任何人的任何投资建议。用户与作者之间的任何争议,与本平台无关。如网页中刊载的文章或图片涉及侵权,请提供相关的权利证明和身份证明发送邮件到[email protected],本平台相关工作人员将会进行核查。