Cryptocurrency Academician: 11.7 Bitcoin (BTC) When the K-line stops speaking, indicators begin to voice it, 4 overlooked micro signals
When I wrote this, it was late at night, and Bitcoin had been consolidating for a whole month after surging above 87000 in October. It is now stuck at 75500, neither up nor down. Many people have started to panic these days: are we going back to 57000? I'll state the conclusion first—this is not a collapse; this is a normal pullback after a significant rise. However, whether this pullback can hold will determine whether the next phase will follow a trend or fluctuate. I keep a close eye on the daily K-line and 4H chart every day, jotting down key levels, triggering conditions, and stop-loss logic as notes to share here. Follow me, and you won't be regretful during this upcoming swing between bulls and bears.
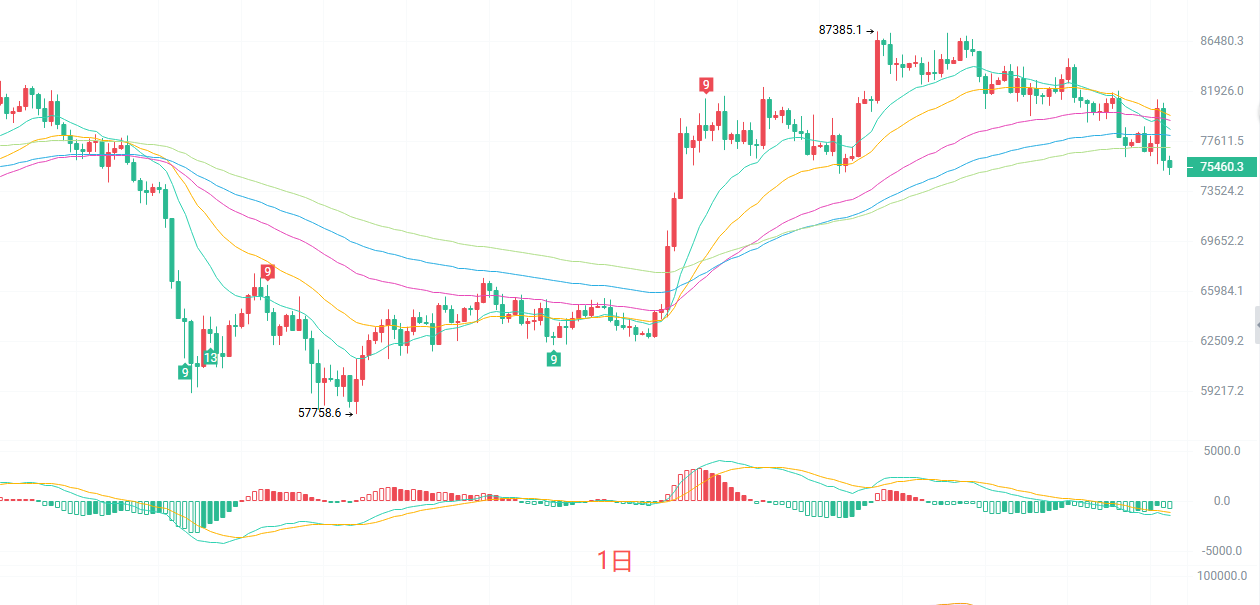
The daily K-line has slid down from the October high all the way below all EMAs: EMA15 at 78606, EMA30 at 79799, EMA60 at 79425, EMA90 at 78119, with short to medium-term moving averages forming a collective bearish arrangement, and the price is being pressed down below the cluster of moving averages. The MACD's green bars are still expanding, indicating that bearish momentum has not been fully released. The lower Bollinger Band at 74991 is currently the key defense line for the daily K-line; today's close happened right around this level, and whether it can hold will determine if next week will see a rebound or continued decline.
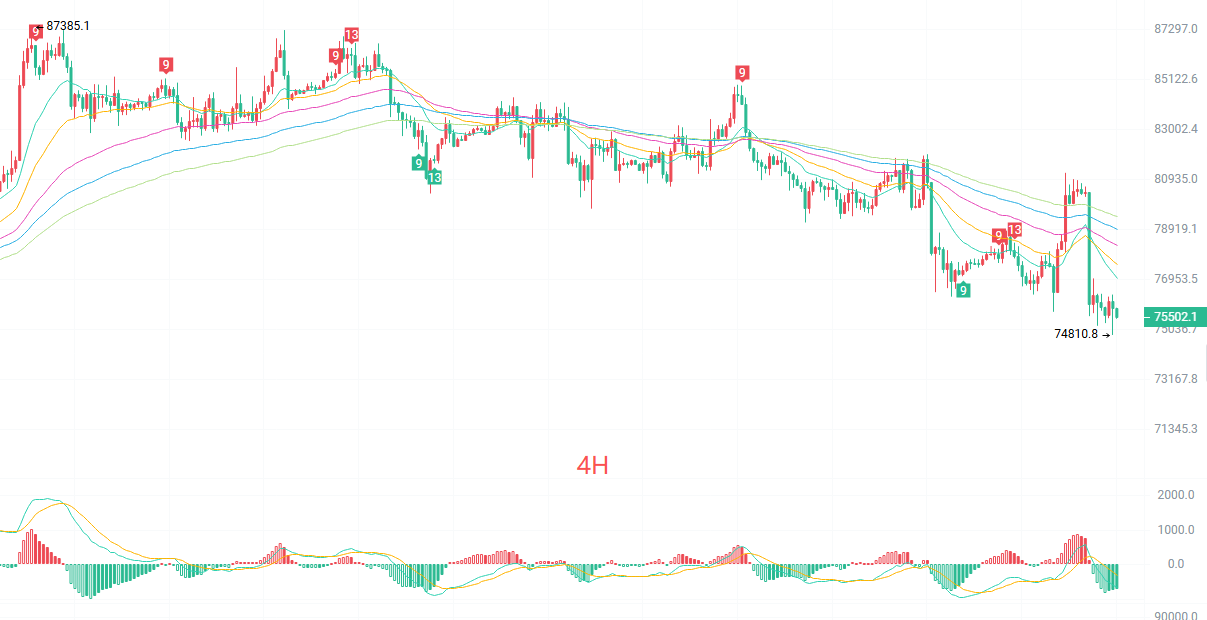
The four-hour K-line has been declining along the lower side of EMA15 and EMA30, with each rebound peak lower than the previous one. Currently at 75483, EMA15 is at 76974, and EMA30 is at 77532. As long as the rebound does not return above EMA15, the structural bearish sentiment remains intact. The MACD indicator's green bars have opened downwards again, with the lower Bollinger Band at 74004 serving as lower support compared to the daily K-line. The TD sequence has reached counts of 9 and 13, indicating a short-term technical rebound demand, but a rebound does not equal a reversal.
Short-term reference:
Bearish resistance at 75200 to 74700, with a stop loss of 500 points and a target of 77000 to 78500
Bearish stagnation at 78500 to 79000, with a stop loss of 500 points and a target of 77500 to 76500
Specific operations should primarily rely on real-time market data. For more detailed information, you can contact me. There may be delays in article publication, and the suggestions are for reference only; risks are to be borne by the individual.
Warm reminder: The above content is updated simultaneously by Cryptocurrency Academician on major trading platforms such as Binance, OKEx, Huobi, etc. More content can be found by adding me as a friend in the Binance OKEx fan group.
免责声明:本文章仅代表作者个人观点,不代表本平台的立场和观点。本文章仅供信息分享,不构成对任何人的任何投资建议。用户与作者之间的任何争议,与本平台无关。如网页中刊载的文章或图片涉及侵权,请提供相关的权利证明和身份证明发送邮件到[email protected],本平台相关工作人员将会进行核查。