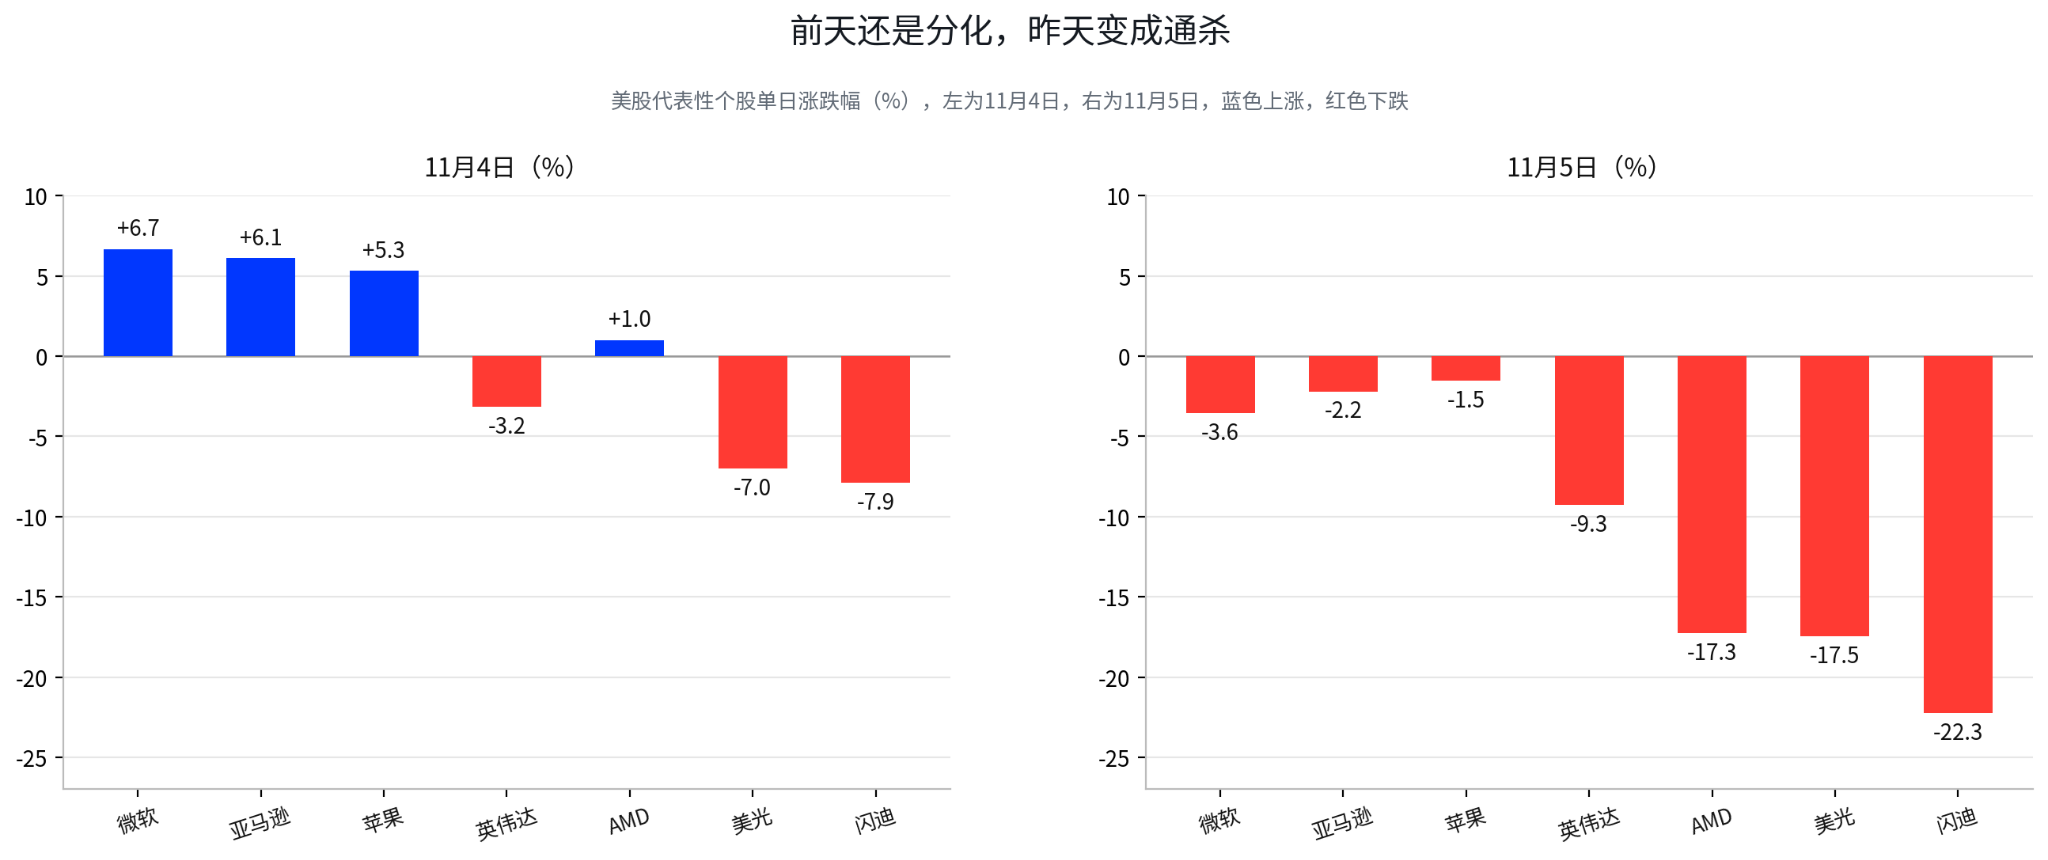
On November 5, U.S. stocks recorded the largest single-day decline since the tariff turmoil of April 2025. The Nasdaq Composite fell by 5.52%, the Nasdaq 100 dropped by about 6.4%, the S&P 500 fell by 4.35%, and the Philadelphia Semiconductor Index fell by 12%, marking its largest drop since 2020. Nvidia fell by 9.26%, AMD fell by 17.26%, SanDisk fell by 22.26%, and Micron fell by 17.46%. The Financial Times estimated that Wall Street lost about $3.2 trillion in market capitalization in one day, while the Wall Street Journal estimated around $2.5 trillion, with differing scopes in their assessments.
This drop indeed had new policy trigger factors: local referendums limiting data center construction in multiple U.S. locations gained a high approval rate, with exit polls showing that 76% of voters opposed the construction of data centers in their communities. Sanders then proposed an "immediate nationwide halt to data center construction". As of now, this remains a political statement and has not entered the legislative process in Congress.
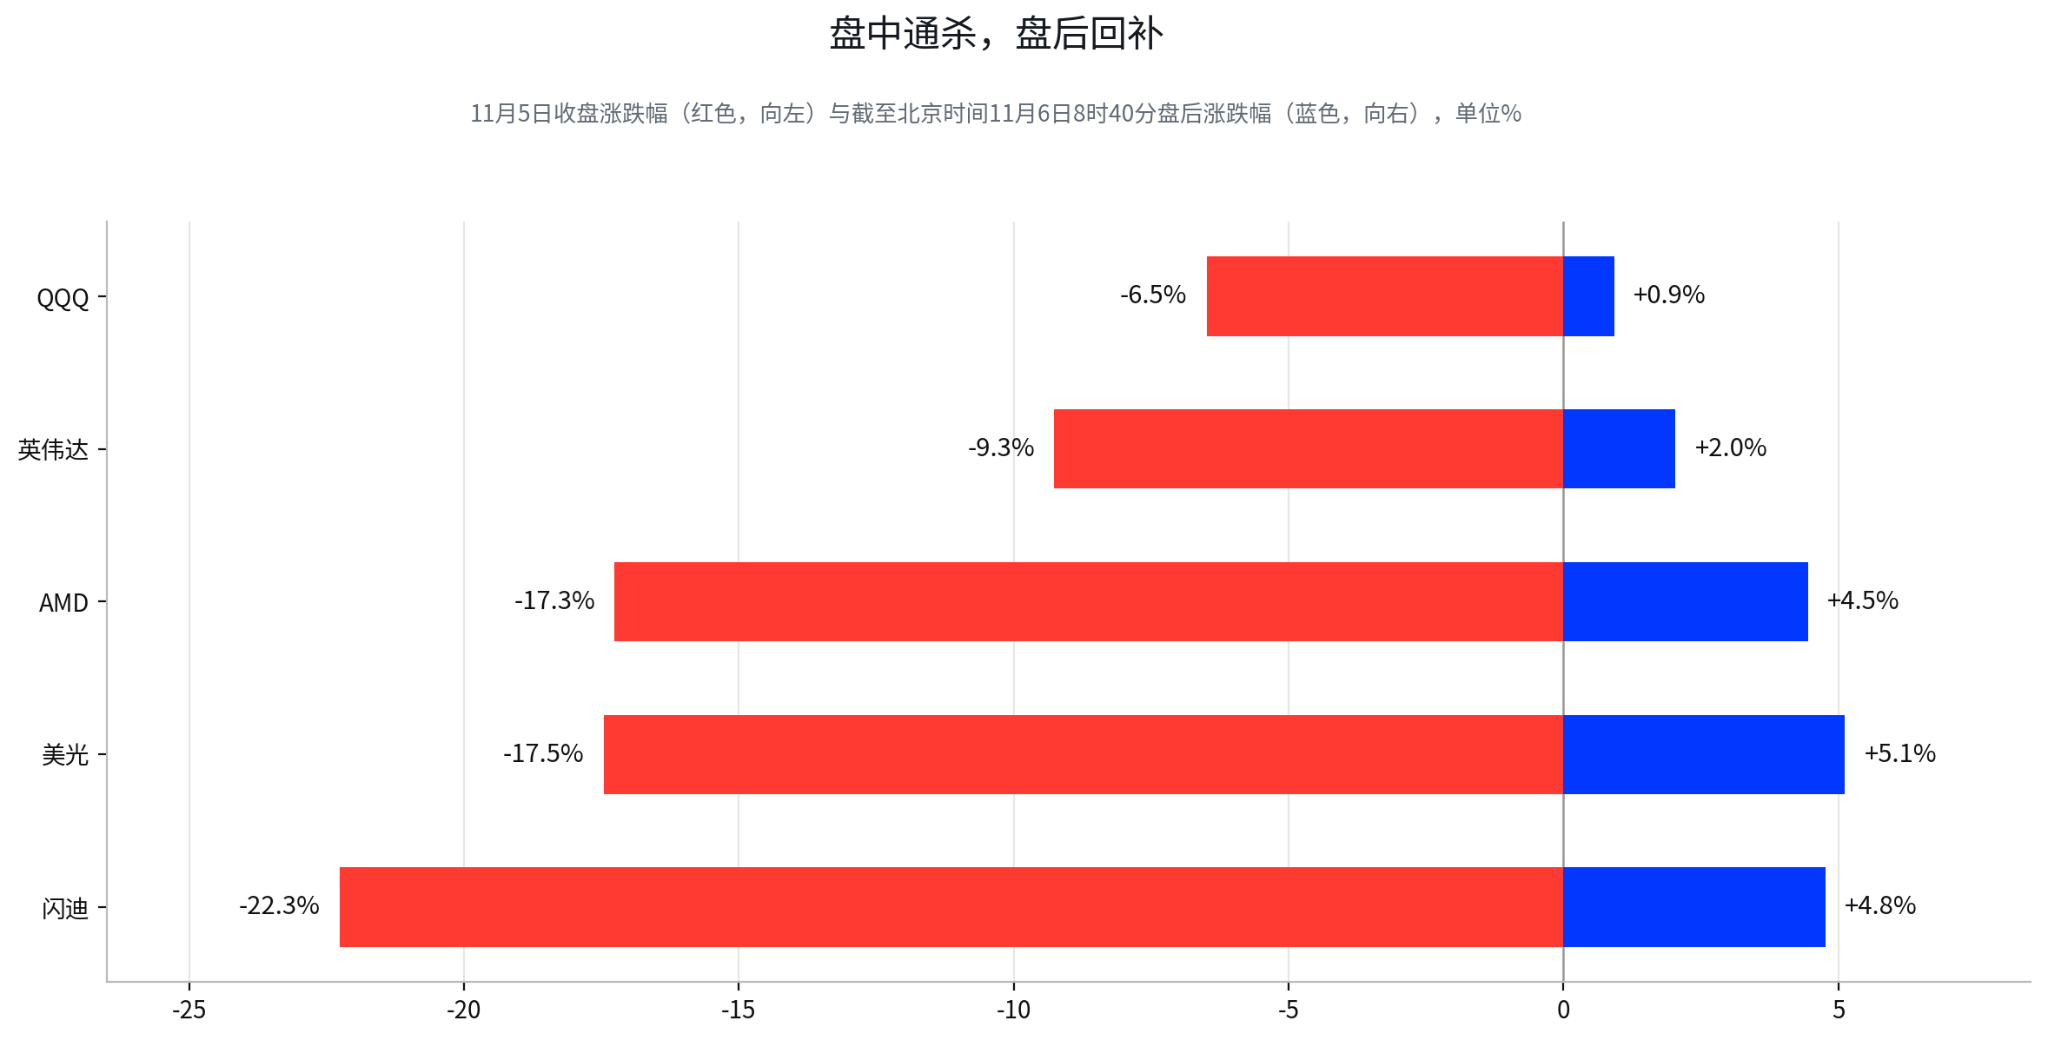
After-hours market quickly recovered. As of 8:40 AM Beijing time on November 6, Micron was up 5.1%, SanDisk was up 4.8%, AMD was up 4.4%, Nvidia was up 2.0%, QQQ rebounded by 0.93% relative to the close, and Nasdaq 100 futures turned up by about 0.4%.
In the midst of a broad sell-off and subsequent recovery, what the market is truly repricing is whether policy risk can transmit to data center capital expenditures; whether AI demand has disappeared is secondary.
1. From Divergence to Broad Sell-off: The Real Explosion is Overcrowded Positions
The policy news is simply a trigger; the impact comes from the expectations of capital expenditure and overcrowded positions accumulated over the past two years.
The drop on November 5 is difficult to explain merely by "the Democrats won". The day before, U.S. stocks in the AI chain were still showing significant divergence, with large tech platforms rising while AI hardware faced only a mild pullback. A day later, there was a comprehensive decline from GPUs, storage to optical communications and PCBs, with the seven sisters' market capitalization evaporating by over a trillion dollars (as reported).
Over the past year, AI hardware and data center construction have continually received orders, capital expenditures, and earnings verification, with trades in the storage supercycle and computing power leasing reinforcing each other. Once the market has priced AI infrastructure expectations very high, any variable that can slow down capital expenditures will trigger concentrated profit-taking. The local referendum on November 5 just happened to provide the market with a strong enough reason: data tracked by Redbud Consulting shows that out of 44 local measures restricting data centers across the U.S., 38 passed, with another media report counting 40 out of 41, with minor discrepancies. Exit polls indicated that 76% of voters opposed building data centers in their communities (as cited).
Sanders's statement thus needs precise positioning. On November 5, he posted on social media, citing local referendum results and calling for an "immediate nationwide halt to data center construction". This is a political proposition that has not been submitted to a committee, nor is there a bill text. What the market really needs to wait for is whether local opposition sentiment can make it into federal policy and then transmit to data center construction and cloud vendors' capital expenditures.
The current market is trading a chain that has not yet been completed:
Local opposition to data centers → Federal policy tightening → Data center construction slowing down → Cloud vendor capital expenditures revised down → AI hardware orders decreasing → Chip and storage earnings expectations revised down
The stock prices on November 5 jumped directly to the last step, while several intermediate links had not yet been confirmed. This round of decline resembles a concentrated deleveraging of a high valuation, high position AI trade; the market has not confirmed the end of the AI infrastructure cycle.
2. Storage Drops the Hardest, Market Cuts Those Orders Closest to Capital Expenditures
Storage’s drop is nearly twice that of core computing power; capital is first cutting the orders most sensitive to new capital expenditures.
Nvidia fell by 9.26%, but the real pullback was driven by storage. Micron dropped by 17.46%, SanDisk fell by 22.26%, Seagate fell by 17.35%, while Nvidia fell by 9.26% and AMD fell by 17.26% over the same period. This structure itself is a signal.
Data center capital expenditures will ultimately be transmitted through servers, GPUs, HBM, DRAM, NAND, and other links in the supply chain, with the earnings expectations of storage companies closely tied to new data center demand. Once the market begins to doubt the speed of future data center construction, the first orders to be adjusted will be those most sensitive to new capital expenditures, which also had the highest prior gains and position crowding.
Therefore, storage is dropping more sharply than GPUs; the interpretation is that capital is prioritizing the downward adjustment of the marginal increments to AI infrastructure, while AI demand itself has not been disproven. This is also the reason why November 5 cannot simply be defined as "the bursting of the AI bubble". If the market confirms that AI demand has collapsed completely, cloud vendors' capital expenditures, orders, and earnings expectations should all be revised down simultaneously; what is currently happening is merely that capital is cutting away part of the excessively optimistic capital expenditure assumptions through stock prices.
The after-hours rebound precisely illustrates this point. As of 8:40 AM Beijing time, Micron rose 5.1%, SanDisk rose 4.8%, AMD rose 4.4%, Nvidia rose 2.0%, and QQQ rebounded by 0.93%. Capital is recalculating the distance between political statements and genuine capital expenditure changes, and naturally, the stocks that fell the most earlier experience the first short covering and rebound from overselling.
The after-hours rebound itself does not prove a trend reversal. With lower liquidity after-hours, price fluctuations can be exaggerated, and truly valuable signals will have to wait until after the normal trading session opens on November 6: if GPUs stabilize first while storage continues to weaken, it indicates that capital is repricing internally within the supply chain. A synchronous rebound across the entire AI hardware chain is more akin to a rebound following panic deleveraging. If after-hours gains quickly disappear, it indicates that the deleveraging has not ended.
3. Hong Kong Stocks Rise for Platforms, Fall for Hardware
The divergence between Hong Kong stocks and U.S. stocks in AI hardware is actually two ends of the same rotation trade.
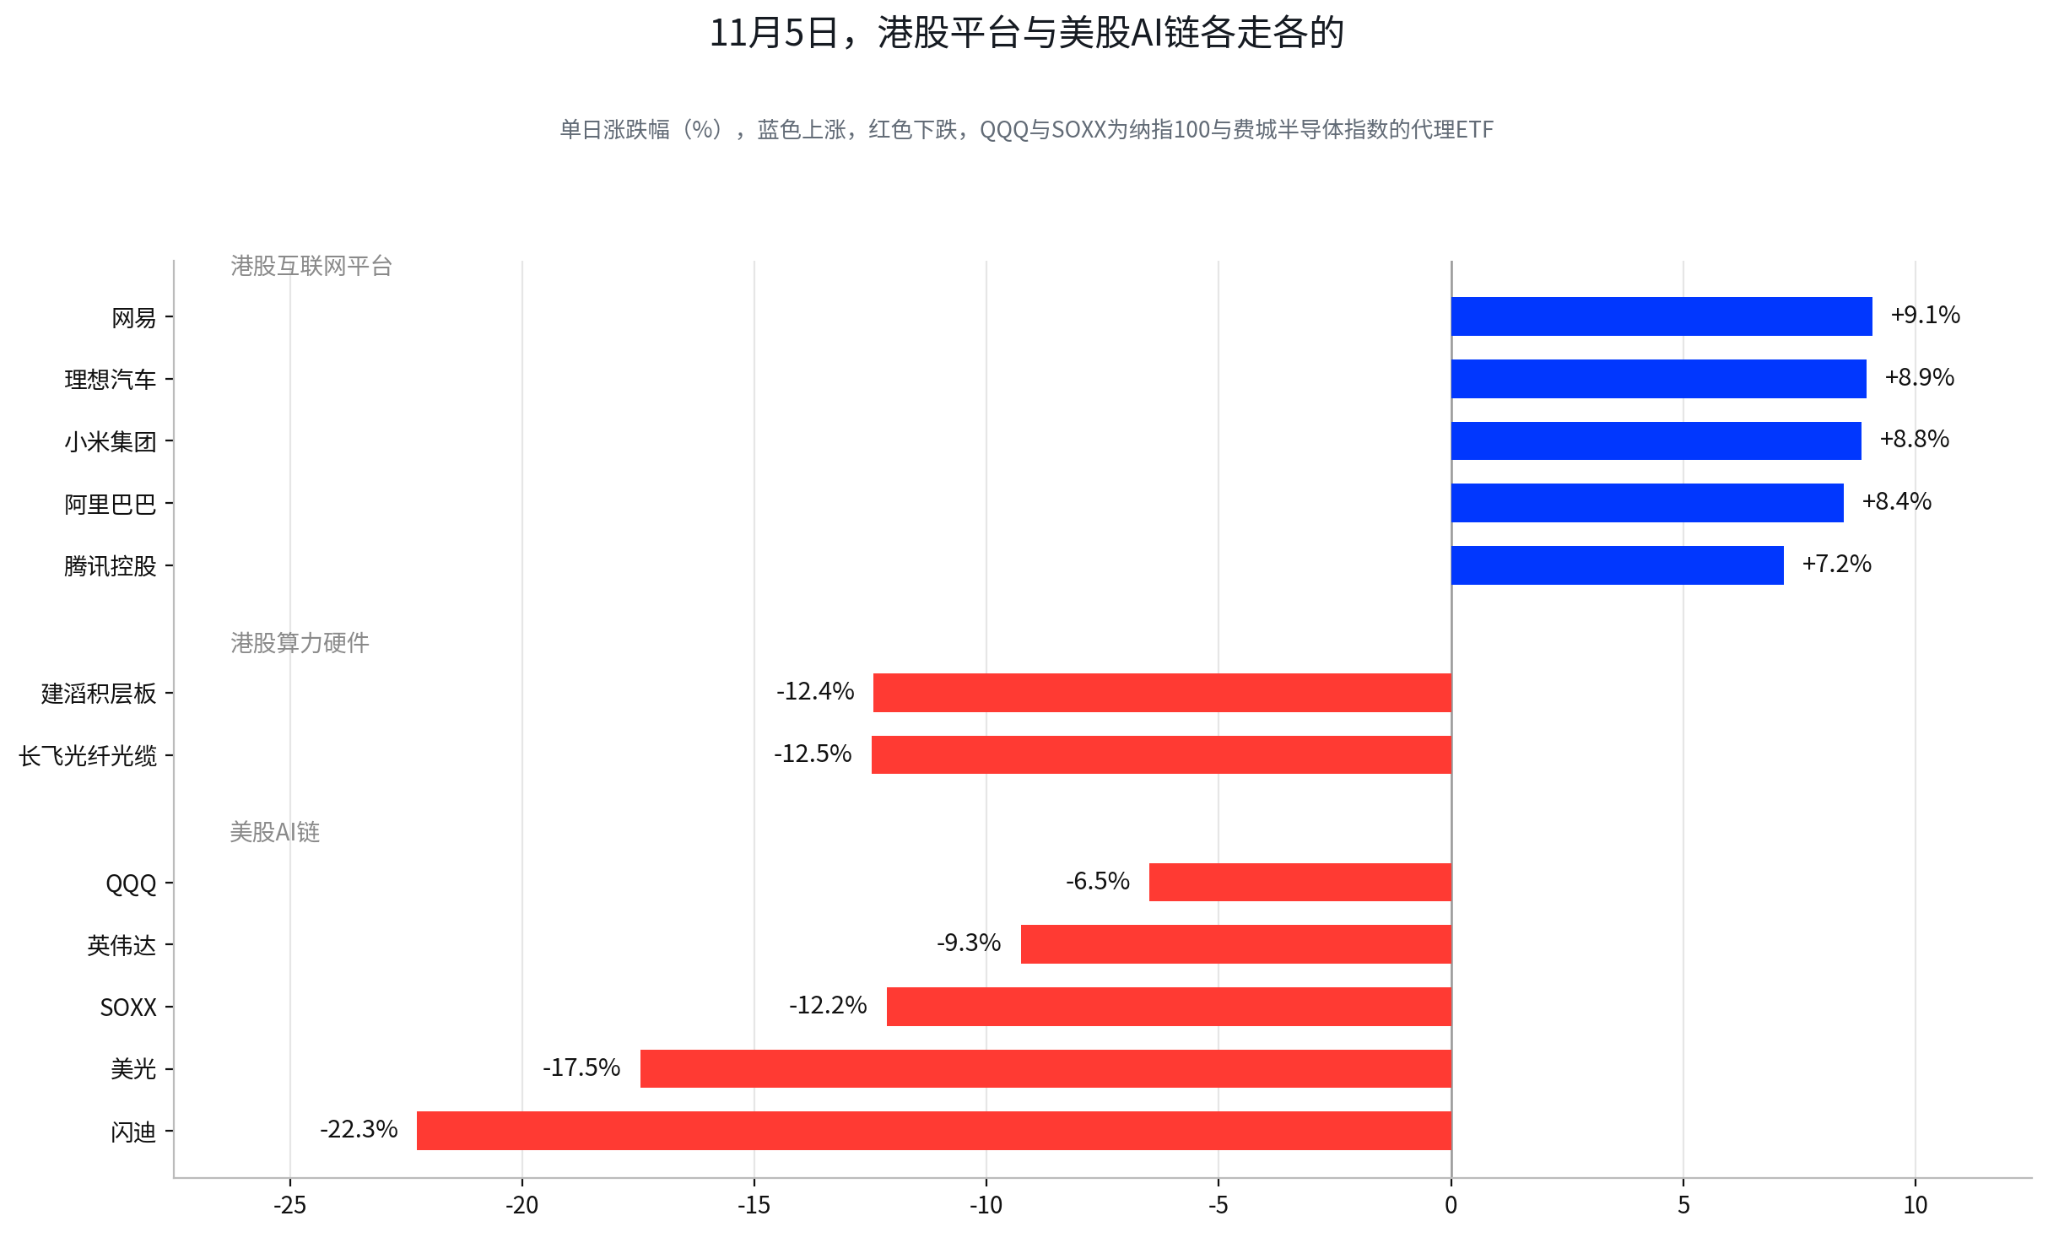
On November 5, the Hang Seng Index rose by 3.67%, the Hang Seng Tech Index rose by 5.55%, with a trading volume that increased to 356.67 billion Hong Kong dollars, a 50.56% increase from the previous trading day, appearing completely opposite to the significant drop in U.S. AI hardware stocks. Breaking it down, Hong Kong stocks did not witness a broad rally; capital was also clearly switching direction.
NetEase rose by 9.07%, Li Auto rose by 8.94%, Xiaomi rose by 8.83%, Alibaba rose by 8.45%, and Tencent Holdings rose by 7.17%. Meanwhile, Jiangsu Hengtong Optic-Electric Co. fell by 12.43%, and Zhongji Innolight fell by 12.48%, with computing hardware that performed strongly the previous day clearly under pressure.
The interpretation of the rise in Hong Kong stocks is that after pressing down on the exposure of AI infrastructure, capital reselects targets within tech assets; the risk-averse trend is merely superficial. Platform internet on one end benefits from valuation recovery and marginal improvement in policy conditions, while on the other end, capital is withdrawing from the computing hardware that is sensitive to high valuations and high capital expenditures; both ends can be understood in the same rotation trade. On the same day, A shares opened low and rose high, with the Shanghai Composite Index up 0.10%, and the ChiNext Index up 0.87%, highlighting the conformance to the rotation clue towards new energy.
On that day, Southbound capital had a net sell-off of about 21.3 billion Hong Kong dollars, which also indicates that an index rising does not equal to a full inflow of Southbound capital; external capital, platform-weighted stocks, and market style switching jointly supported that day's market.
What needs to be observed going forward is whether this rotation can be sustained. If the Hang Seng Tech continues to be led by platform stocks while computing hardware continues to underperform, it suggests capital is actively lowering its exposure to AI infrastructure. If computing hardware begins to outperform again, it means the policy shock from November 5 is being quickly digested.
4. Before Confirming Direction, Focus on Bill Text, Capital Expenditures, and Internal Differentiation
Whether this round can transform from a crowded trade clear-out into a real adjustment of the AI capital expenditure cycle hinges on three aspects.
Bill Text: Local referendums and political statements can only prove that data center construction faces greater social resistance, what really affects valuations is whether restrictive clauses have entered the bills, appropriations, or energy policies. Only with clear restrictions at the federal level does the market have a reason to further lower expectations for data center construction. Remaining merely at social media statements, the declines on November 5 included a lot of emotional and positional factors.
Cloud Vendors Capital Expenditures: How much Microsoft, Google, Amazon, and Meta are ultimately willing to spend is more important than what any politician says. If cloud vendors continue to maintain or even increase capital expenditures, November 5 seems more like an adjustment of valuations and positions. Only in the coming months, should there be project delays, order slowdowns, and downward revisions of capital expenditure guidance, the storage, optical communication, and server supply chains will require further revising down of earnings expectations.
Who Stops Declining First Within the AI Chain: The relative performance of GPUs, storage, optical communications, and PCBs carries more informational value than merely observing the ups and downs of the Nasdaq. If GPUs stabilize first while storage continues to weaken, it indicates the market is pressed down on the expectations for the storage supercycle and crowded trades. A synchronous rebound across the entire AI hardware chain suggests that panic is being digested. If storage, optical communications, and PCBs continue to hit new lows, the market is further reflecting policy risk across the entire capital expenditure cycle.
What was knocked down on November 5 can be clearly identified: the market previously assumed AI capital expenditures would only rise and not fall, and that confidence was fractured that day. The repair of chip stocks after-hours indicates the market is distinguishing between political statements and actual policy implementation; direction has not been completely confirmed.
Bill text determines the level of policy risk, cloud vendors’ capital expenditures determine the truth of fundamentals, and internal differentiation within the AI chain determines whether capital is reallocating or withdrawing.
5. Debt, Gold, Oil, and Currency Were Not Dragged Down
This round of sell-off concentrated on the overcrowded end within stocks; no liquidity crisis across all assets occurred.
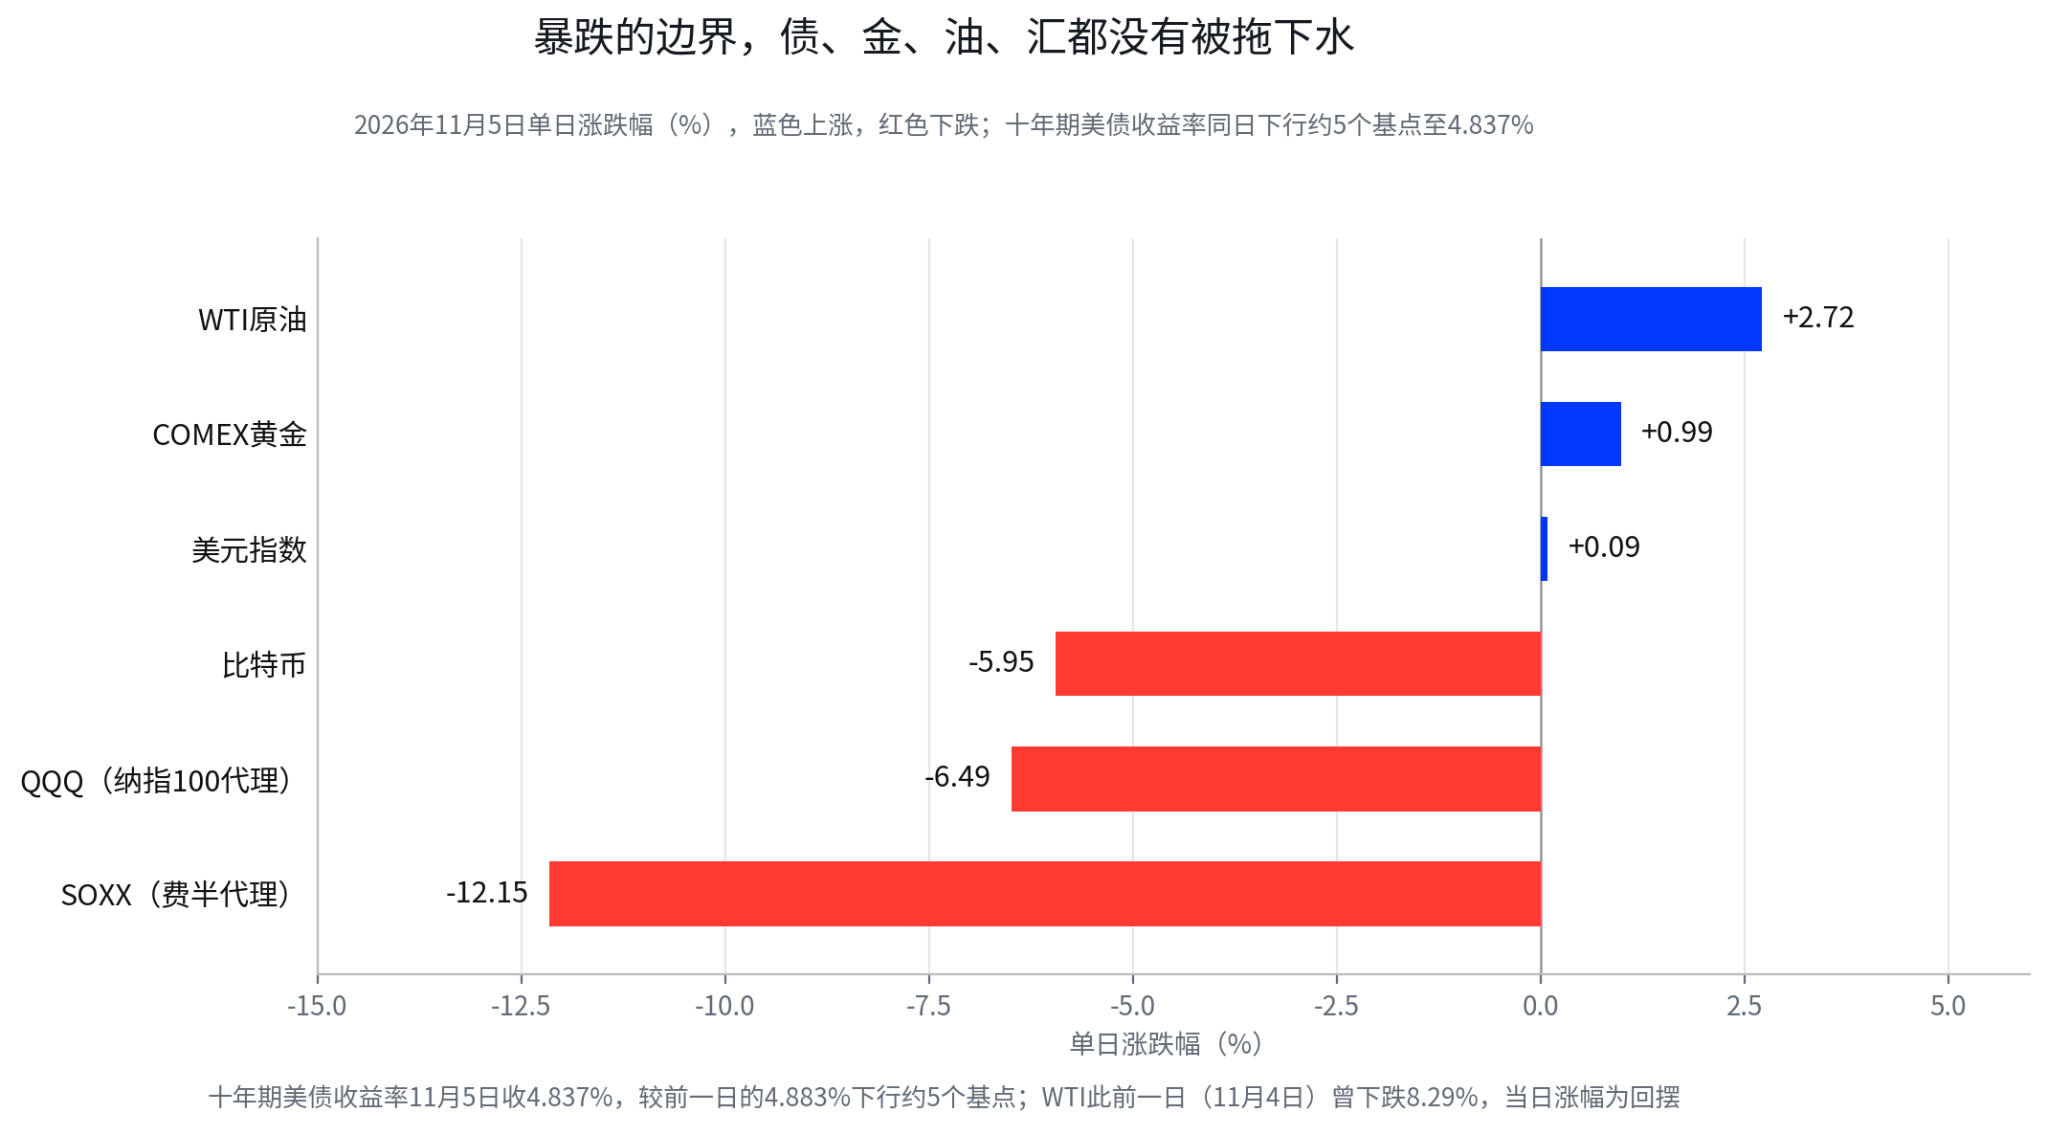
Looking solely at stocks, this is a downturn of a liquidity crisis level. When viewed across all assets, the picture is completely different. Gold had already increased by 3.37% on November 4 and rose an additional 0.99% on November 5, indicating that risk-averse buying not only existed but also continued for the second day. WTI rose by 2.72%, but it must be clarified that it had fallen 8.29% on November 4; the gain on that day belongs to a bounce-back after a significant drop and cannot be taken as evidence of strengthened demand.
The bond market's response is even more interesting. The 10-year U.S. Treasury yield fell from 4.883% to 4.837%, moving down about 5 basis points; there was some risk aversion, but it was moderate. The U.S. dollar index remained flat at around 101.49. If this decline is understood as a deleveraging squeeze, gold would have been sold off to recover margins, and bond yields would have dropped by dozens of basis points due to panic buying; neither of these occurred.
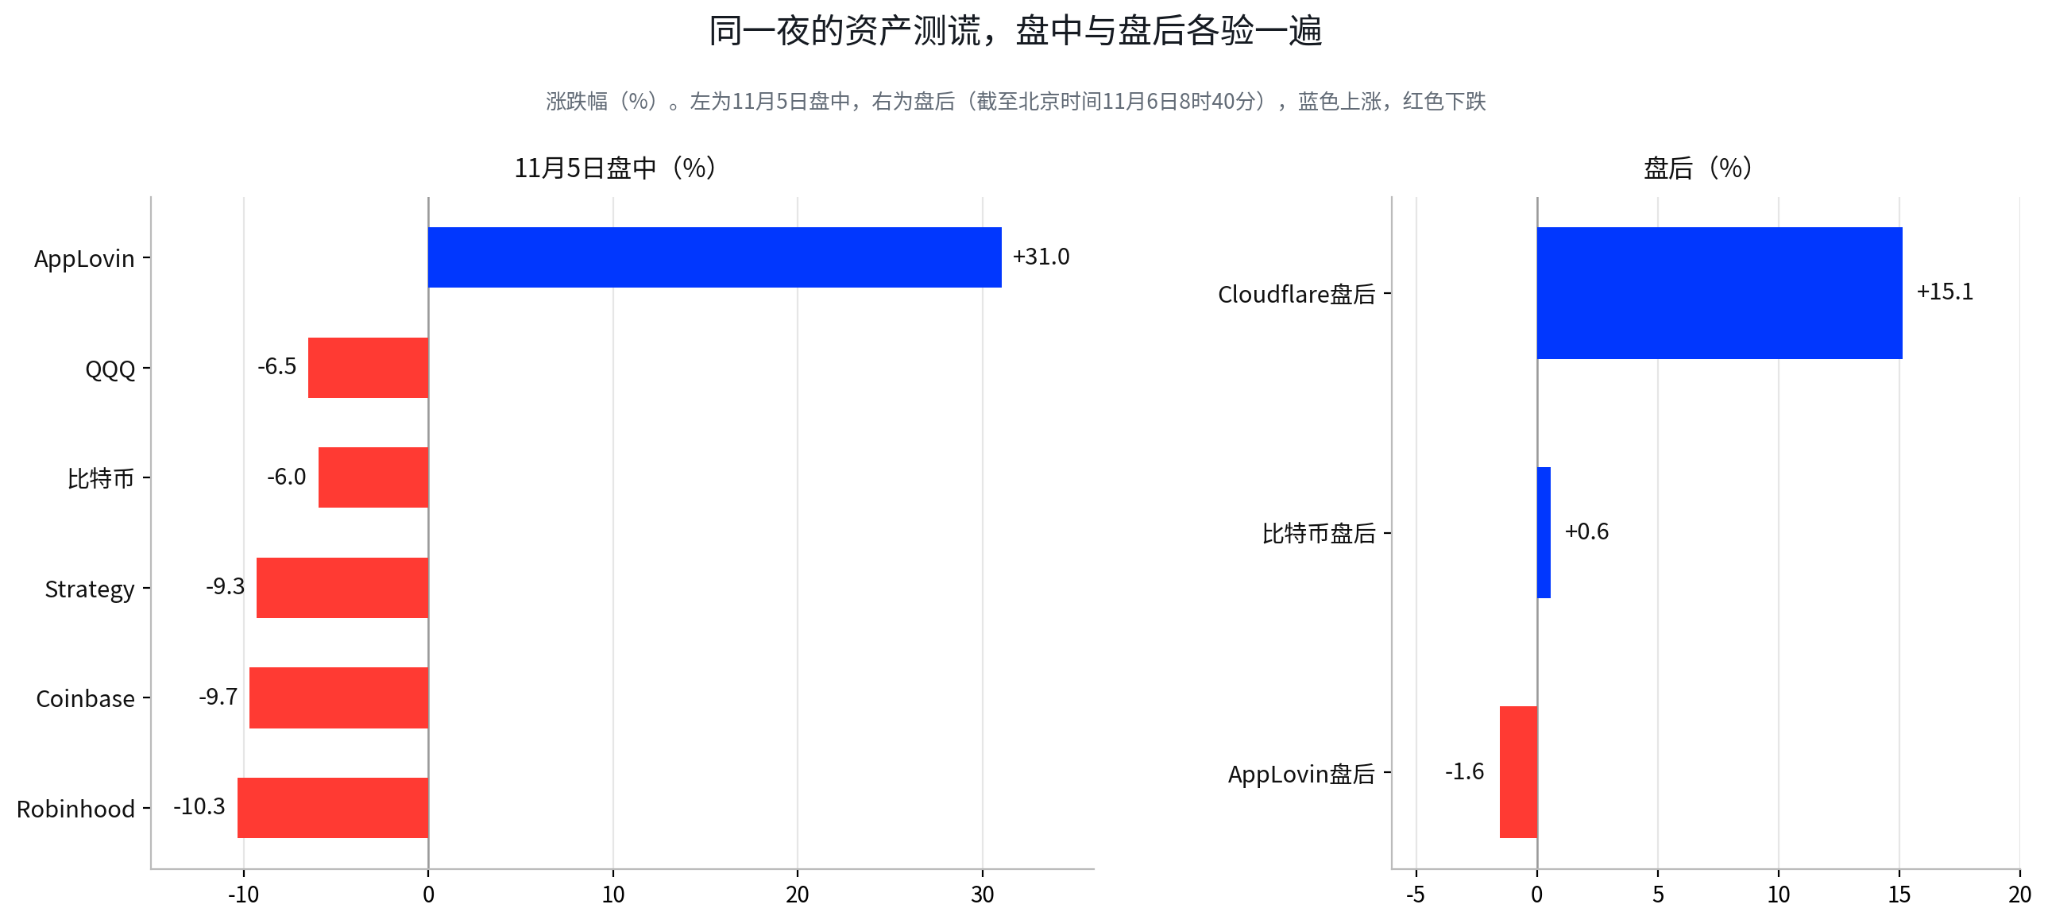
Therefore, that night's sell-off has a clear boundary, drawn on the basis of positional crowding, not on asset categories. What was sold off were the stocks and cryptocurrencies with the fullest positions and heaviest narratives, while those that were caught were assets with actual supply and demand or interest. Bitcoin fell by 5.95%, stuck right on this boundary, following the stock's drop without displaying commodity characteristics.
6. Profit Evidence Was Cashed On The Spot
The same AI chain followed two different directions on November 5, with the difference being whether profit evidence could be produced.
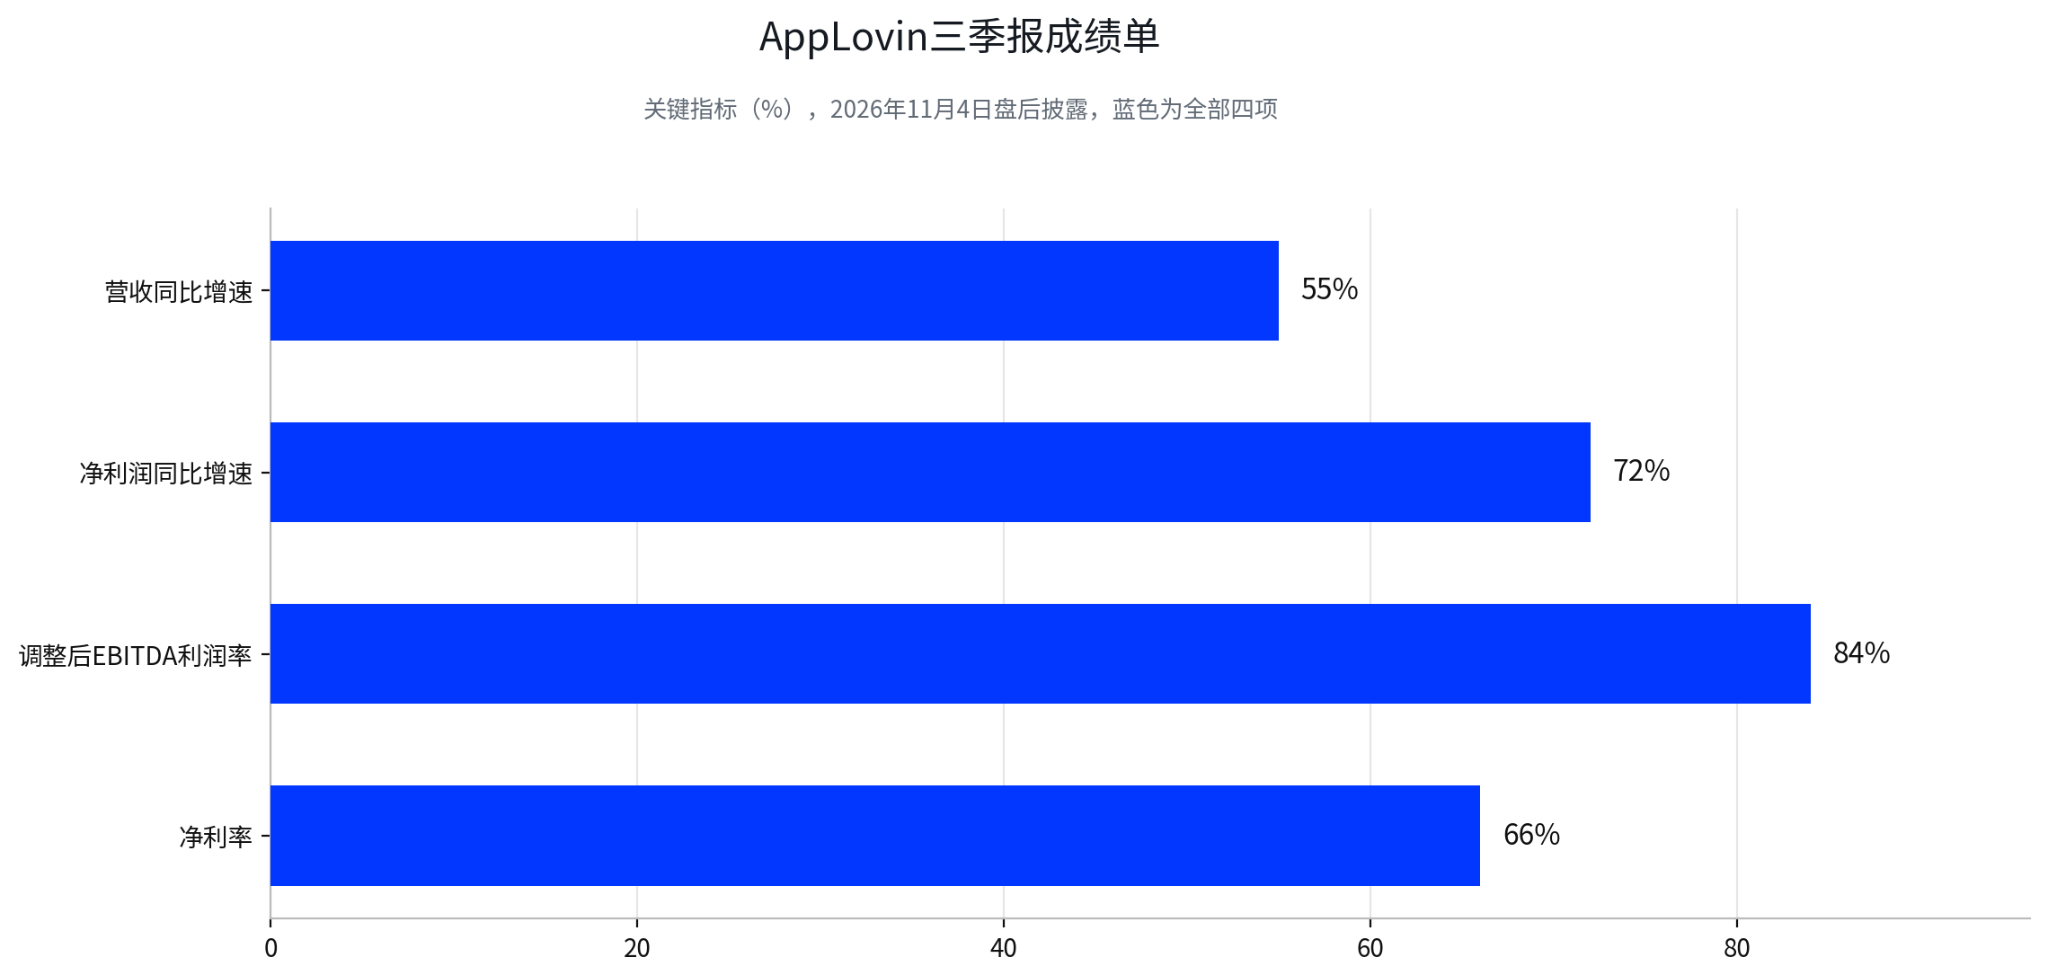
AppLovin's Q3 report was released after the market closed on November 4: revenue of $2.185 billion, a 55% year-on-year increase, net profit of $1.439 billion, a 72% year-on-year increase, net profit margin of 66%, adjusted EBITDA margin of 84%, adjusted EBITDA of $1.84 billion, free cash flow of $1.4 billion (as disclosed by the company). The company also expanded its buyback authorization, and the fourth-quarter guidance implied a revenue growth of 8% to 10% quarter-on-quarter (as reported from the earnings call). Thus, on the same day when the Philadelphia Semiconductor Index fell by 12%, AppLovin's stock jumped by 31.04% during the session.
The position is also important. AppLovin's 52-week high is $738.01, after a two-day surge of 45%, the stock price is still about 52% away from the peak, and its 52-week percentile is only 25.5%. It does not represent a victory for the crowded stocks but looks more like a repair coupon ignited by profit evidence after an excessive drop. The market has not denied AI; it is expelling names that have revenue but no profits, rewarding businesses capable of converting AI into cash flow.
Cloudflare manifested this split in two acts. On November 5, during the session, it fell by 8.03% following the downtrend of the AI infrastructure chain. After-hours earnings report released: for Q3, it had revenue of $782.5 million, a 39% year-on-year increase, with the growth accelerating, annualized revenue crossing $3 billion, non-GAAP operating profit margin of 18%, and current remaining performance obligations growing by 37% year-on-year (disclosed by the company on November 5). After-hours, its stock price rebounded by 15.1%, recovering nearly half of the day's decline. The same company experienced two successive pricing logics within one day, being sold off according to the beta of AI infrastructure during the day and revalued based on profit evidence at night.
7. The Market May Have Partially Factored in Relevant Policy Changes
The pharmaceutical sector did not rise against the trend on November 5; its policy reassessment had already been completed the day before, and that day it just fell less than the AI chain.
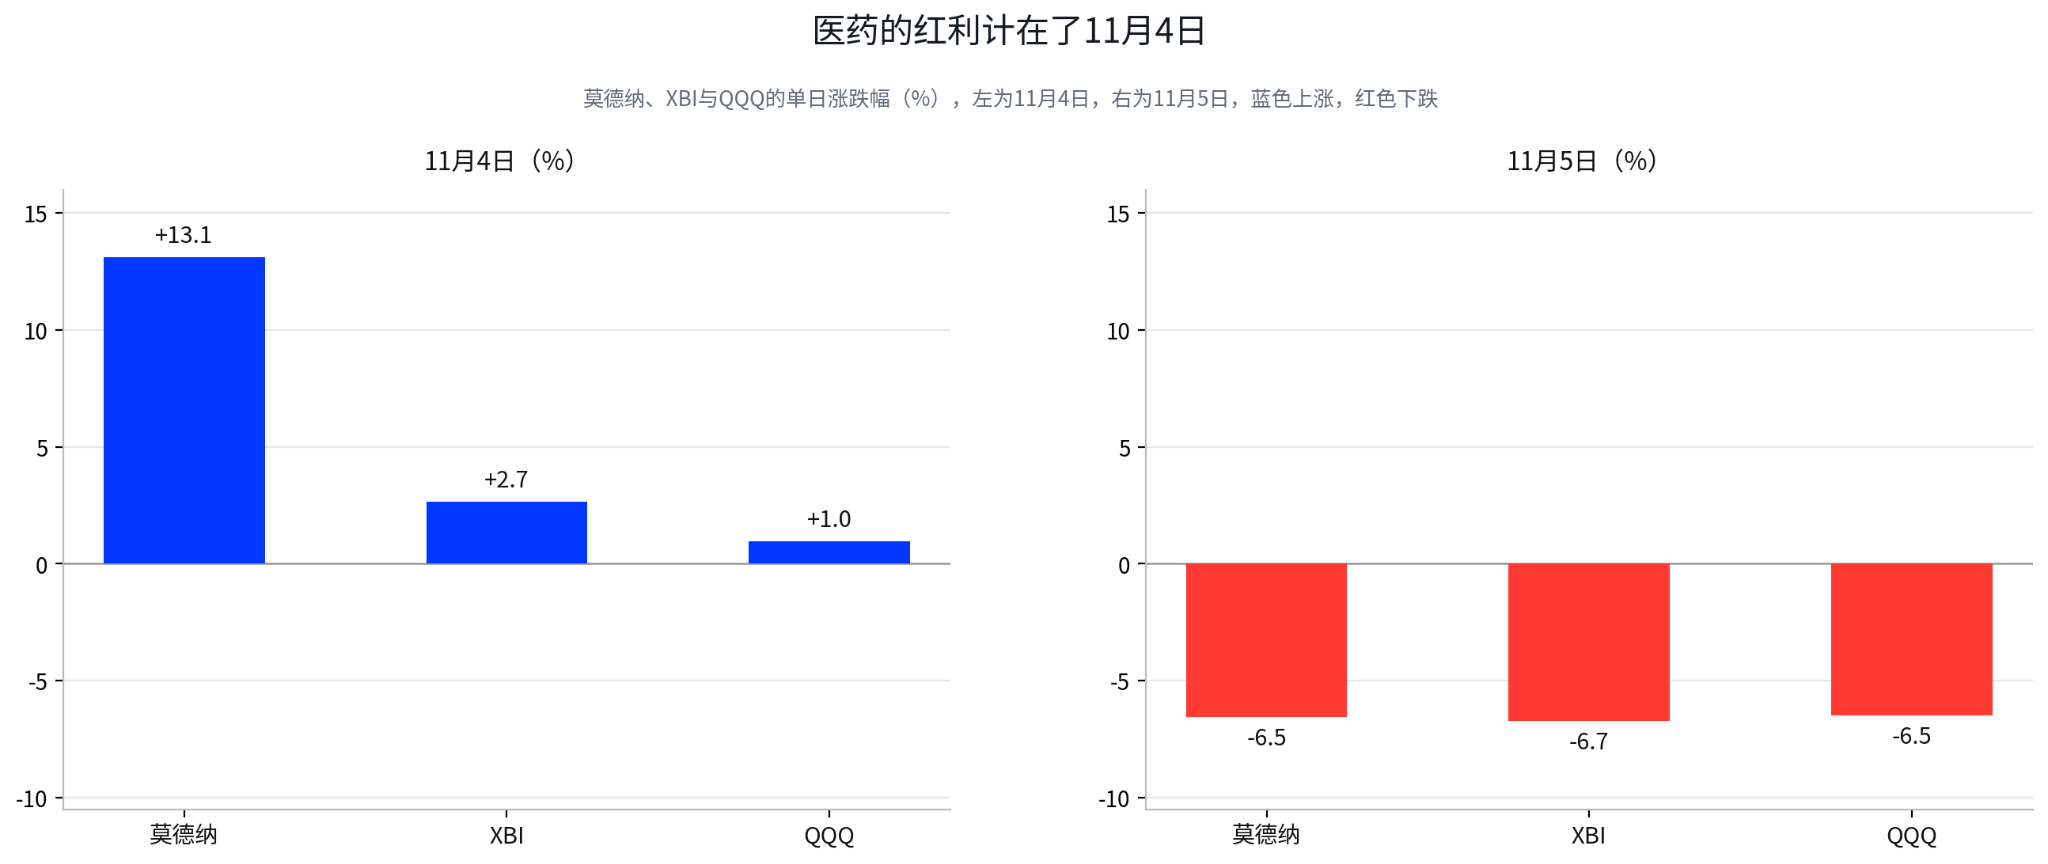
First, let’s present the data. On November 4, Moderna rose by 13.11%, closing at $258.38, hitting a 52-week high of $260.67 during the session, momentarily pushing its market capitalization over $100 billion based on the day’s shares. On the same day, the S&P 500 healthcare sector rose by 3.06%. On November 5, the stock fell by 6.55% to $241.46, with the biotech ETF XBI down 6.73%, while the S&P 500 fell by 4.35%; in fact, the decline of XBI was even deeper than the overall market. However, looking at both days together, Moderna cumulatively rose by 5.70%, while during the same period, the Nasdaq proxy QQQ cumulatively fell by 5.57%, with the divergence still clear. Moderna's current price is only 7.4% away from its 52-week high, with a 52-week percentile of 91.9%.
The accounting for policy is also straightforward. After the Democrats took control of Congress, advancing the plans to cut Medicaid spending encountered steep resistance; the extension of health insurance subsidies and the Medicaid issue has been pushed to the appropriations deadline of December 11 (as noted in an article from Ping An International on November 5). The negotiation mechanism for drug pricing under the Inflation Reduction Act already exists, and Congressional legislative energy will be occupied in the short term by data center and cryptocurrency regulation, pushing down the priority for adding pricing pressures on pharmaceutical companies. The pharmaceuticals seem more like a case of bad news already priced in, with the biggest tail risk of policy being removed, giving these assets a natural appeal to institutional funds during contraction periods.
8. Cryptocurrencies without Cash Flow and Hardware Betting on Others' Capital Spending
The standards for those excluded are also consistent: either cash flow does not belong to them, or growth relies on others' capital expenditures.
On November 5, Bitcoin closed at $75,640, down 5.95% from the previous day's $80,428, and rebounded to around $76,088 by 10 AM Beijing time on November 6. U.S. cryptocurrency stocks also collapsed in sync, with Coinbase down 9.69%, Robinhood down 10.32%, and Strategy down 9.29%.
The liquidity aspect is easy to understand. The stock market's crash triggered margin calls, Bitcoin is traded around the clock with good depth, making it naturally the first asset to be sold off to recover margins; this mechanism repeats during every risk asset deleveraging.
The policy impact is more tangible. The structure of the crypto market bill, the Clarity Act, has been under review in this Congress for over a year, and this Congress will end on January 3, 2027; if not passed into law by then, the bill will automatically become void and must start over. After the Democrats swept both houses, the market prediction platform Kalshi estimates that the probability for the Clarity Act to become law before 2027 is only about 6% (as cited from Disruption Banking on November 4). Media reports generally anticipate that the Democrats' regulatory direction will emphasize investor protection, which may slow the compliance process for new asset classes (as cited from the Korea Economic Daily on November 5). For an asset class that lacks endogenous cash flow and heavily relies on the regulatory framework's implementation, this time window is more important than the price itself.
Bitcoin's rise on November 6 also shows that the sell-off is similarly colored by post-sale liquidity recovery; confirmation of direction should be awaited until regular trading hours.
AI hardware represents another excluded category. Its issue does not lie in demand, but in the logic of capital expenditure expansion being interrupted by policy uncertainties. Goldman Sachs' Hasus estimates that about 45% of planned data center projects may be impacted by the pause; this estimate remains a pressure hanging above the chain. Hardware companies' cash flow highly depends on the pace of capital expenditures by cloud vendors, which in turn relies on the progress of legislative and electrical approvals, with each link in the chain placing certainty in others' hands.
This night's selection across all markets shows that the two passed had cash flow answers, while the two excluded placed their certainty in others.
The three signals listed in the fourth section all have a calendar: bill text looks at the December appropriations bill, cloud vendors' capital expenditures look at fourth-quarter guidance, while internal differentiation looks at the opening on November 6. Adding the pharmaceuticals, there’s the final text for health insurance and Medicaid terms on December 11. The examples of AppLovin and Cloudflare illustrate that when evidence is in place, capital does not hesitate, with companies still able to rise by 31% on a down day. Conversely, Bitcoin's example shows that when certainty is withdrawn, the correlation between decline and position crowding is minimal.
Understanding the cash flow background and policy safety cushion behind each asset is more useful than speculating on the low of the Nasdaq.
The style switch under macro changes seems to be accelerating. BIT supports both U.S. and Hong Kong stock market allocations, allowing users to track the profit realization of AI application ends and the liquidity changes of crypto assets within the same account. Stablecoins enable direct deposits and withdrawals, with 7×24 second-level arrival, making allocations across multiple assets more time-efficient. BIT also supports traditional wire transfers for deposits and withdrawals to match the needs of different customer groups.
Disclaimer:
The content of this article is for general informational and market commentary purposes only, compiled based on publicly available information as of the time referenced in the text, and relevant market data, expectations, and probabilities may change with market conditions. The views and investment strategies expressed by third-party institutions, analysts, or other individuals quoted in this text only represent their views at a specific time and do not represent BIT's views or recommendations. This article does not constitute investment advice, research, an invitation, solicitation, or recommendation regarding any securities, investment products, or trading strategies, nor should it serve as the basis for any investment decision. Financial markets carry risks, and security prices and market performance may fluctuate; past performance and historical market trends do not represent or guarantee future results. Investors should independently assess relevant risks based on their own situations and seek professional advice when necessary. BIT's Hong Kong stock trading services are not available to Hong Kong residents or users in other restricted jurisdictions.
免责声明:本文章仅代表作者个人观点,不代表本平台的立场和观点。本文章仅供信息分享,不构成对任何人的任何投资建议。用户与作者之间的任何争议,与本平台无关。如网页中刊载的文章或图片涉及侵权,请提供相关的权利证明和身份证明发送邮件到[email protected],本平台相关工作人员将会进行核查。


