IWM
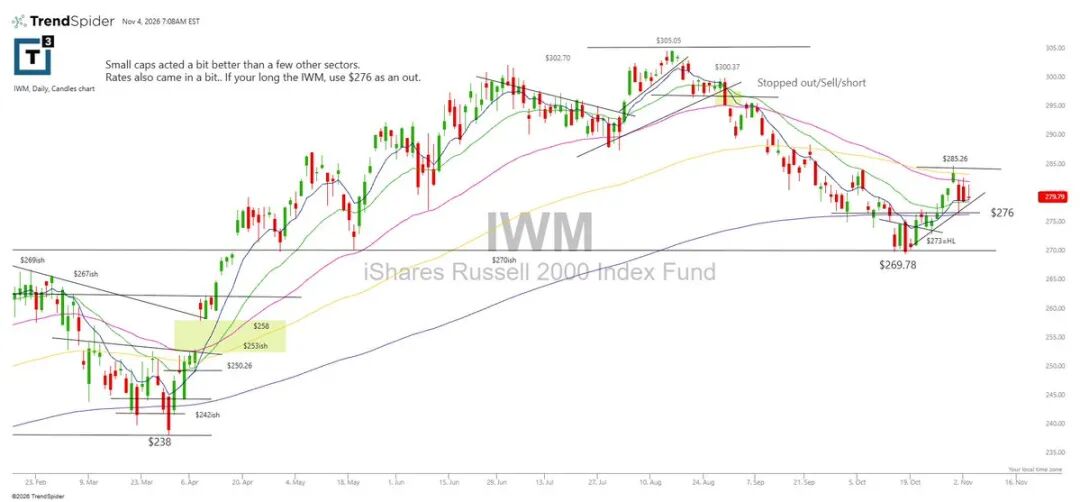
The performance of small-cap stocks is slightly better than several other sectors. Interest rates have also slightly retreated. If you are long on IWM, use $276 as a stop-loss point.
SPY
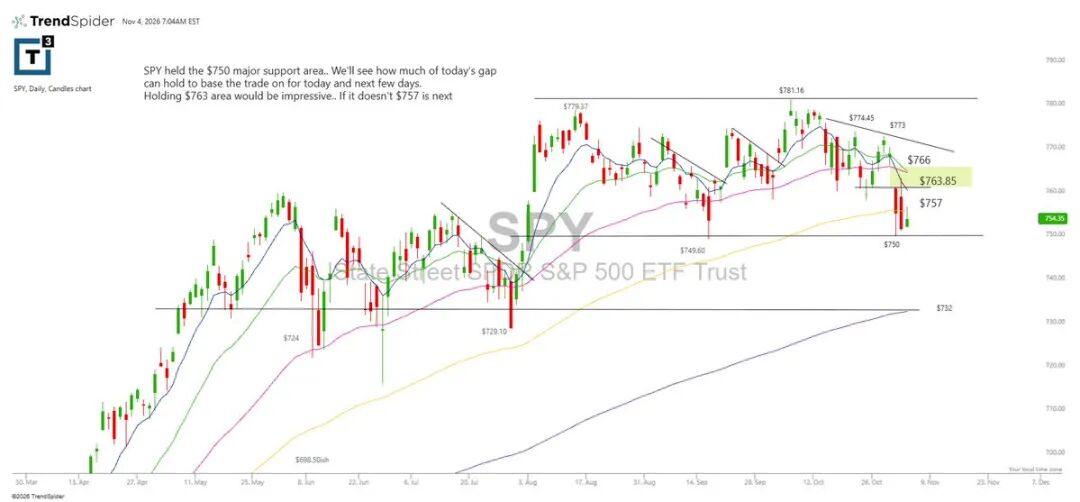
SPY has held the major support area of $750. We will observe how much of today's gap can be maintained, using this as a basis for trading today and in the coming days. If it can hold the $763 area, it will be impressive. If it cannot hold, the next position is $757.
QQQ
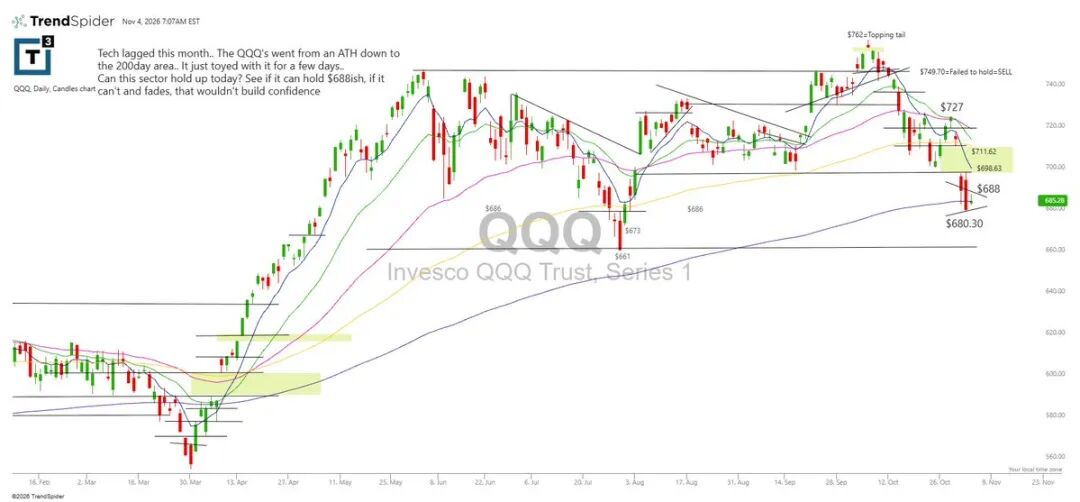
The technology sector has underperformed this month. QQQ has dropped from its historic high to the 200-day moving average area, lingering in that region for several days. Can this sector hold today? Let's see if it can maintain around $688ish; if it fails to hold and pulls back, it will be hard to boost confidence.
XLE
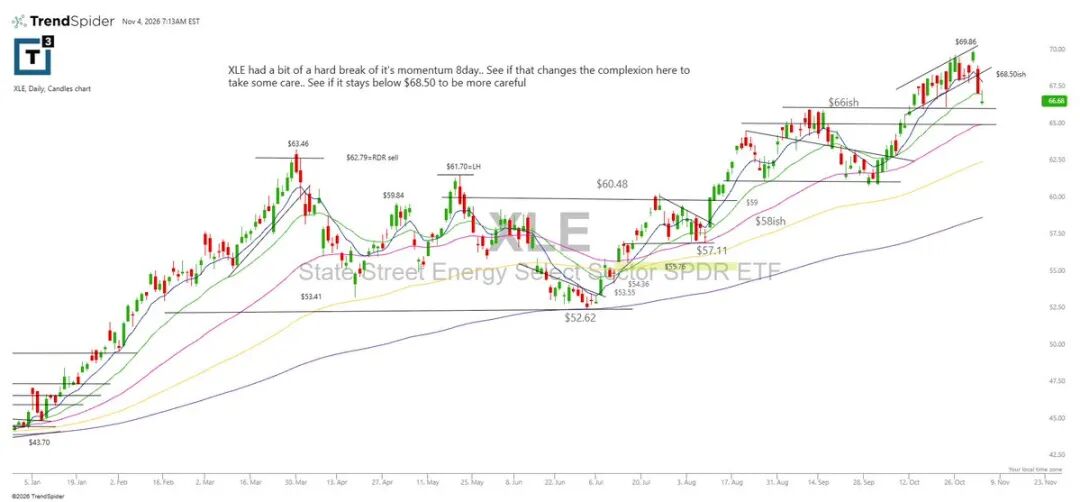
XLE's trend has noticeably broken below its 8-day momentum moving average. Let's see if this changes the situation here; we need to be cautious. Check if it continues to stay below $68.50; if it does, be more careful.
TAN
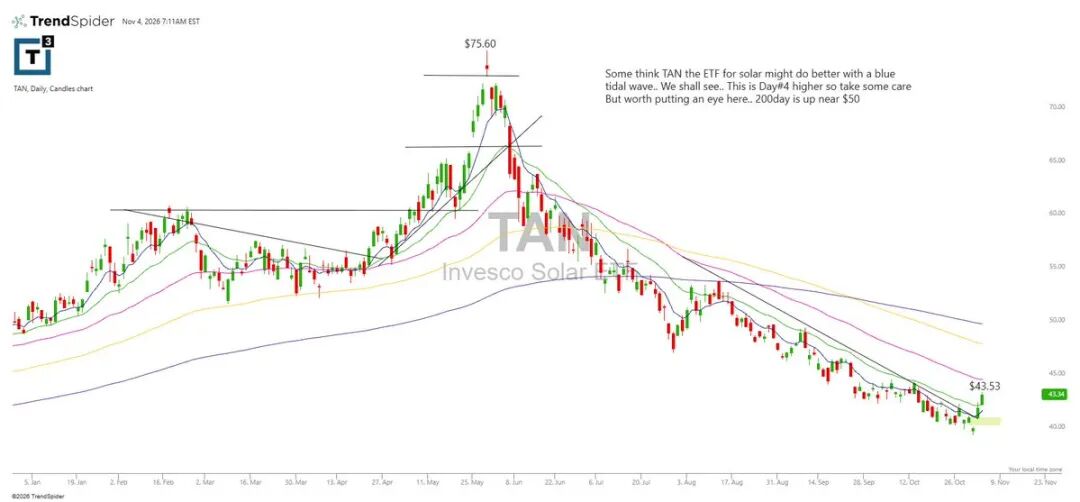
Some believe that if a blue wave occurs, the solar ETF TAN may perform better. Let's wait and see. This is the fourth consecutive day of increases, so be cautious, but it deserves attention. The 200-day moving average is close to $50.
SPX
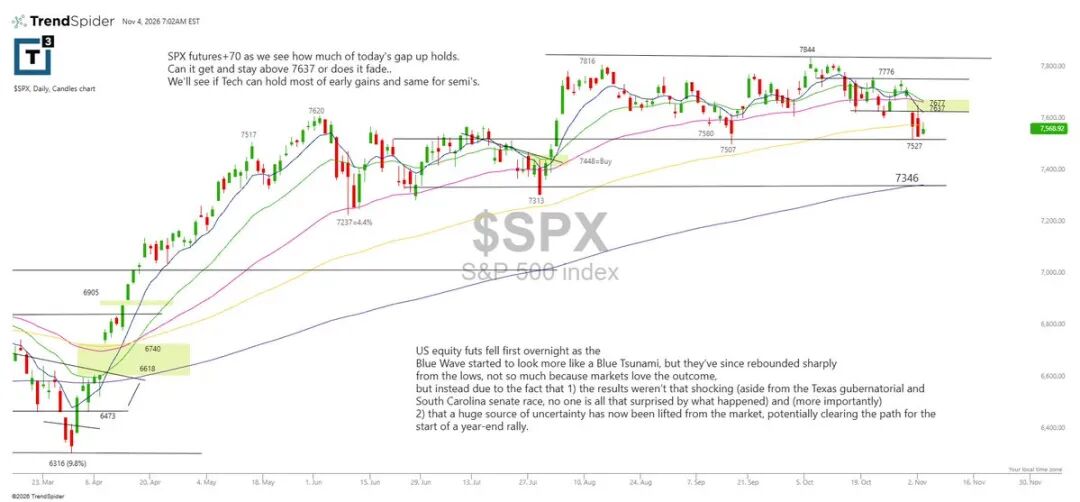
SPX futures are up 70 points, and we will observe how much of the gap can be held after a gap-up today. Can it break and hold at 7637, or will it pull back...? We will observe whether tech stocks can maintain most of their early gains, as will semiconductor stocks. U.S. stock index futures initially dropped overnight as the "blue wave" began to look more like a "blue tsunami," but have since rebounded significantly from the lows; this is not because the market likes this outcome, but because: 1) the outcome was not so shocking (apart from the Texas governor's election and South Carolina's senate election, no one was particularly surprised by what happened); and more importantly, 2) the market has now eliminated a major source of uncertainty, which could clear the way for the year-end rally to start.
SMH
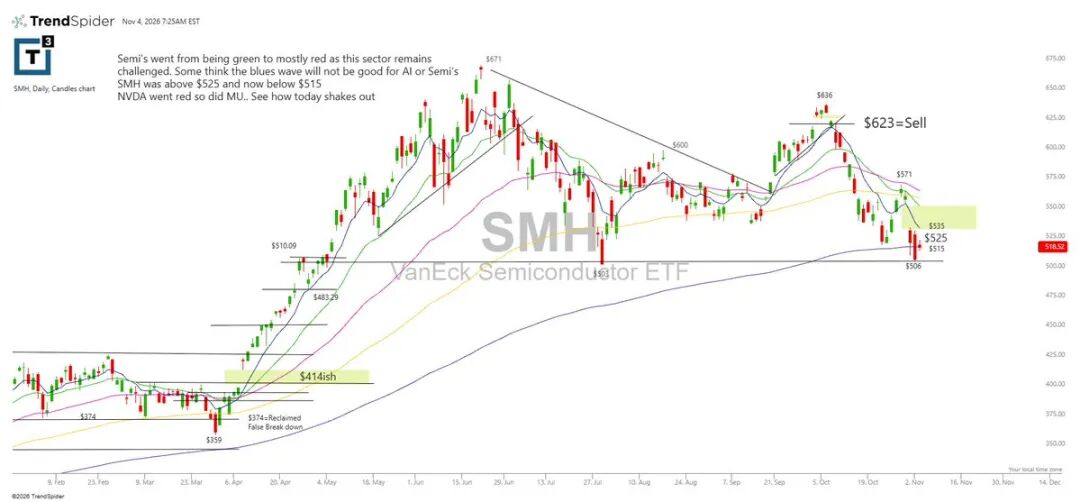
The semiconductor sector has transitioned from gains to mostly declines, and the sector still faces challenges. Some believe the blue wave will not benefit AI or semiconductors. SMH was previously above $525 but is now below $515. NVDA has turned down, as has MU. Let's see how today’s final trend plays out.
MU
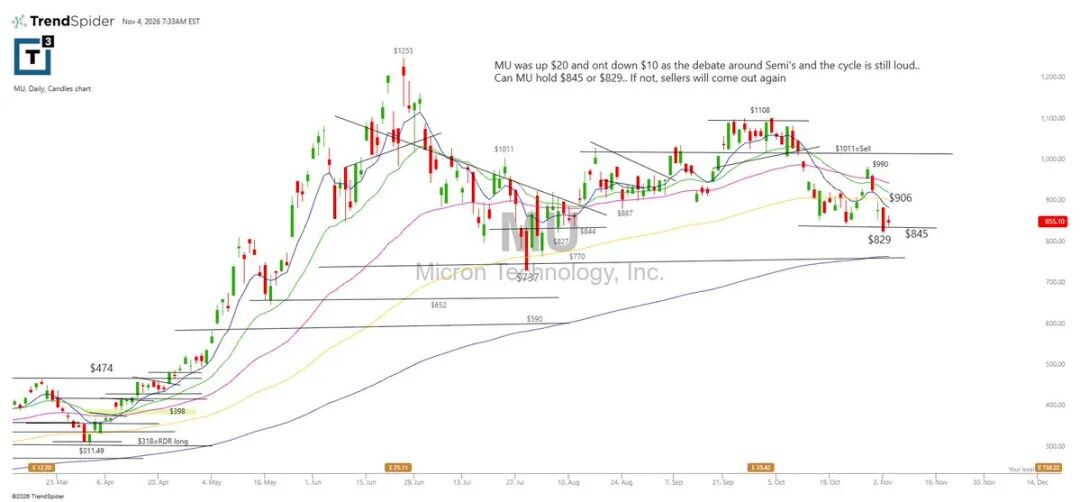
MU once rose to $20, then fell $10, and the debate surrounding semiconductors and cycles remains intense. Can MU hold at $845 or $829? If not, sellers will reemerge.
ICLN
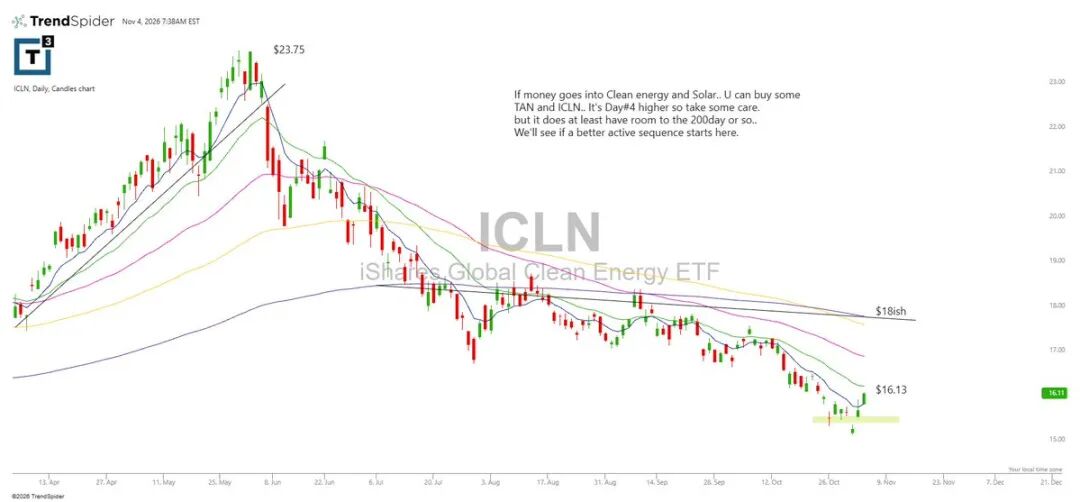
If capital flows into clean energy and solar sectors, you can buy some TAN and ICLN. This is the fourth consecutive day of increases, so be cautious. But there is still room for growth at least near the 200-day moving average. We will see if this marks the beginning of a better active trend.
AMD
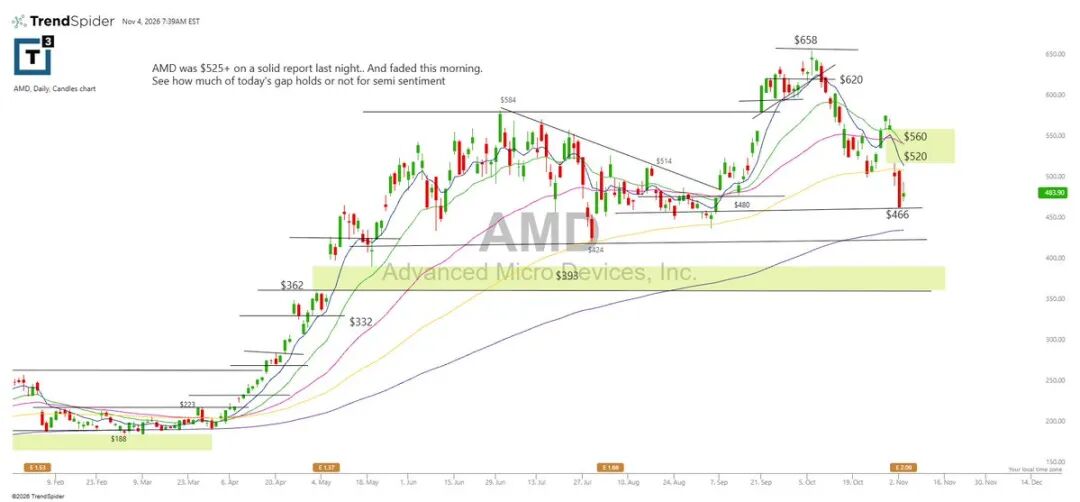
After releasing a solid earnings report last night, AMD reached over $525 but retreated this morning. Let's see how much of today’s gap can be held, or whether it can be held, to gauge the market sentiment in the semiconductor sector.
NVDA
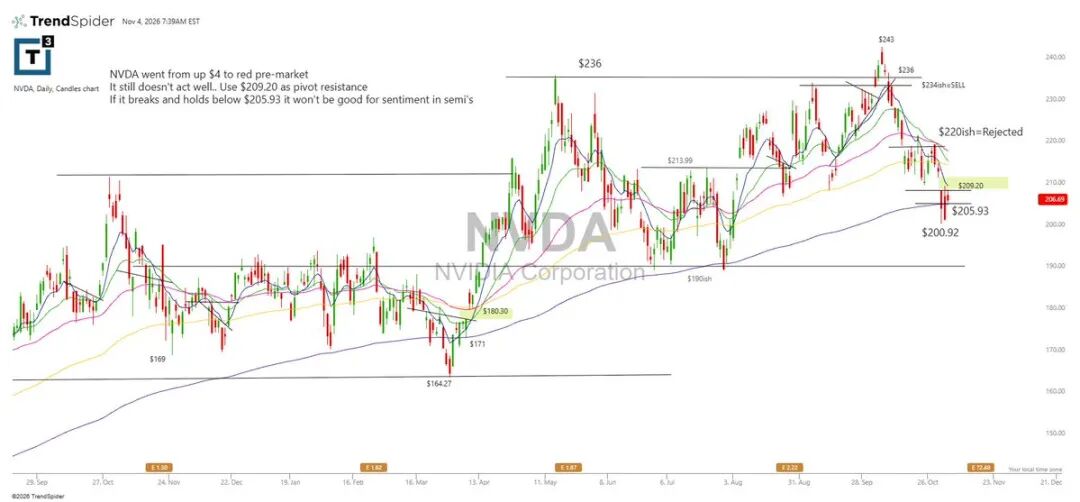
NVDA shifted from rising $4 pre-market to declining. Its performance remains poor. Use $209.20 as a key resistance level. If it falls below $205.93 and stays beneath it, it will be detrimental to market sentiment in the semiconductor sector.
AMZN
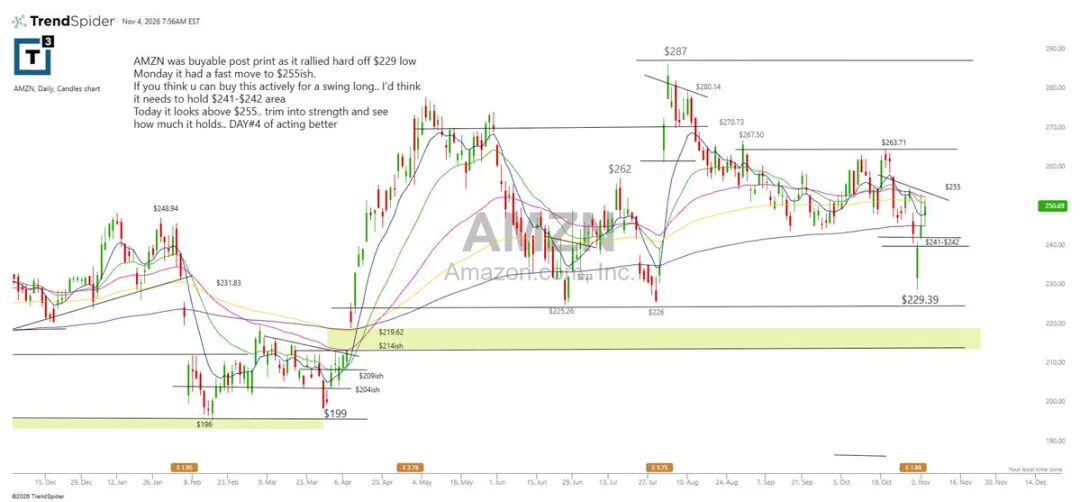
AMZN can be bought after the earnings report, rebounding strongly from a low of $229 on Monday to quickly rise to around $255. If you believe you can actively buy on a swing long position, I think it needs to hold the $241-$242 area. Today it looks like it will rise above $255; reduce positions on strength, and observe how much of the gain it can hold. This is DAY#4 of trend improvement.
AAPL
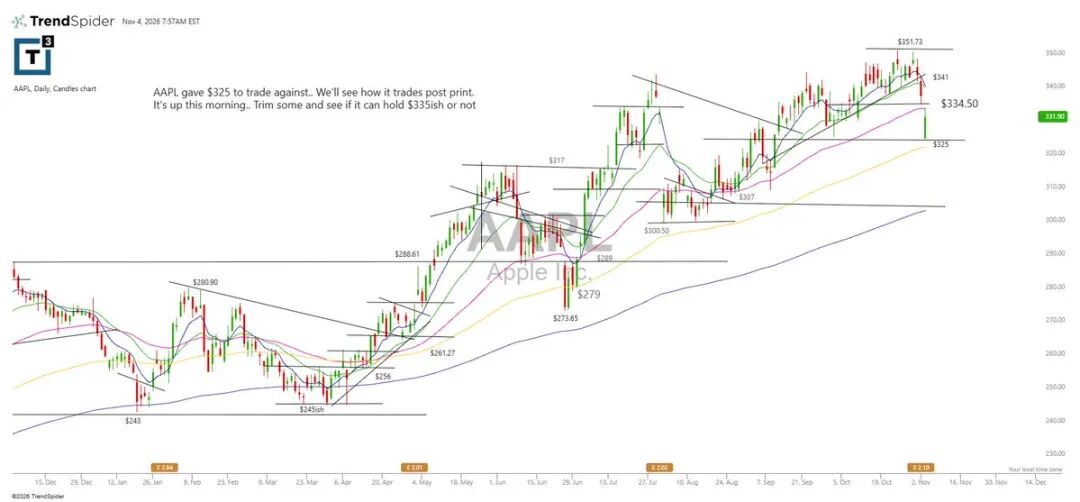
AAPL provided $325, which can be used as a trading reference. We will see its movement after the earnings report. It rose this morning. Trim some, and see if it can hold around $335.
GOOGL
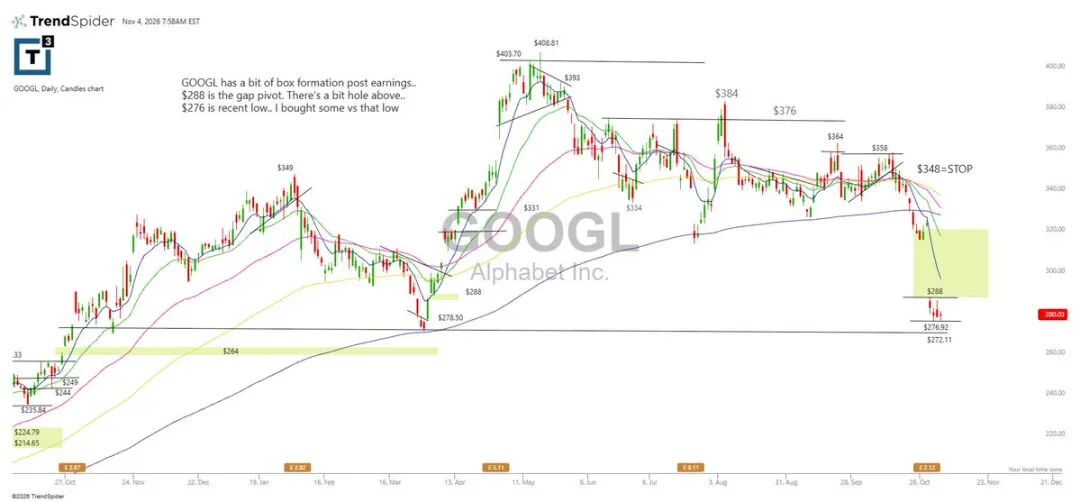
GOOGL formed a small range after the earnings report... $288 is the gap pivot point. There is a small gap above... $276 is a recent low... I bought some and used that low as a stop-loss.
MAGS
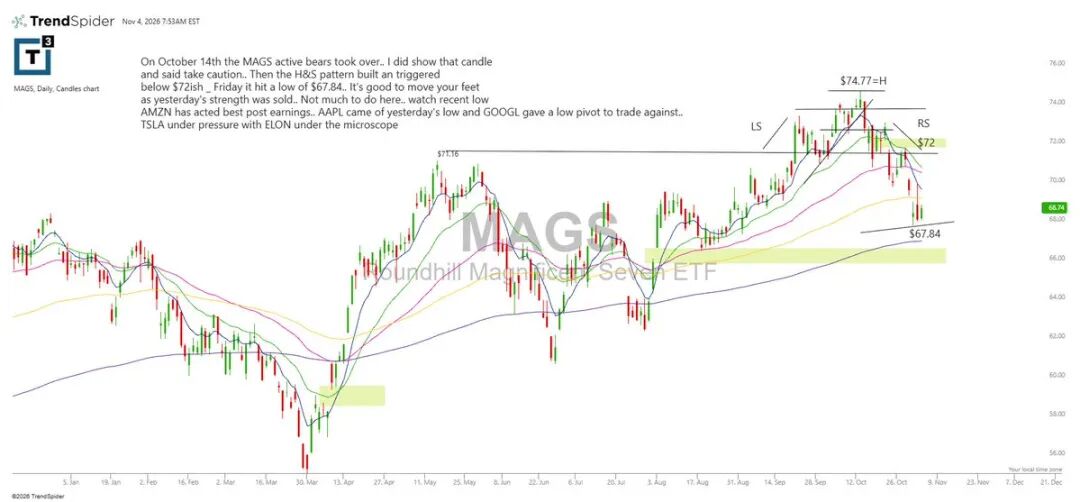
On October 14, MAGS shorts began to dominate... I did show that candlestick at that time and warned to be cautious... then a head and shoulders pattern formed and triggered upon breaking below $72ish... Friday hit a low of $67.84... It's best to act flexibly because yesterday's strength has been sold off... There is nothing much to do here... Focus on recent lows. After the earnings report, AMZN performed the best... AAPL rebounded from yesterday's low, while GOOGL formed a low pivot point that can be used as a trading stop-loss reference... With ELON being closely scrutinized, TSLA is under pressure.
META
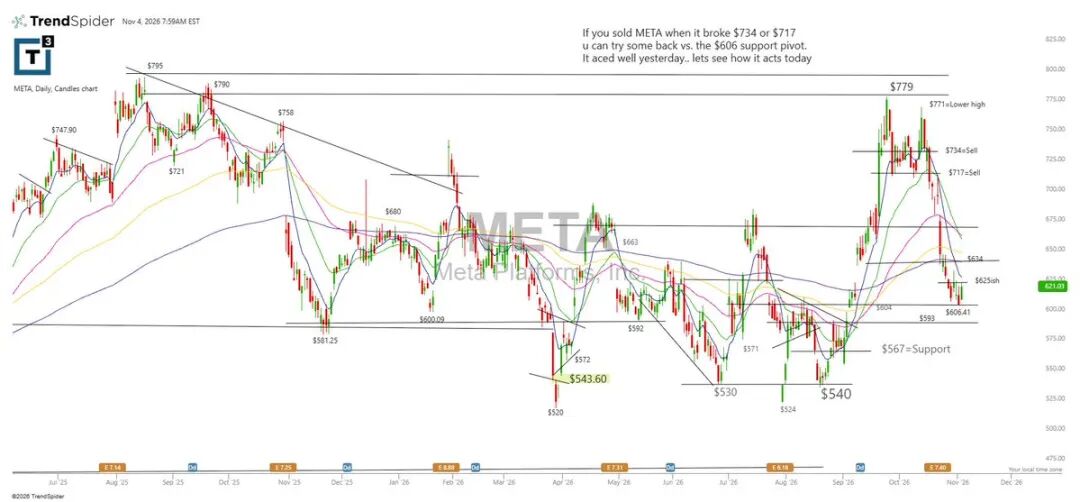
If you sold META when it broke below $734 or $717, you can try to buy back near the $606 support pivot point and use that price as a stop-loss. It performed well yesterday... let’s see how it performs today.
TSLA
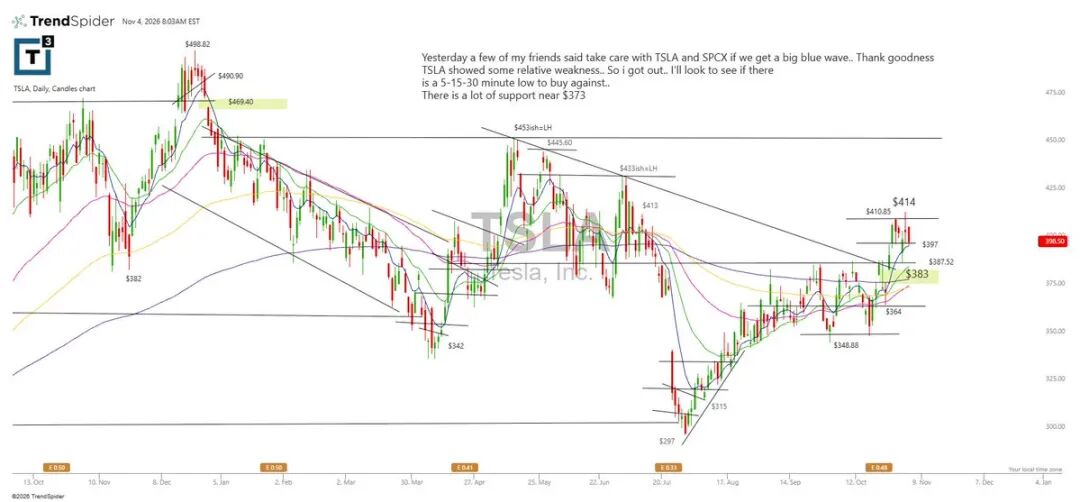
Yesterday, some of my friends said to be wary of TSLA and SPCX if there is a huge blue wave. Thank goodness, TSLA showed some relative weakness... so I exited. I will watch to see if a 5-15-30 minute low forms, using that low as a stop-loss for a buy. There is substantial support around $373.
MSFT
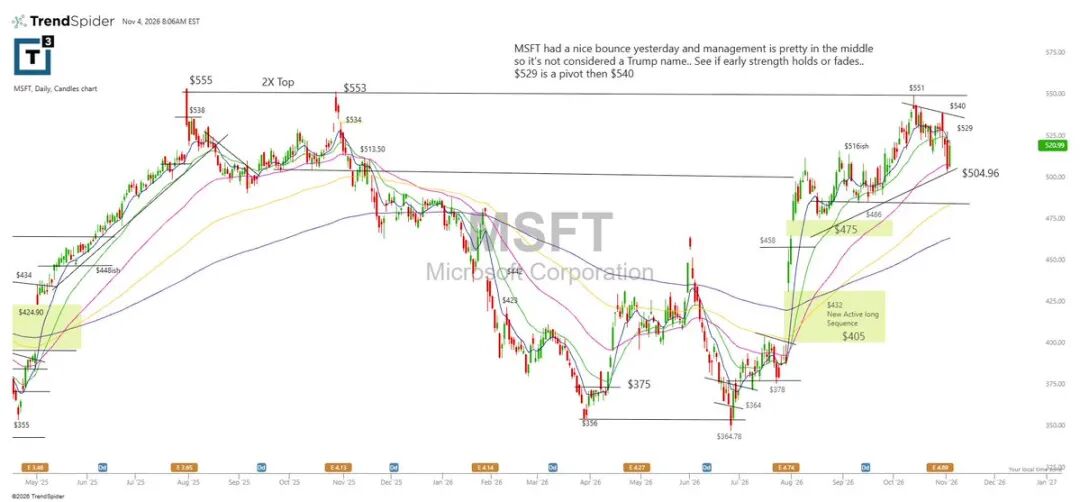
MSFT had a nice rebound yesterday, and the management's stance is quite centrist, so it is not viewed as a Trump concept stock. Watch to see if the early strength can be maintained or will gradually fade. $529 is a pivot point, followed by $540.
GLD
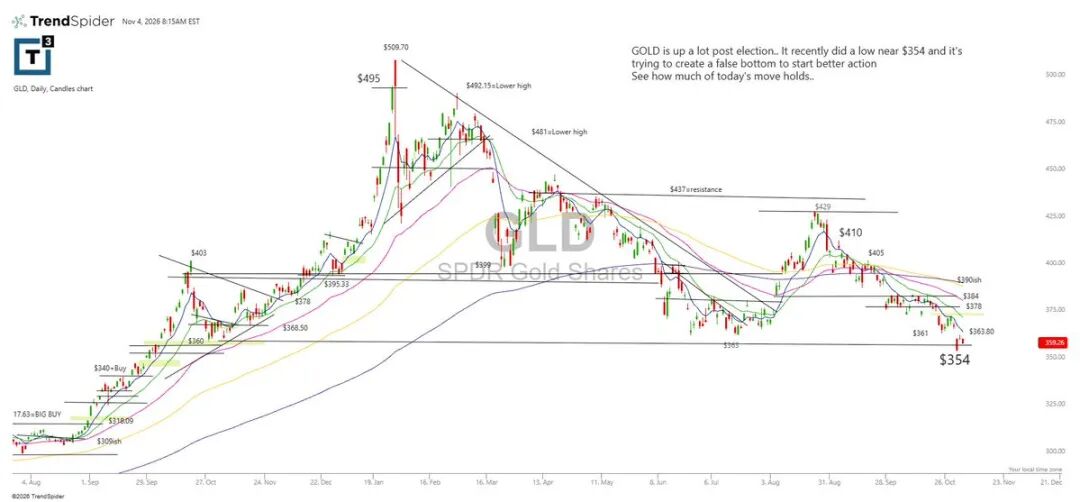
GOLD surged significantly after the election. It recently hit a low close to $354 and is now attempting to build a false bottom to start a better trend. Let's see how much of today’s gain can be held.
NBIS
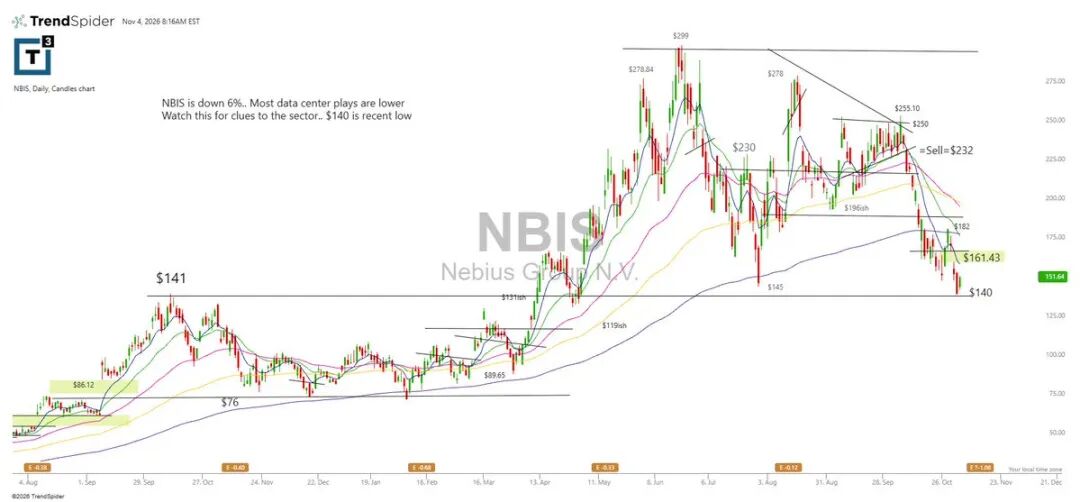
NBIS is down 6%. Most data center concept stocks are declining. Pay attention to this for clues about the sector. $140 is a recent low.
SPCX
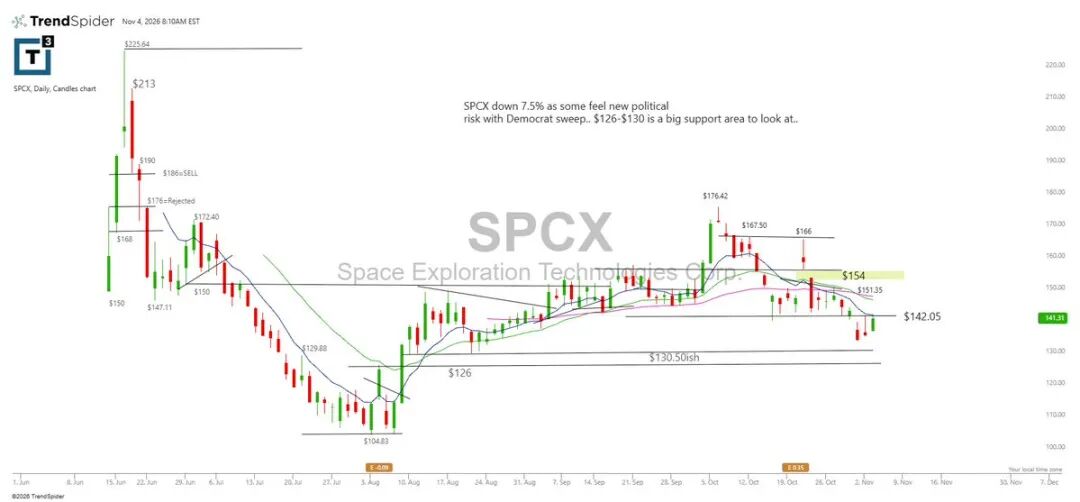
SPCX is down 7.5%, as some believe the Democratic sweep brings new political risks... $126-$130 is an important support area worth monitoring...
免责声明:本文章仅代表作者个人观点,不代表本平台的立场和观点。本文章仅供信息分享,不构成对任何人的任何投资建议。用户与作者之间的任何争议,与本平台无关。如网页中刊载的文章或图片涉及侵权,请提供相关的权利证明和身份证明发送邮件到[email protected],本平台相关工作人员将会进行核查。


