Cryptocurrency Academy: A single bullish candle at 11.5 Ethereum (ETH) has wiped out three weeks of decline; have Ethereum bears completely given up?
Without further ado, let's get to the conclusion: the position of 2172 for the second token is very likely the temporary low point of this round of decline. Why? Because of a 4-hour bottom divergence + daily MACD golden cross + a single-day amplitude of 9.89% with a bullish candle, these three signals appearing simultaneously have only happened three times in the past year, each corresponding to at least a 15%–20% rebound space. I’m not fortune-telling; I’m just showing you historical data. Follow me, and I will continue to track how far this rebound can go, as well as where to reduce positions and where to stop loss.
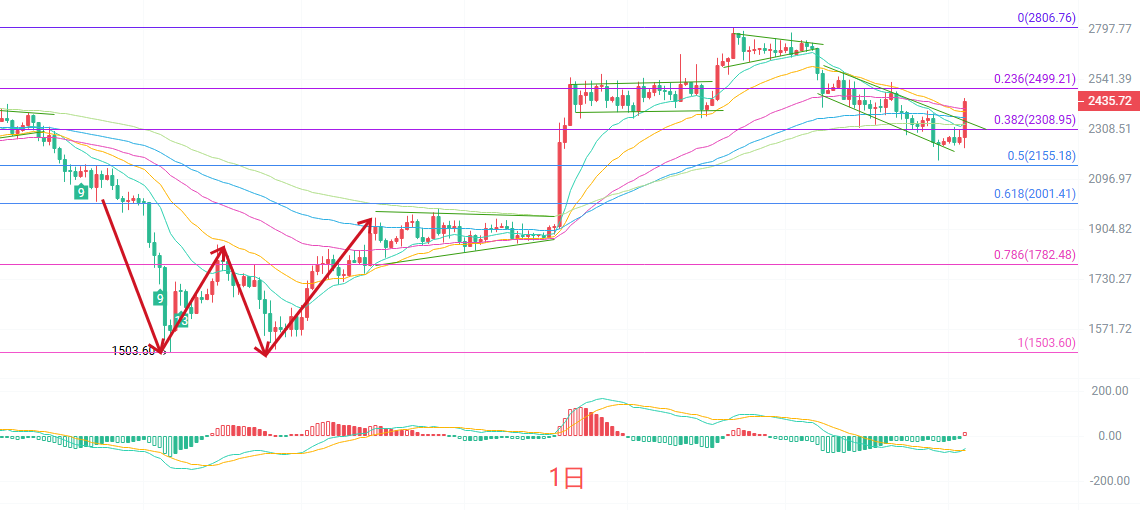
The daily candlestick shows an increase of 7.09%, directly standing above EMA15 at 2337 and EMA30 at 2391. The MACD’s DIF has already crossed above the DEA, which is the first signal of bearish momentum exhaustion at the daily level. The middle track at 2351 has already been stepped on, with upper track resistance at 2494, and lower support looking at the middle track of 2351 and the lower track of 2209. Conclusion: The daily chart has switched from a one-sided decline to an oversold rebound and a consolidation repair phase. Whether it can reverse or not will depend on whether 2494 can be effectively broken through.
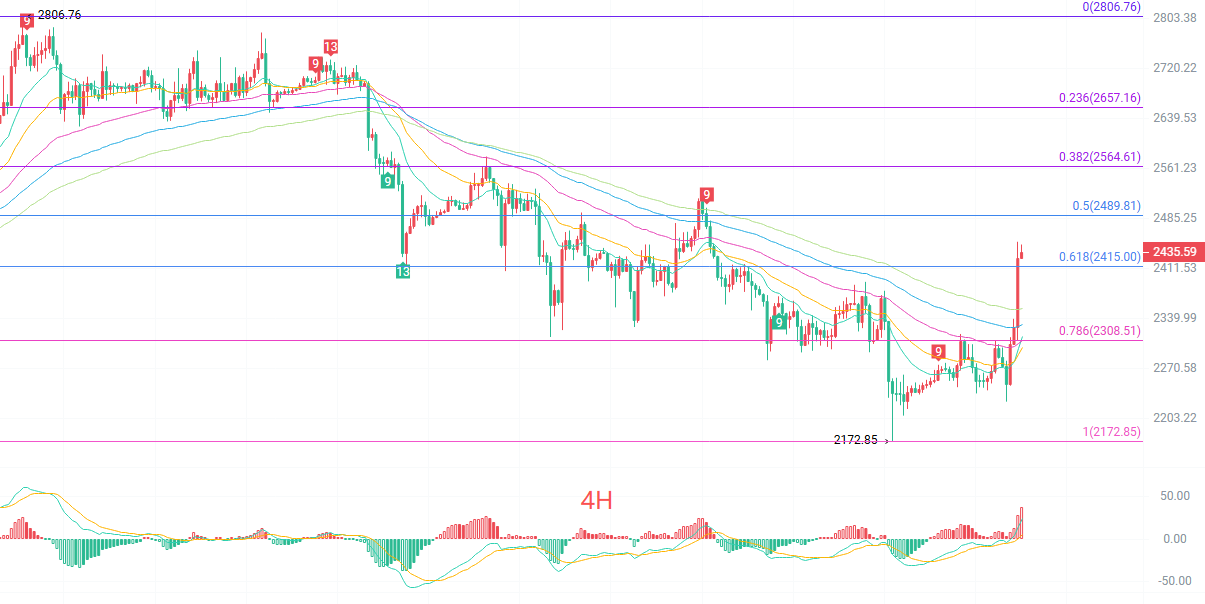
The four-hour candlestick has risen from the low point of 2172, rebounding all the way to create a beautiful bottom divergence in between: the MACD at around 2170 saw a new price low but the indicators did not follow, which is a typical bearish exhaustion structure. The five EMA lines have started to diverge upwards between 2298 and 2355 from a tangled state, and the price has already risen above all moving averages, with the MACD momentum still being released. The Bollinger Bands are opening upwards, with the upper band of 2393 already broken. However, it should be noted that this wave has risen a bit too quickly, with a large short-term deviation; the cost-effectiveness of chasing highs continues to decrease.
Short-term reference:
Northbound resistance at 2350 to 2370, stop loss at 30 points, target looking at 2450 to 2510.
Southbound stagnation at 2500 to 2530, stop loss at 30 points, target looking at 2450 to 2400.
Specific operations should primarily rely on real-time market data; for more details, you can consult the author. There may be delays in article release; suggestions are for reference only, and risks are to be borne by yourself.
Kind reminder: The above content is synchronously updated by the cryptocurrency academy on major trading platforms such as Binance, OKEx, Huobi, etc. For more content, you can add me as a friend on Binance OKEx to join my fan group.
免责声明:本文章仅代表作者个人观点,不代表本平台的立场和观点。本文章仅供信息分享,不构成对任何人的任何投资建议。用户与作者之间的任何争议,与本平台无关。如网页中刊载的文章或图片涉及侵权,请提供相关的权利证明和身份证明发送邮件到[email protected],本平台相关工作人员将会进行核查。