Cryptocurrency Scholar: 11.5 Bitcoin (BTC) went from despair to ecstasy in just 12 hours! Is the true market just beginning with the V-shaped reversal of Bitcoin?
This V-shaped reversal easily makes people FOMO, feeling as if they've missed a fortune and then chase at the peak; it also easily induces fear, thinking that the rebound is a scam, and then they sell at the bottom. My experience is that the more it gets like this, the more you should stick to the plan, writing down entry points, stop-loss, and target prices in advance—execute when the time comes, and wait otherwise. The market is not lacking in opportunities; it lacks the capital to survive and wait for the opportunities. At the level of 80,000, both bulls and bears have their reasons; the key is to manage stop-loss well and not turn trading into gambling.
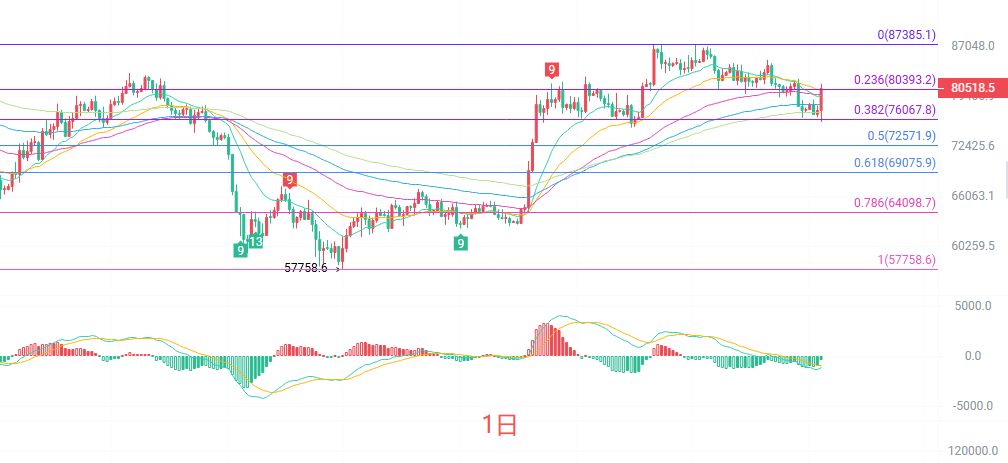
The daily candlestick shows a large bullish candle with a long lower shadow, with an amplitude exceeding 7%. From a technical perspective, the price has re-established itself above the EMA30 and EMA60, but is still operating above the EMA90 at 78224, and the mid-term moving averages are starting to flatten out. The MACD's DIF has turned upward above the zero axis, with green bars continuously shrinking, indicating a significant reduction in bearish momentum. The upper, middle, and lower Bollinger Bands are at 84283, 80280, and 76276 respectively, with the current price exactly at the middle band, representing a critical point for direction choice.
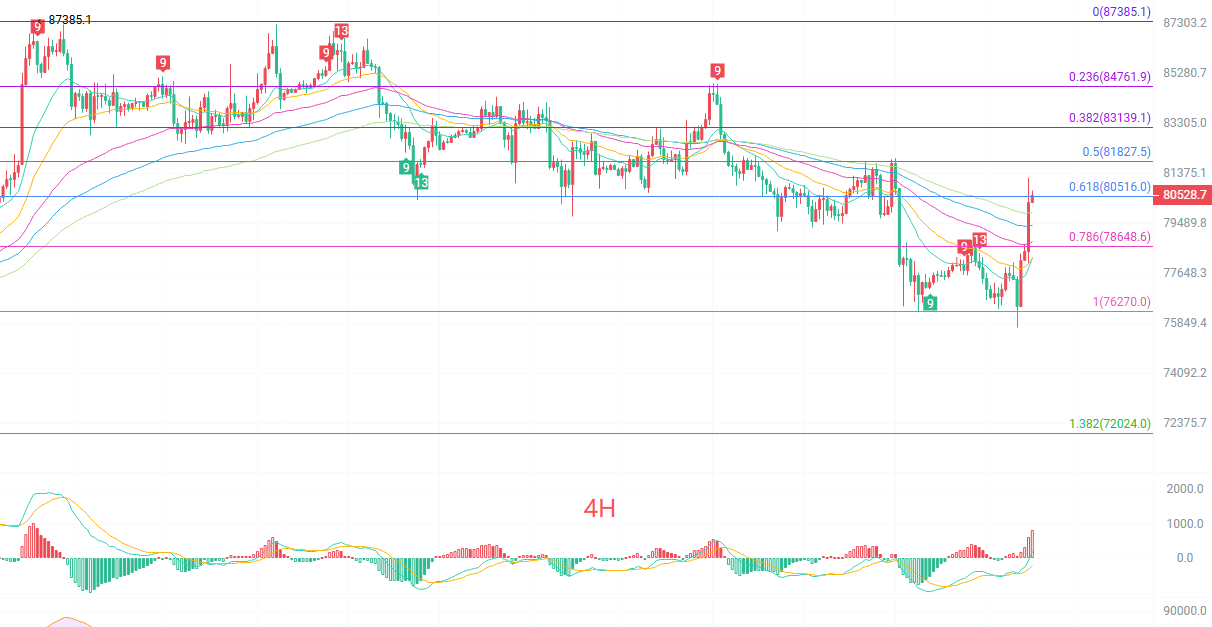
The four-hour candlestick wave rebound started from 74909, reaching a high of 80480, and is currently consolidating around 80400. The short-term EMA15 at 78231 and EMA30 at 78193 have crossed upwards, but the price has deviated quite far from the short-term moving averages, indicating a need for a pullback. The MACD has formed a golden cross below the zero axis, with bullish momentum still being released. The upper Bollinger Band at 79868 has been broken, with the price running outside the upper band, showing signs of short-term overbought. Pay attention to the range of 79500-80000; if a pullback does not break, the rebound can continue.
Short-term reference:
For upward movement from 79800 to 79300, resistance is encountered, with a stop-loss of 500 points, and a target of 82000 to 84000.
For downward movement from 82000 to 83000, stagnation occurs, with a stop-loss of 500 points, and a target of 81000 to 80000.
Specific operations depend on real-time data, and for more detailed information, you can consult the author; there may be delays in article publication, and it is recommended for reference only, with risks borne by the reader.
Warm reminder: The above content is synchronized and updated by the Cryptocurrency Scholar on major trading platforms like Binance, OKEx, Huobi, etc. For more content, you can add me as a friend in Binance OKEx and join my fan group.
免责声明:本文章仅代表作者个人观点,不代表本平台的立场和观点。本文章仅供信息分享,不构成对任何人的任何投资建议。用户与作者之间的任何争议,与本平台无关。如网页中刊载的文章或图片涉及侵权,请提供相关的权利证明和身份证明发送邮件到[email protected],本平台相关工作人员将会进行核查。