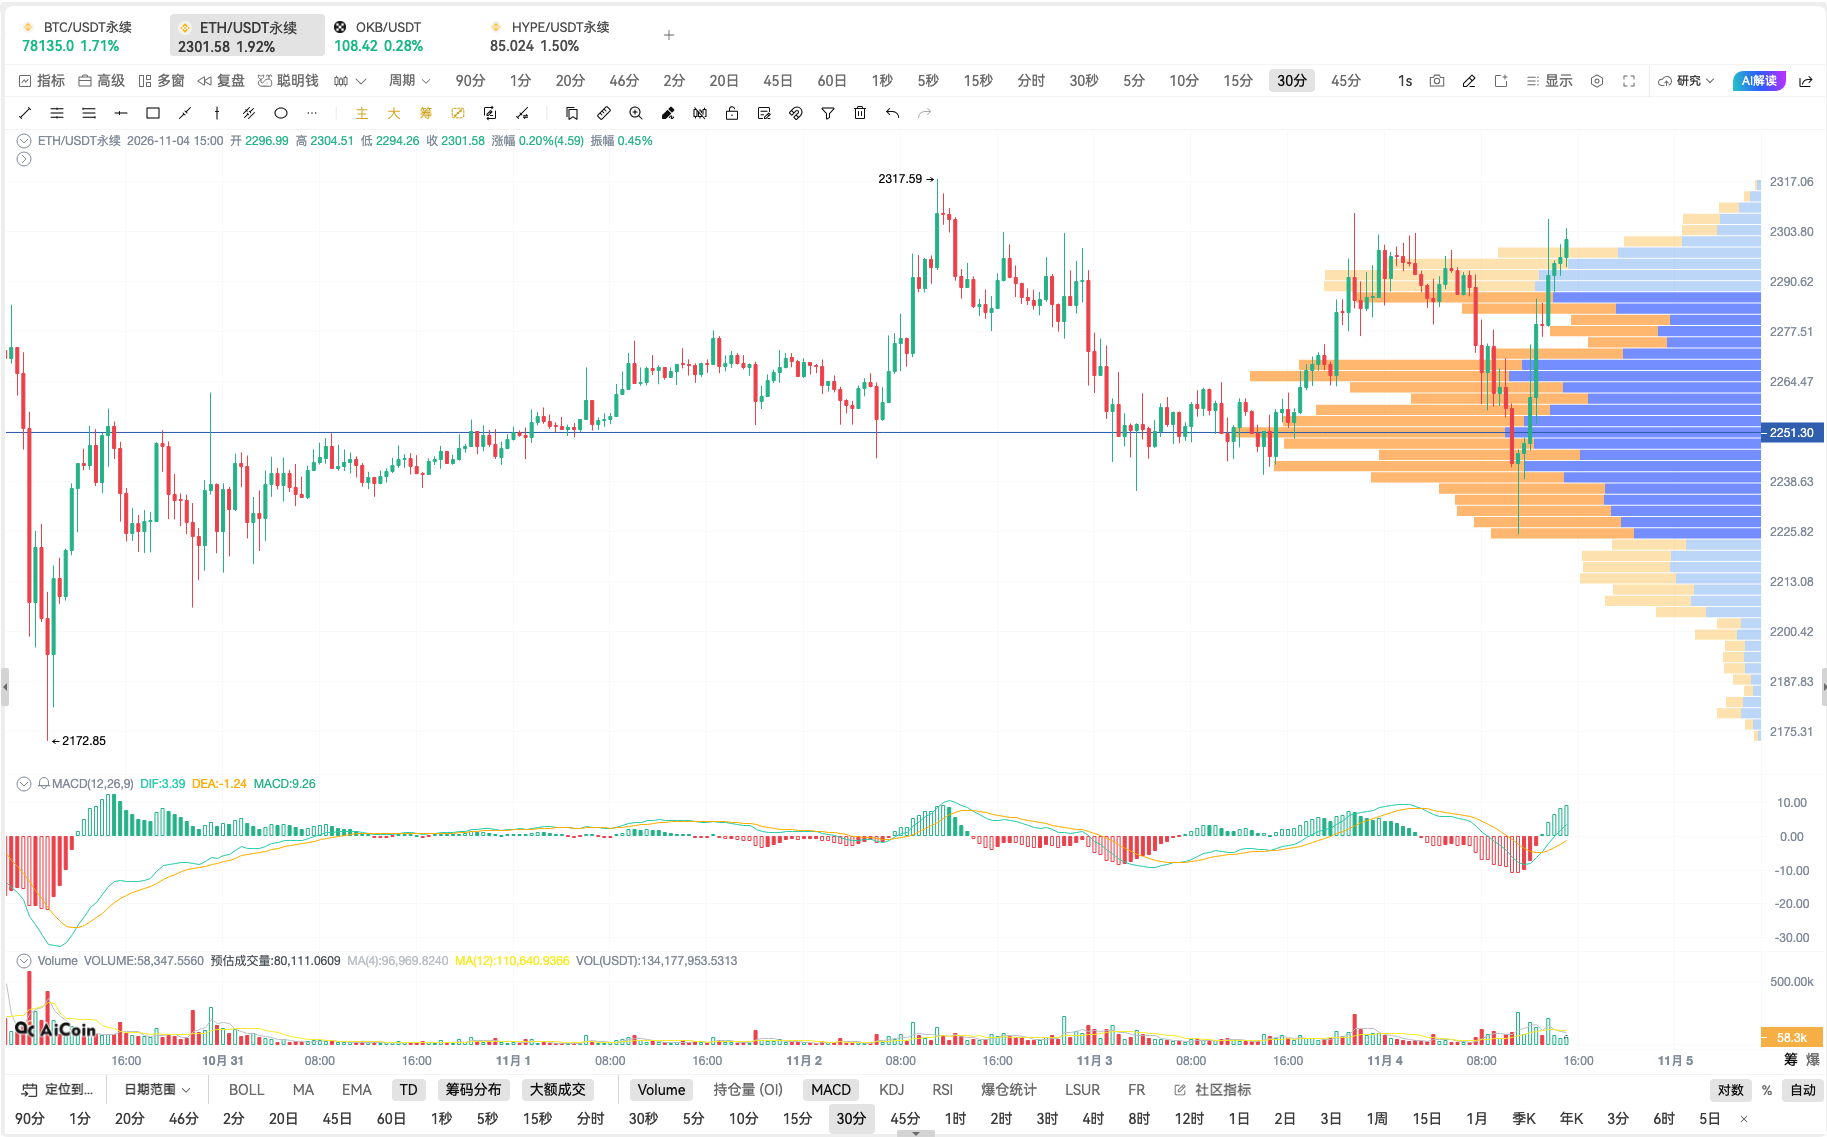
ETH quickly pulled back from around $2,250, with the latest quote at about $2,301.58, an increase of about 1.92%. More noteworthy is that this rebound occurred near a densely distributed trading area: the price once fell to around $2,251, then quickly reclaimed the lost ground.
What to read from the K-line chart: Quick recovery near support
The current price of ETH/USDT perpetual is about $2,301.58; the current K-line shows an opening at about $2,296.99, a high of about $2,304.51, and a low of about $2,294.26. Looking back in the chart, the phase low is about $2,172.85, and the phase high is about $2,317.59.
During this trend, ETH had clearly pulled back from above $2,300, then saw repeated trading and price pauses around $2,250; the most recent dip approached that area before quickly rebounding back above $2,300. The quick response of price to that area at least indicates there was some buyer support, which is a positive signal in the short-term structure.
However, "stabilizing" requires time and subsequent retests for verification. A single K-line representing a quick rebound can only confirm that a rebound has occurred, but it cannot prove that buyers have sustained control of the market. A more valuable test is whether the subsequent pullback can still hold near $2,250, whether the lows can be raised, and whether the price can continue to operate above the previously densely fluctuating area.
Why is the densely distributed area important, and why is it not an iron bottom?
The trading distribution on the right side shows that there is a relatively significant trading accumulation near $2,250 to $2,300, with a horizontal reference line marked at about $2,251.30. Densely traded areas usually indicate that more trades occurred near those prices during the selected statistical period. When the price returns to that area, market participants may reassess costs, profits and losses, and positions, so there may be support here, or it may turn into pressure after a breakdown.
However, trading distribution describes the trading activities of the past period; it does not guarantee future buy orders. It cannot directly tell us who holds the chips, whether the holders are still in the market, nor prove that a particular price will certainly hold. The so-called "chip support" is more accurately described as a segment worth observing as a potential supply-demand area. Only through continuous verification of price responses and subsequent trading behavior does it have practical analytical significance.
Around $2,251 can serve as an observation area, but it should not be packaged as a precise or necessarily effective bottom line. If the price can quickly recover after repeated pullbacks and gradually raise the pullback lows, the support judgment will strengthen; if the price falls below and cannot recover, the original support logic will need to be reassessed.
Whether the rebound can continue depends on whether the supply above is digested
ETH is currently back around $2,300, and the first thing to observe is whether it can effectively stabilize around $2,303—$2,305; the chart also shows a phase high area at about $2,317. If the price has trading cooperation and limited pullback when approaching these levels, forming higher lows, the rebound structure will gradually improve.
If the price encounters clear resistance after reaching the higher area and then drops back below $2,300, or even retests near $2,251, it suggests that buyers have not yet completed digesting the supply above. At this time, although the support triggered a rebound, it may not be sufficient to push the market into a sustained upward trend.
It is essential to avoid directly inferring "rebounds from support" to "there will inevitably be an increase next." A more rigorous judgment should be: the appearance of support in the area provides conditions for a rebound; whether the rebound can become the driving force of the trend depends on whether the price can reclaim the resistance above and maintain the established structure in the pullback.
Momentum indicators provide corroboration but cannot replace price confirmation
From the MACD perspective, the histogram has recently turned positive and expanded, suggesting that short-term momentum has improved compared to before. This corresponds with the price bouncing from around $2,251, serving as auxiliary evidence of short-term recovery.
However, MACD relies on historical price calculations, which may exhibit lagging after sharp rebounds and can vary repeatedly in fluctuating markets. If the price cannot continue and falls back below the support area, the improvement in momentum may fade quickly. Therefore, MACD should be viewed as corroborative evidence rather than a standalone buy signal.
Additionally, from a price perspective, ETH is slightly stronger than BTC, but a single snapshot is insufficient to prove continuous capital rotation or that ETH is independently strong. It is necessary to observe whether this relative strength can continue.
Three changes worth tracking next
First, whether the support retest is effective. If ETH drops to around $2,250 and the selling pressure weakens, with the price quickly recovering and gradually forming higher lows, it suggests that the support area is still functioning.
Second, whether the rebound surpasses near-term resistance. Whether the price can stabilize around $2,303—$2,305 and further challenge the area near $2,317 is a crucial observation point to determine if the rebound transitions from short-term repair to structural improvement. If the resistance area is broken, it still needs to be observed for a retest confirmation to avoid treating a brief breakout as a valid breakthrough.
Third, whether trading volume and momentum corroborate each other. If the rise is accompanied by improved trading volume, with MACD momentum maintained, and trading pressure reduces during pullbacks, evidence for the continuation of the rebound will be more complete; if the price rises lacks participation, or momentum quickly weakens, expectations for sustainability should be lowered.
Multi-account order placement: executing the validated plan more consistently
Market analysis answers the questions "what is happening currently and what conditions still need verification"; multi-account order placement solves the issue of "how to reduce repetitive actions between multiple accounts when traders already have a clear plan." The order of these two aspects cannot be reversed. Seeing ETH rebound in the chip dense area does not mean that all accounts should immediately synchronize to buy; participation and how to control risks still depend on the trader’s strategy.
The advantage of AiCoin's multi-account order placement is that it manages multiple API accounts within a single order process, reducing the need for switching between accounts and repeated input; at the same time, orders can be arranged according to the pre-defined ratios, allowing multiple accounts to act in cooperation as planned. For traders or teams managing multiple accounts, this helps improve operational efficiency and execution consistency. Feature introductions also include copy trading, position distribution, and other order modes.
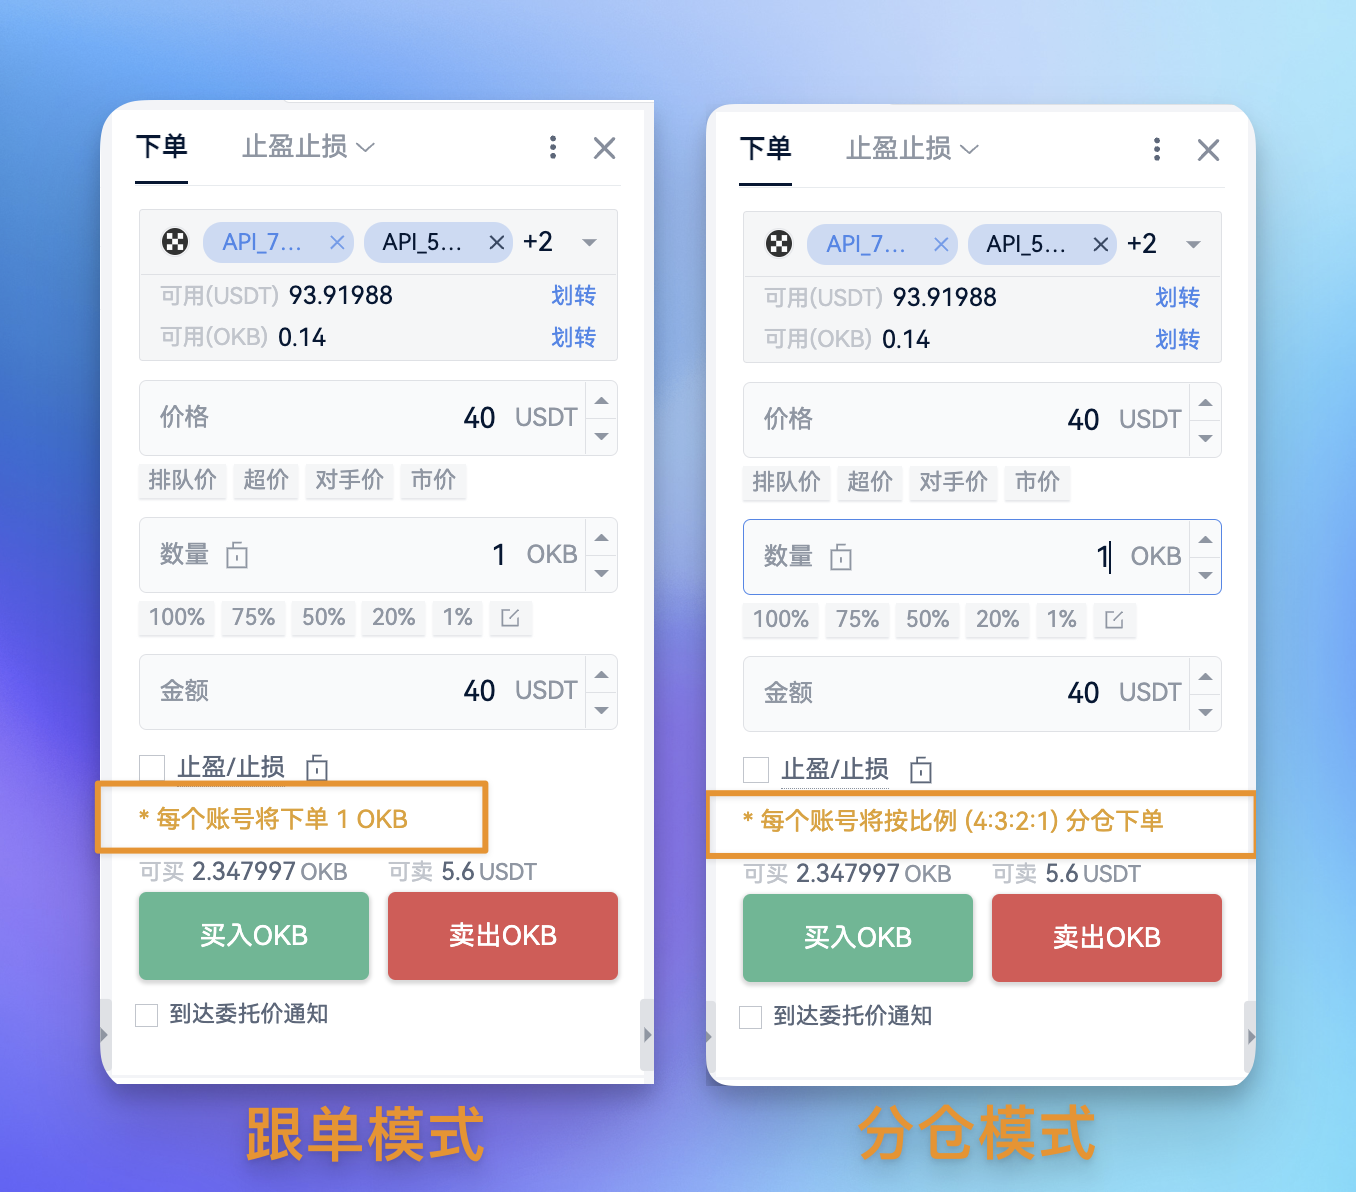
The copy trading mode is suitable for first setting a base order volume and then letting other accounts follow according to their respective proportions or multiples. It is applicable in situations where the same strategy needs to be executed across different accounts, but the account sizes or planned order volumes vary.
The position distribution mode is suitable for first determining the total volume to be executed by multiple accounts, and then distributing that total volume according to proportions for each account. It is more applicable for those who wish to control the total order volume while clearly defining the shares that each account bears. In simple terms, copy trading focuses on how accounts follow the base number, while position distribution focuses on how the total volume is split.
Steps for multi-account order placement
- Enable "multi-account order placement" on the AiCoin order panel.
- Select the API accounts involved in this plan and confirm the account, exchange, and authorization status.
- Select copy trading or position distribution mode according to the plan, setting account ratios or multiples. If different accounts have different balances, positions, or risk limits, each should be verified separately; do not mechanically apply the same ratios.
- Confirm the ETH/USDT trading pair, buy/sell direction, order type, and quantity. After establishing your triggering conditions and risk boundaries, submit the order.
- After placing the order, check the order status, execution conditions, and position changes for each account; make changes, cancellations, or subsequent position management as necessary.
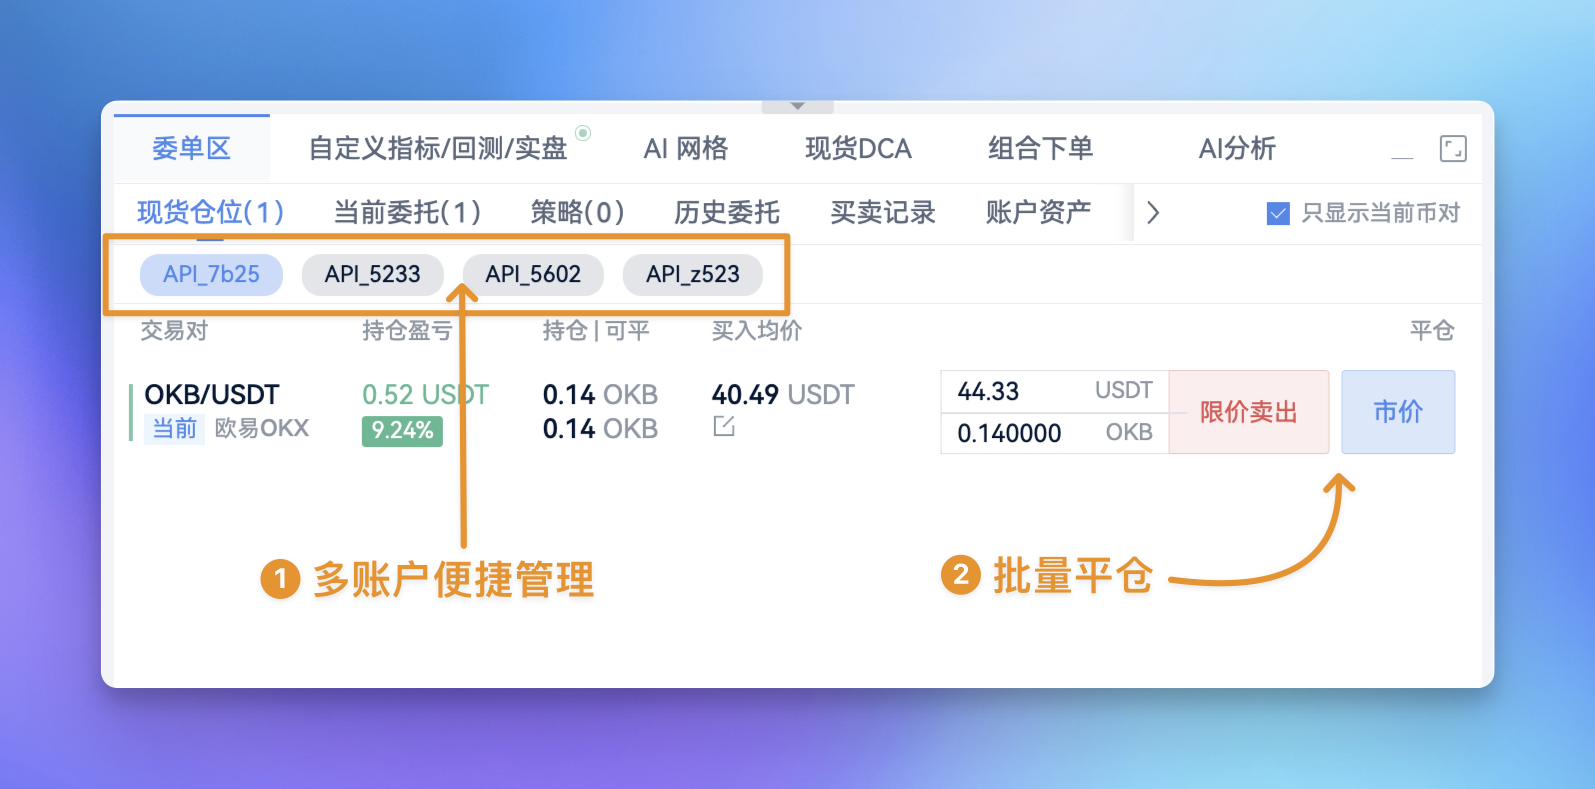
In the current scenario, if traders have already set phased participation plans and multiple accounts need to execute according to fixed ratios, they can use the copy trading mode to reduce repetitive input; if the total order volume is first determined and then allocated to different accounts, the position distribution mode can be used. The tools enhance execution efficiency but do not confirm that $2,251 will definitely hold, nor guarantee order execution or rebound continuation. When multiple accounts share the same directional risk, exposure may also increase simultaneously.
Conclusion: Support provides rebound conditions; subsequent structure determines the strength of momentum
ETH has shown support near the densely traded area at about $2,251, with the price quickly rebounding from around $2,250 to above $2,300; the MACD histogram turning positive also provides auxiliary evidence for short-term momentum improvement. These factors support the observation that "the support area is functioning."
However, "stabilizing" still requires confirmation through retests, and "rebound momentum" must be confirmed by breaking through resistance and subsequent trading. If the price holds above the support, forms higher lows, and digests the supply around $2,303—$2,317, the rebound logic will be more complete; if the support fails or the upward movement continues to face resistance, reassessment will be needed.
For multi-account traders, it is essential to first establish judgments using price, trading distribution, and momentum, and then execute based on the copy trading or position distribution plan using AiCoin multi-account order placement, which is the correct integration of tools and market analysis.
AiCoin's exclusive "Multi-account Order Placement" super tool
One-click synchronous ordering for multiple accounts, enabling millisecond-level multi-order operations with AiCoin; it also supports cross-exchange multi-account ordering:
https://www.aicoin.com/zh-Hans/tg/multi-account

Don't wait any longer, start using it and open the fast profit plan!
免责声明:本文章仅代表作者个人观点,不代表本平台的立场和观点。本文章仅供信息分享,不构成对任何人的任何投资建议。用户与作者之间的任何争议,与本平台无关。如网页中刊载的文章或图片涉及侵权,请提供相关的权利证明和身份证明发送邮件到[email protected],本平台相关工作人员将会进行核查。