Today, let's return to the market on November 3, 2026, to discuss where this round of adjustments has reached. The prices and screenshots in the text correspond to the market on that day.
On October 13, I talked to everyone about a session titled "Three-Day Line Dead Cross, Is It Still the Beginning of a Bull Market?"
At that time, my judgment was that the adjustment had extended from a short cycle to a medium cycle, and the market needed more time to digest.
Looking back at this trend, after the three-day line dead cross, the five-day line soon followed with a dead cross.
Comparing it to the current K-line, if the rebound continues to lack strength, I tend to believe that the weekly line may also form a dead cross subsequently, and the time for this round of oscillation will be extended. For friends who plan to gradually accumulate spot positions, this period also conveniently gives us a window to lay out chips at a relaxed pace.
Let's first look at the screenshots left from the last live broadcast.
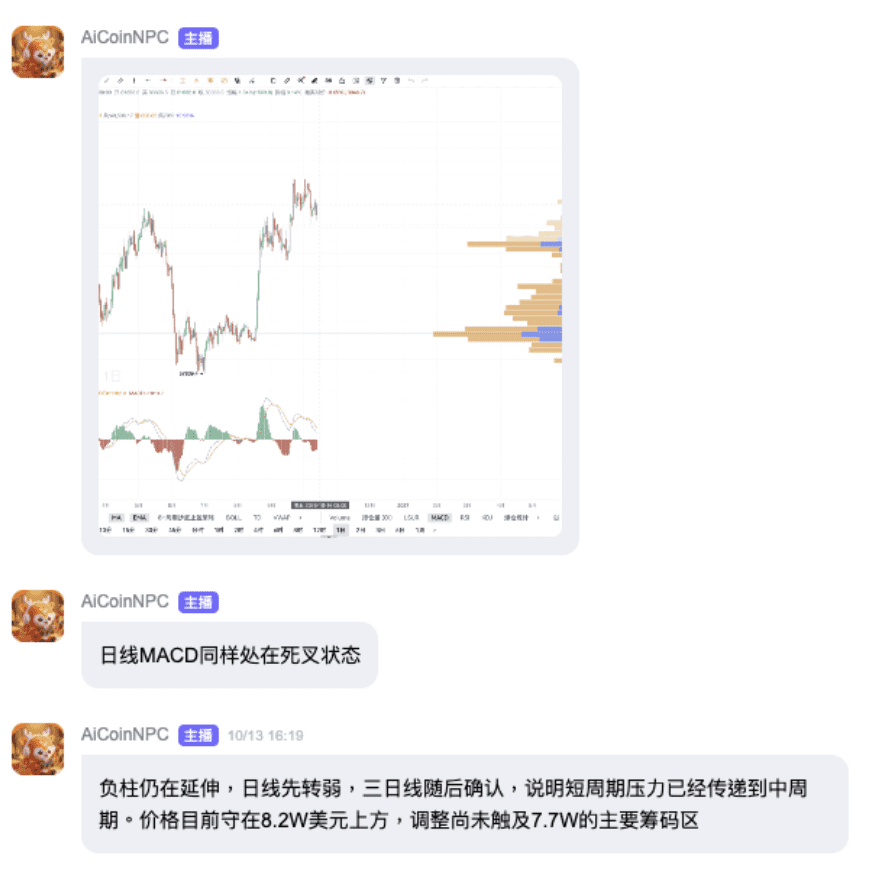
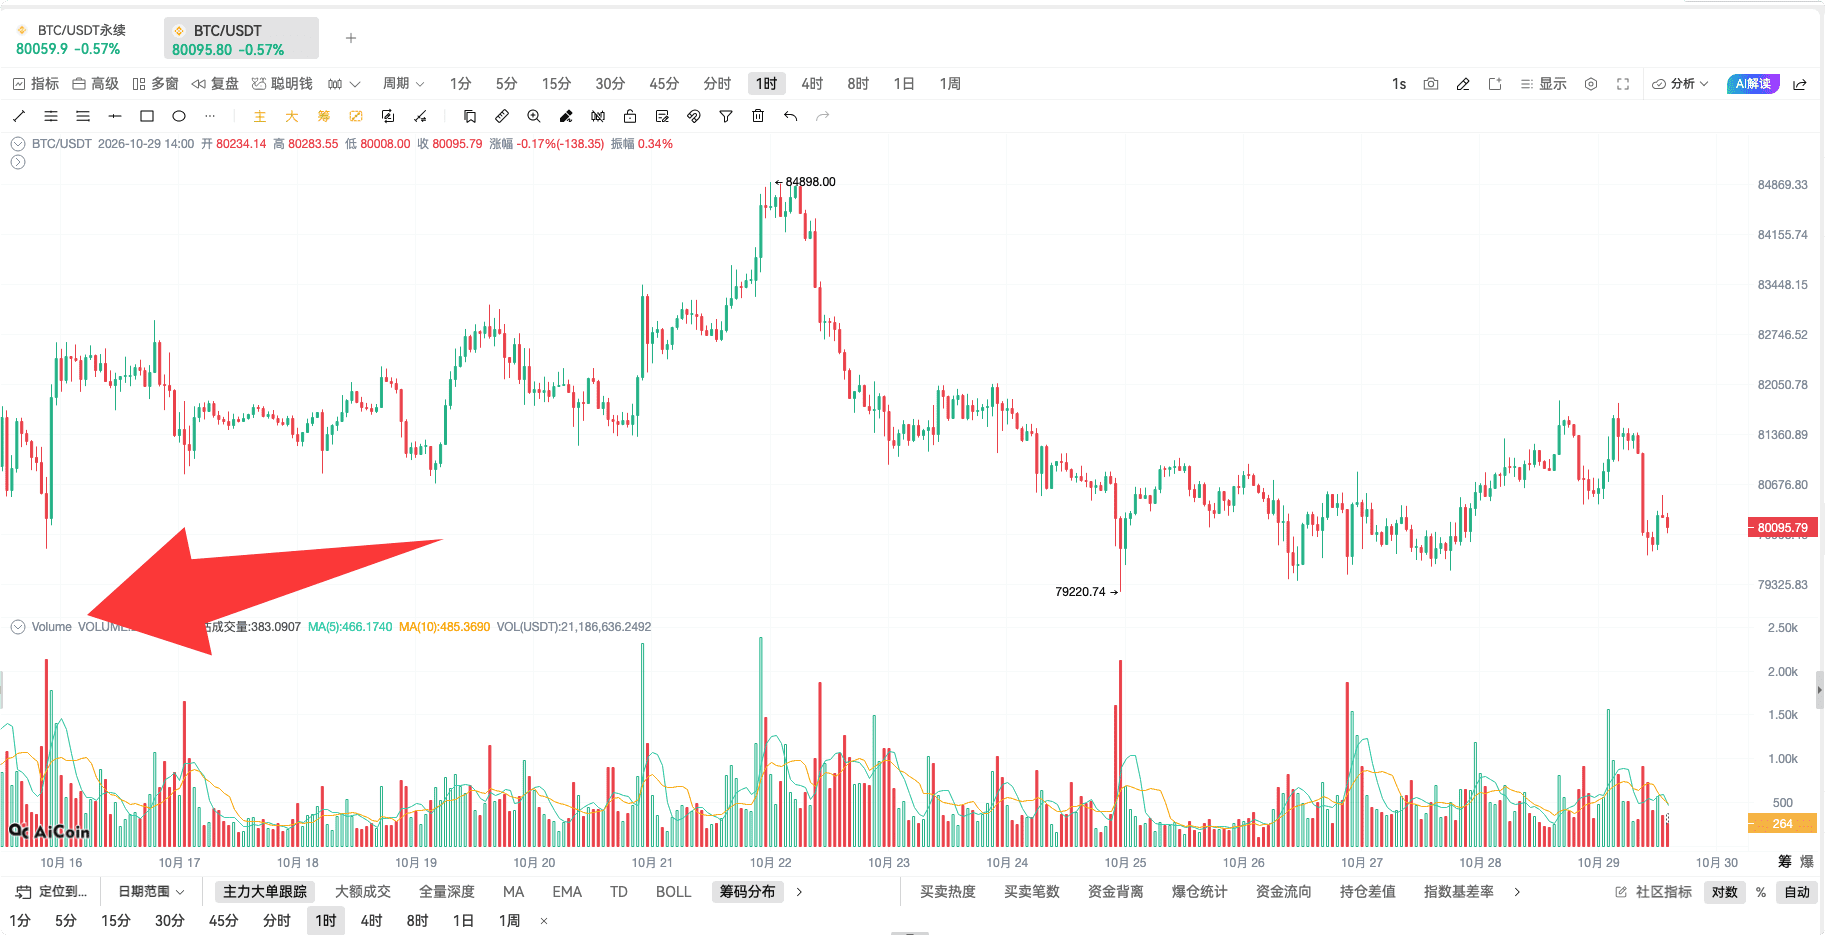
On October 13, I mentioned that the daily MACD had begun to weaken, and then the three-day line confirmed the dead cross, indicating that the pressure from the short cycle had transmitted to the medium cycle. At that time, the BTC price was still above 82,000 USD, and the adjustment had not reached the 77,000 area we have been closely monitoring.
Now the price is around 77,200 USD, and the five-day line MACD has completed its cross, with the previous closing bar also turning negative. The elongation of the adjustment we were previously concerned about is now clearly reflected in the market.
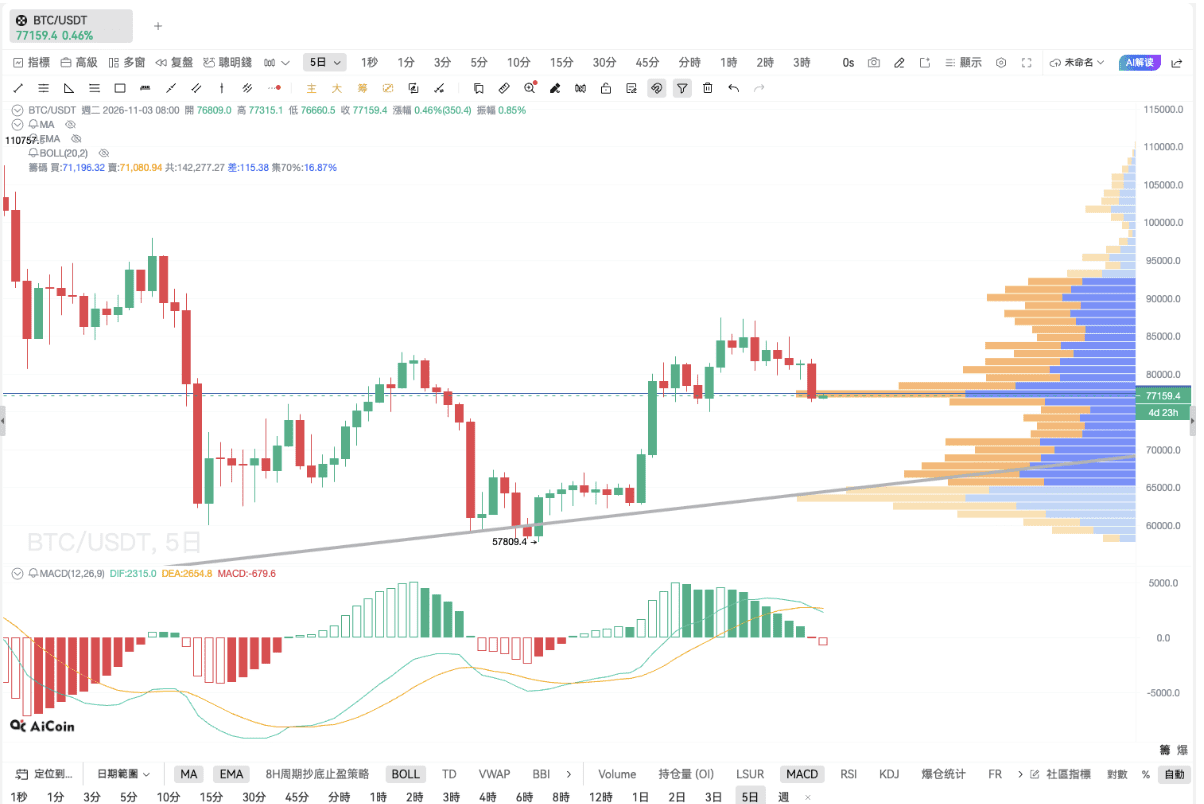
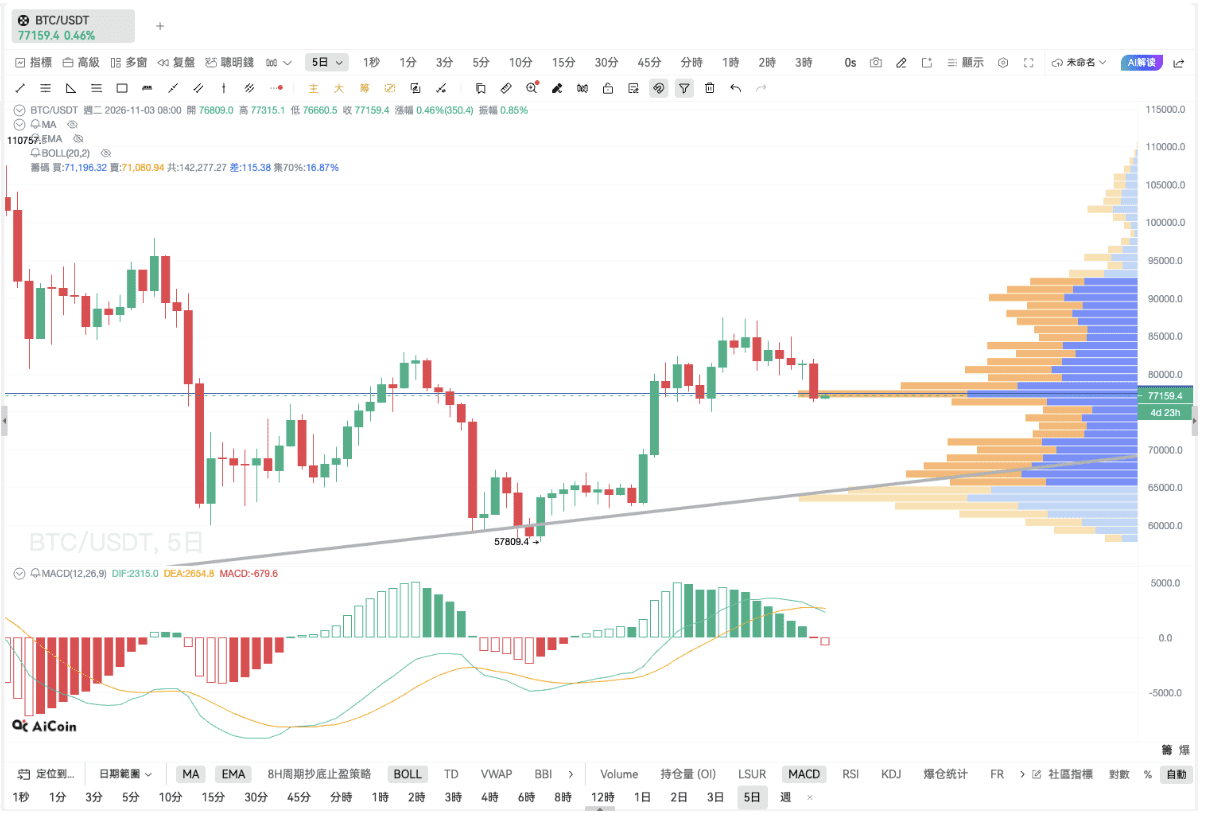
In this chart, it is clear that the MACD of the BTC five-day K-line has already formed a dead cross. Here, it is important to clarify that after the three-day line dead cross, it does not necessarily mean that the five-day line and the weekly line will follow in order to form dead crosses. As long as the price can strengthen in a timely manner, there is a chance for larger cycle technical signals to be repaired or reversed.
However, this rebound has shown weak strength, and the price continues to decline, slowly manifesting a weakened state on the five-day line.
Looking at the far-right side of the weekly line, the positive bars are consistently shortening, and the distance between the fast and slow lines is also continuously narrowing. If the price oscillates back and forth in this range without a strong upward correction, I lean towards the weekly line also forming a dead cross subsequently.
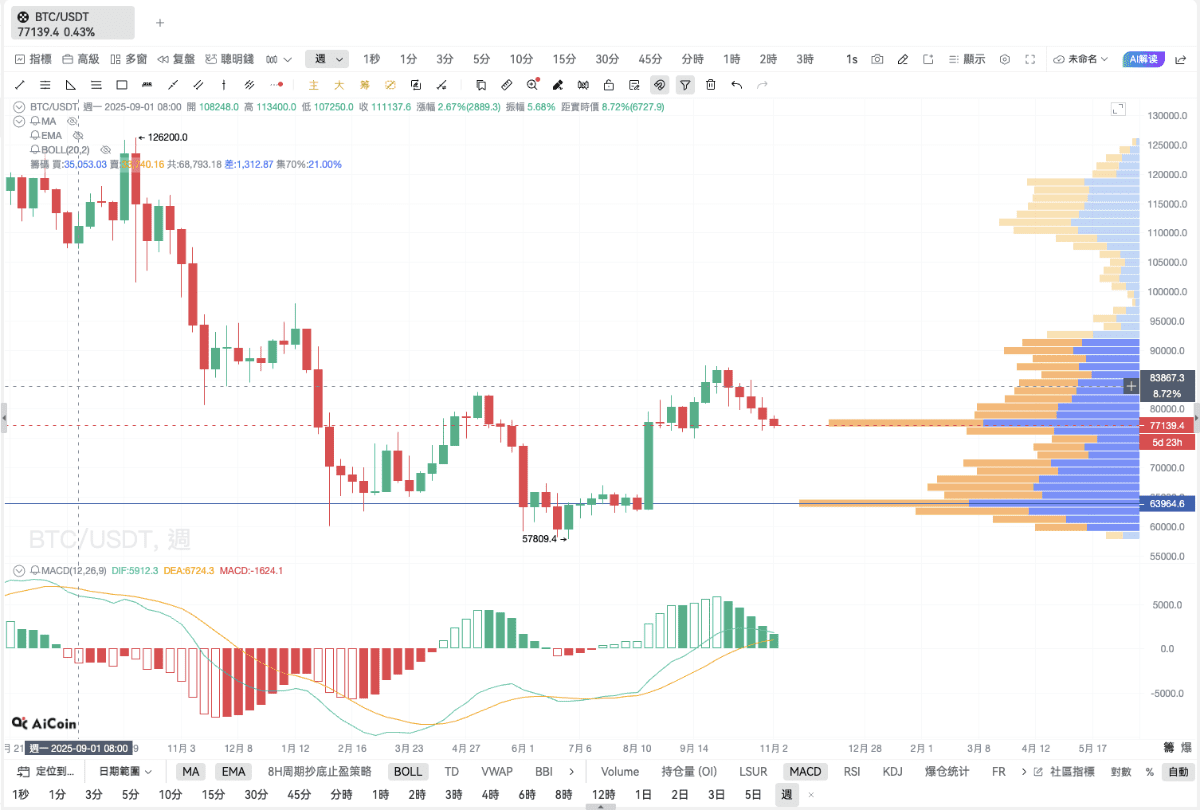
Let's shift our perspective to the daily line level.
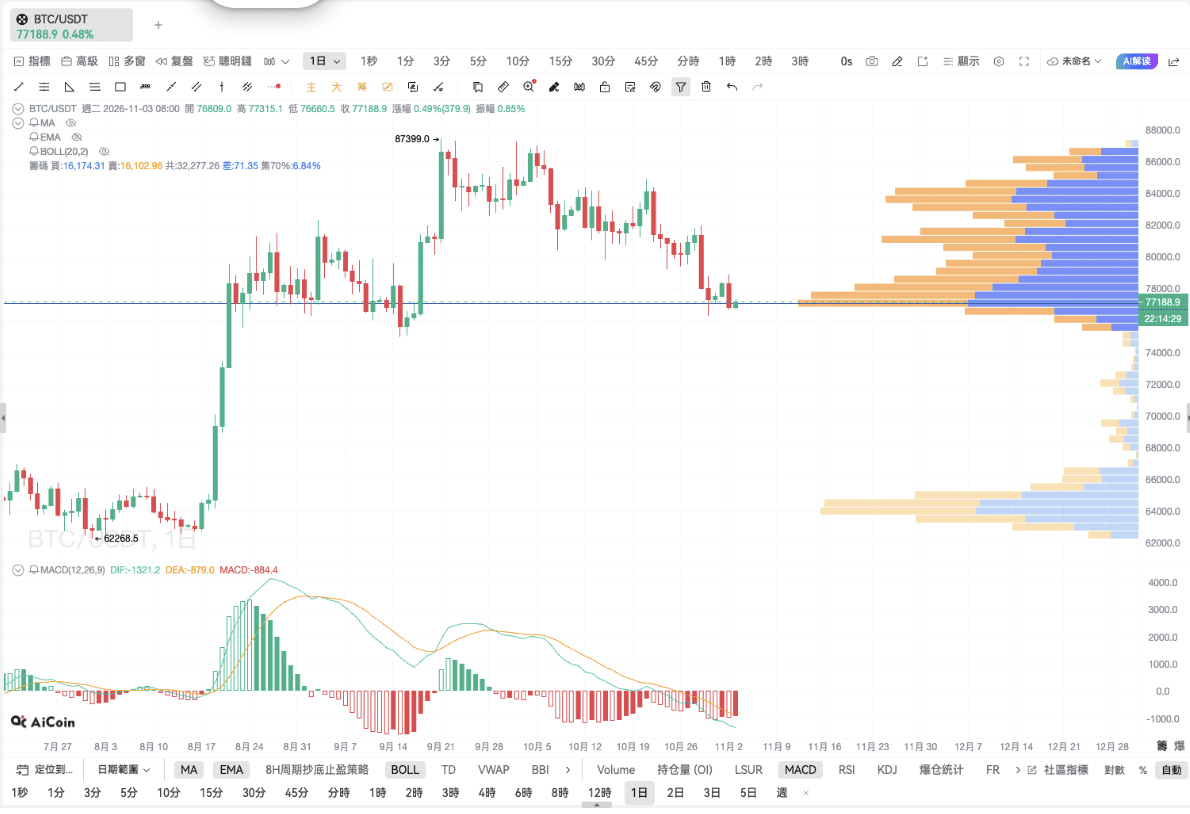
From the high point of 87,399 USD marked in the chart to the present drop, the retracement has approached twelve percent. The daily MACD double line has fallen below the zero axis, and the price has not shown enough strength to end this downward trend.
Next, let's discuss key levels to monitor in the upcoming market. In the short term, we should first focus on the contention around 77,000. We have been paying attention to this area for a while; now that the price has arrived here, the market's performance at this level holds more reference value than merely drawing lines for predictions, as chips have also been entrenched at this level for a long time.
In the four-hour chart, the previous low is around 76,265 USD, and the POC point marked above is approximately 78,078 USD, the position where most four-hour cycle chips are concentrated, which can be seen as a pressure line at the four-hour level.
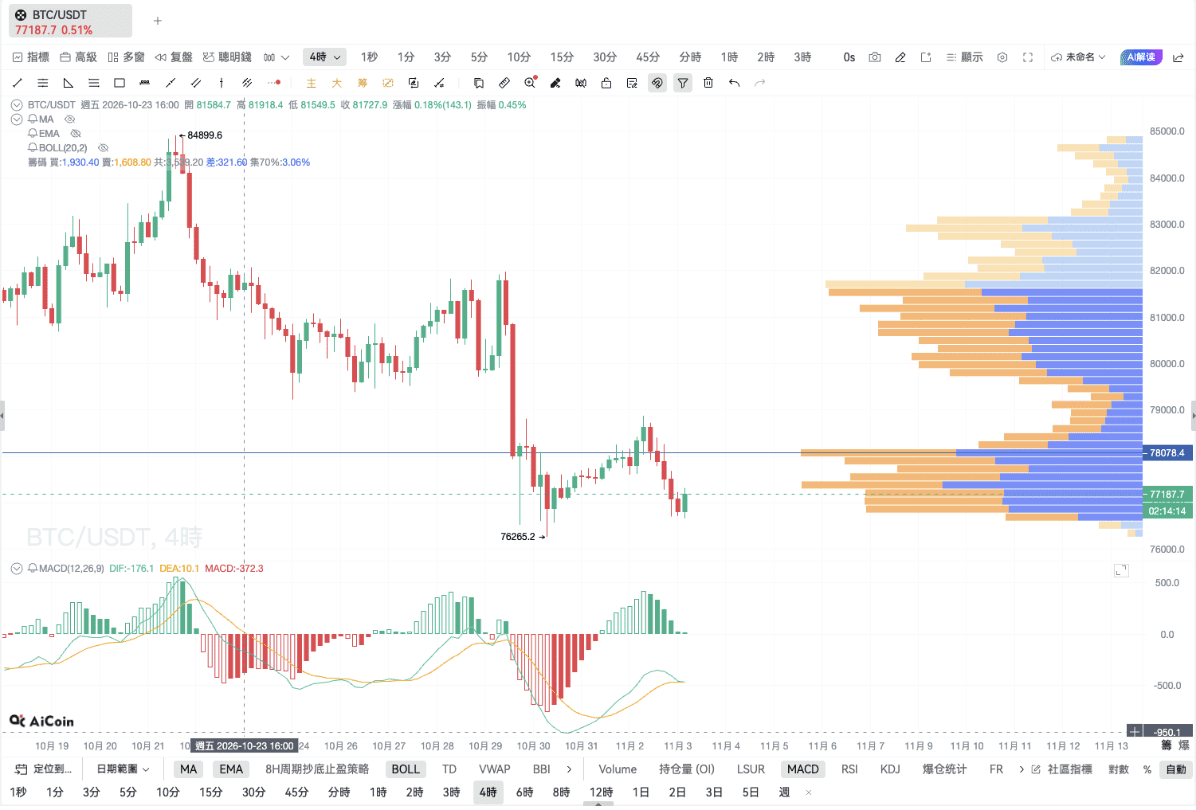
If the price can hold above the previous low of 76,000 and re-establish itself around 78,000, it will provide a basis to continue observing the possibility of a rebound and repair. If multiple upward attempts are also unable to break through, it indicates that the selling pressure above remains strong.
Once this previous low is breached and cannot be reclaimed for an extended period, we must prepare to look for new support below, and the earlier low area around 75,000 can be included on the observation list.
Of course, there is also a potential variable. If hacker-related events continue to escalate, and exchanges are affected one after another, the market can easily experience sharp drops and erratic fluctuations, and we would need to wait for the situation to stabilize before reassessing the subsequent repair pace.
In November, there is another funding variable I will pay attention to: the market was discussing the expectation that Anthropic might go public in mid to late November. The specific timing cannot be ascertained from this, but I am concerned that if large-scale IPOs are approaching, will they attract funds to adjust positions in advance, diverting purchases from other risk assets?
I also drew an analogy to the concerns about capital diversion related to SpaceX, wanting to remind everyone to pay attention to potential capital competition; this analogy itself does not prove that funds have flowed out. Coupled with the U.S. midterm elections and the subsequent impacts of the hacker incident, I tend to believe that this round of oscillation will continue to extend; if the market seeks an immediate and smooth upward movement, patience in waiting is highly likely.
Those who have been following me for a long time should understand that I have repeatedly said that as long as BTC does not fall below 76,000, I will maintain my judgment of the bull market's beginning. Now that the price has reached this critical level, it is time to test this judgment.
If we can hold above 76,000 throughout November, I will seriously consider increasing my investment efforts.
However, for now, I still tend to adopt a wait-and-see approach, waiting for a suitable low point to enter gradually, first observing whether this 76,000 level can withstand the test, and then adjusting the subsequent position arrangement according to market changes.
During this time, what is being tested is everyone's money management and patience.
Let's talk about another asset closely related to BTC: MSTR. Many people refer to it as leveraged BTC.
First, let me clarify its profit logic along with the hidden risks of loss.
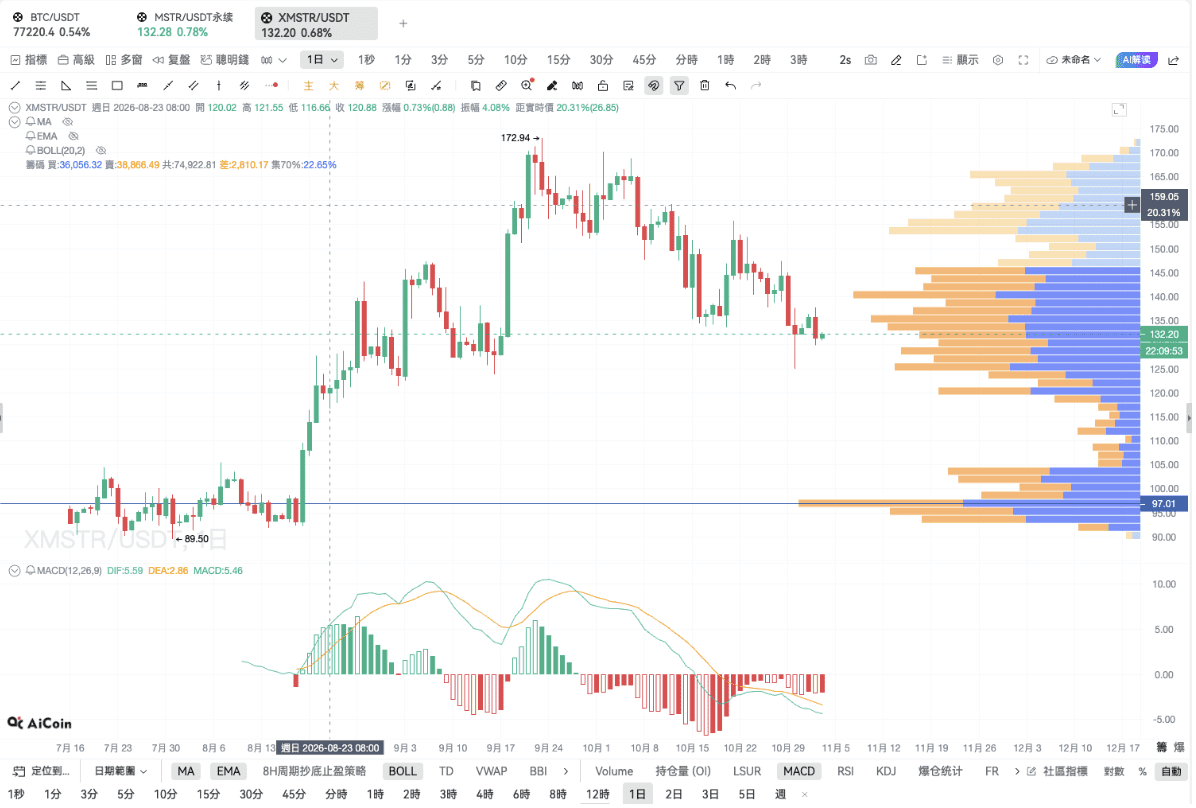
MSTR is the stock code for Strategy; this company was previously named MicroStrategy. Simply put, it is a publicly listed company that holds a large amount of BTC while continuously raising funds through the capital market. Buying its stock essentially means investing in this company, and the BTC holdings in the company will directly influence its asset value.
Today, we are looking at XMSTR/USDT, which is the tokenized product tracking this stock on OKX and can be traded directly using USDT. It offers exposure to the stock price but holding XMSTR does not grant the same rights as directly being a shareholder in the company.
There is also the MSTR perpetual contract, which comes with leverage and funding fees. When placing orders, everyone must distinguish which type of product they are trading.
Many are curious about why the gains of MSTR might be greater than those of BTC?
The core reason lies in the fact that the company will raise funds through issuing bonds and preferred shares, and use the funds obtained to allocate assets. Ordinary shareholders can only enjoy the value of net assets after deducting the claims of debt and preferred stock from the total asset value.
This explanation might sound a bit abstract, so let me illustrate it with a simple example.
Assume a company holds BTC worth 100 units and has 20 units of debt. The net assets corresponding to the ordinary shareholders would be 80 units.
If BTC rises by 10%, the company's assets become 110 units, and the debt temporarily remains at 20 units. The net assets corresponding to shareholders would increase from 80 units to 90 units, with a growth rate of 12.5%.
Conversely, if BTC falls by 10%, the assets shrink to 90 units, and after deducting the 20 units of debt, the net assets for shareholders would be only 70 units. Compared to the original 80 units, the decline rate is also 12.5%.
You can see the difference, right? The same 10% fluctuation in BTC causes a more pronounced effect on the asset value represented in shareholders' hands.
In reality, the company's financing structure is much more complex; this is just a simplified example to explain the underlying principle. Moreover, stock prices have another layer of pricing logic, which is how much the market is willing to value this net asset. When the market is optimistic about its financing ability and prospects for development, it will provide a higher premium; once expectations cool down, this premium will also quickly contract. Therefore, there is no fixed two or three times volatility relationship between MSTR and BTC; it is possible for MSTR to underperform even when BTC is rising.
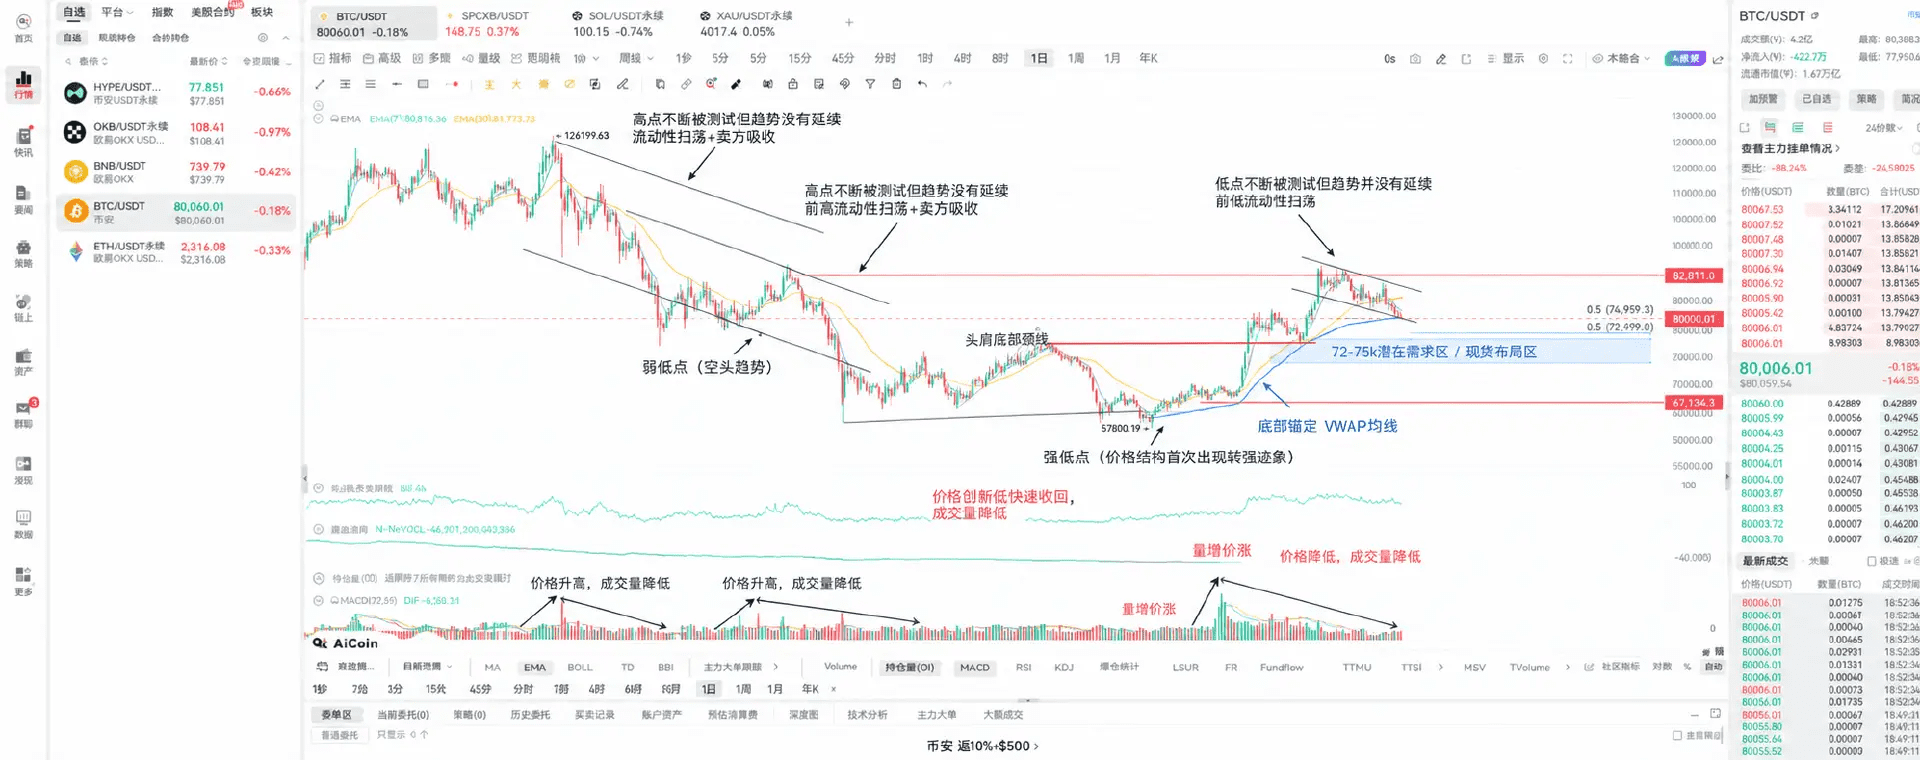
Now let's take a look at the daily chart of XMSTR.
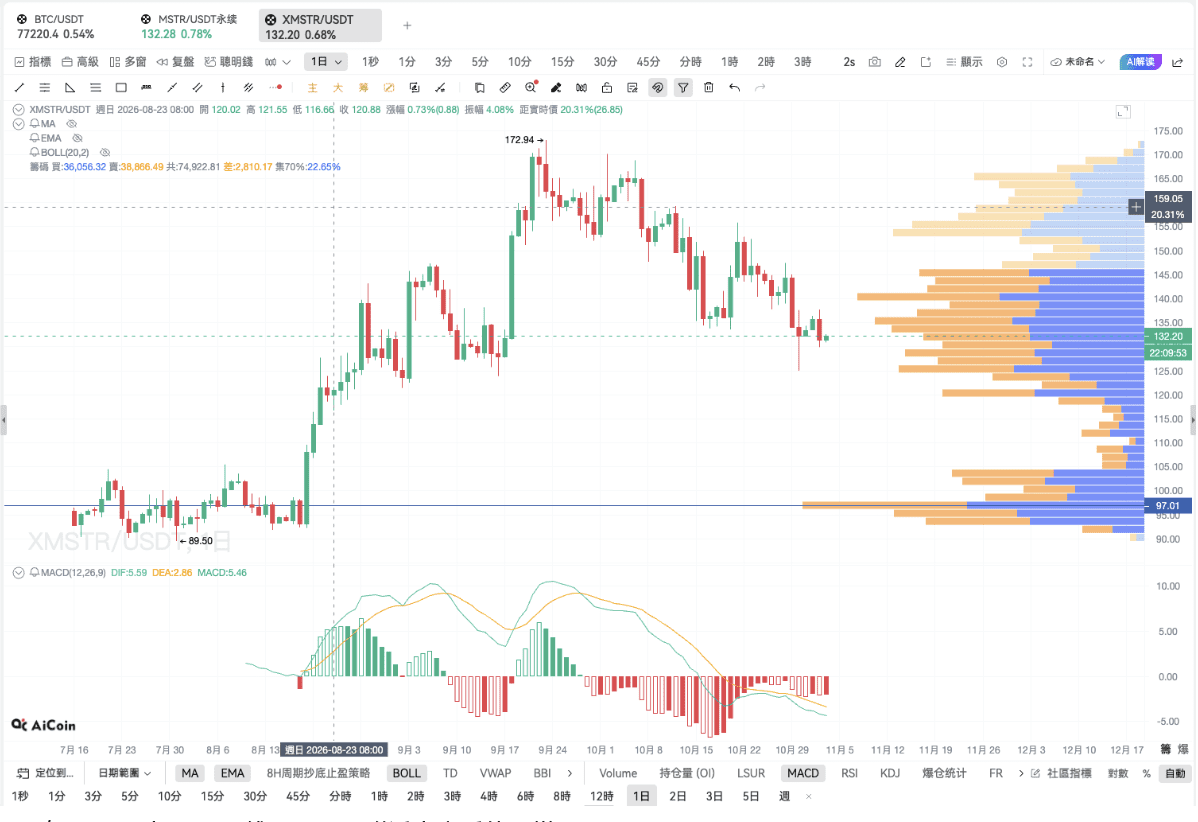
The peak in the chart is 172.94, while the price in the screenshot was around 132.2, with a retracement of nearly 24%; meanwhile, BTC fell from 87,399 to about 77,200, with a retracement of nearly 12%. The starting and ending times of these two trends are not the same, and we cannot conclude that MSTR is exactly double the leverage of BTC, but this comparison can intuitively show everyone how much price volatility must be endured when trading these types of products.
Therefore, when researching MSTR, in addition to determining the direction of BTC, we must also continue to monitor the company's financing plans and the current valuation level for buying in.
If you want to check the latest news on MSTR, you can directly search for keywords like [MSTR] or [Strategy] on the PC side, and find relevant news and announcements.
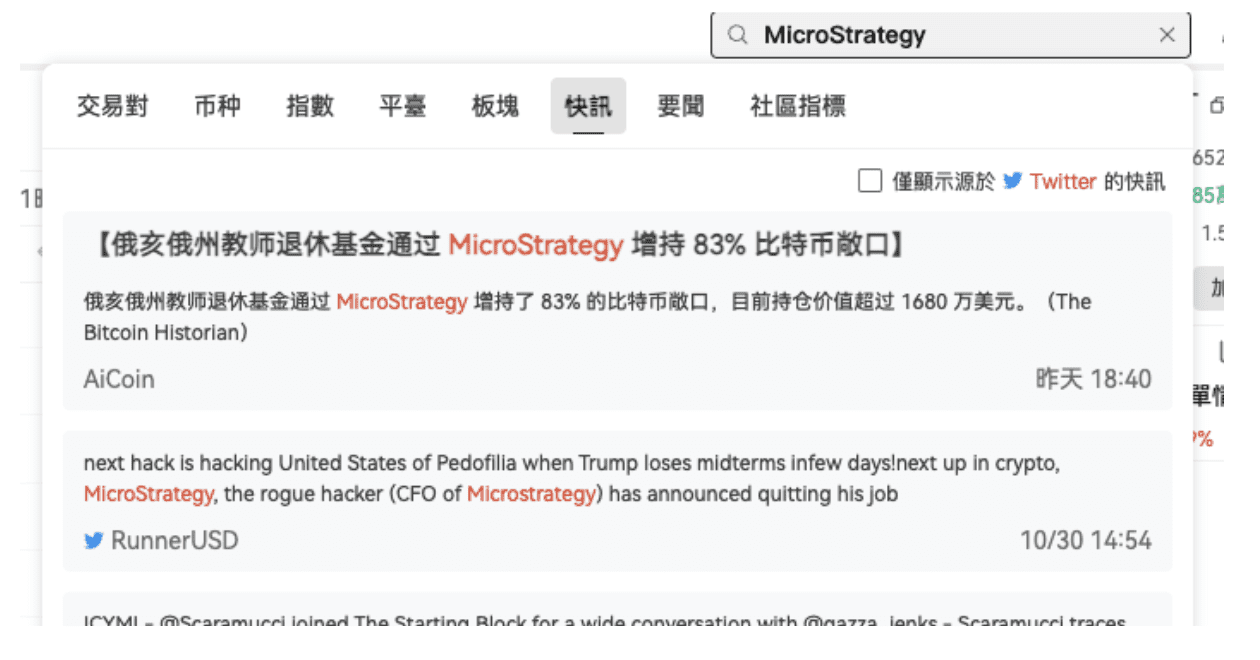
Combining MSTR, let's look at a piece of news that was noticed that day.

This post has not yet been independently verified here. It mentions that the Ohio State Teachers Retirement Fund, with a management scale of about 110 billion USD, has increased its exposure linked to BTC via MSTR by 83%, with related holdings exceeding 16.8 million USD.
Seeing the retirement fund and the 83% increase, many will naturally wonder if long-term funds are starting to significantly position in BTC-related assets?
This news is indeed worth continuous tracking, but we must look at the proportion of the positions. Just roughly comparing the 16.8 million USD mentioned in the post with the 110 billion USD, the ratio is about 0.015%. The post states "more than 16.8 million USD," which is not an accurate holding weight, and it also needs to be validated in conjunction with the fund's disclosure. In other words, even if this position experiences significant fluctuations, the overall impact on the entire fund is actually very limited.
This point is very valuable for us individual investors. When seeing news about institutions entering the market, it is easy to follow the impulse to buy in, while neglecting the huge gap in funding allocation ratios. Institutions may only use a very small portion of funds in their combination to participate in BTC assets, whereas we as individuals might bet a majority of our positions, thus bearing a completely different level of overall risk.
Many friends might ask, what reference significance does this news still have?
In my view, it is a sample of institutional participation worth continuous tracking. BTC-related assets are slowly entering part of traditional portfolios through securities channels, and MSTR is one of the pathways. If we can see more and more institutions continuously raising their allocation ratios in subsequent reporting periods, the evidence for this layout trend will become stronger.
Even if we hold a long-term positive view on BTC, we also need to think about the available cycle of these funds. If the funds are to be used in the short term, even if the long-term directional judgment is correct, it is difficult to withstand the intermediary oscillations and adjustments.
Returning to today's market, my core viewpoint has not changed: as long as it has not fallen below 76,000, I will continue to maintain the judgment of the bull market's beginning.
However, from the three-day line dead cross to the five-day line dead cross, it has already indicated that this round of adjustment is more tedious than before. Whether the weekly line will show a dead cross next and whether the 76,000 support can hold are signals I will continue to monitor and observe.
My current thinking remains to adopt a wait-and-see approach, waiting for the appropriate low points to gradually invest. If we can hold above 76,000 throughout November, I will consider increasing the investment strength.
The essential difference is still in the funding cycle; institutions can pull out a very small portion from a large long-term portfolio to allocate funds, calmly accepting price fluctuations in between. Their investment cycles can be stretched long enough.
There are live broadcasts every day, and I welcome everyone to continue following our friends at AiCoin! Book in advance 👇
https://www.aicoin.com/zh-Hans/live/list?tab=upcoming
Join our community, discuss together, and become stronger together!
Official Telegram community:
AiCoin's Chinese Twitter:
Hype Rebates:
https://app.hyperliquid.xyz/join/AICOIN88
Binance Rebates:
https://jump.do/zh-Hans/xlink-proxy?id=3
Invitation Code: aicoin668
Coinbase Rebates:
https://jump.do/xlink?checkProxy=true&proxyId=25
Invitation Code: Y8L23JL
免责声明:本文章仅代表作者个人观点,不代表本平台的立场和观点。本文章仅供信息分享,不构成对任何人的任何投资建议。用户与作者之间的任何争议,与本平台无关。如网页中刊载的文章或图片涉及侵权,请提供相关的权利证明和身份证明发送邮件到[email protected],本平台相关工作人员将会进行核查。