Let’s begin by discussing two major news stories that cannot be overlooked today. The first story is the revelation of details regarding the theft case of $6.3 billion from Binance. A fake job posting used an AI tool for intrusion, and although the official entity has compensated for 98% of the assets, the impact of such a massive security incident on the trust in centralized exchanges is tangible, with short-term capital outflow and panic selling pressure that cannot be ignored. The second story is the liquidation of $367 million across the entire network in 24 hours, with long positions accounting for nearly 80%. This indicates that long leverage has been heavily purged in this recent decline, and market sentiment is quite weak. When you add in the geopolitical tension with Iran threatening to blockade the Strait of Hormuz, risk aversion sentiment rises, putting overall pressure on risk assets. With these three factors combined, today’s BTC market is bound to be unsettled.
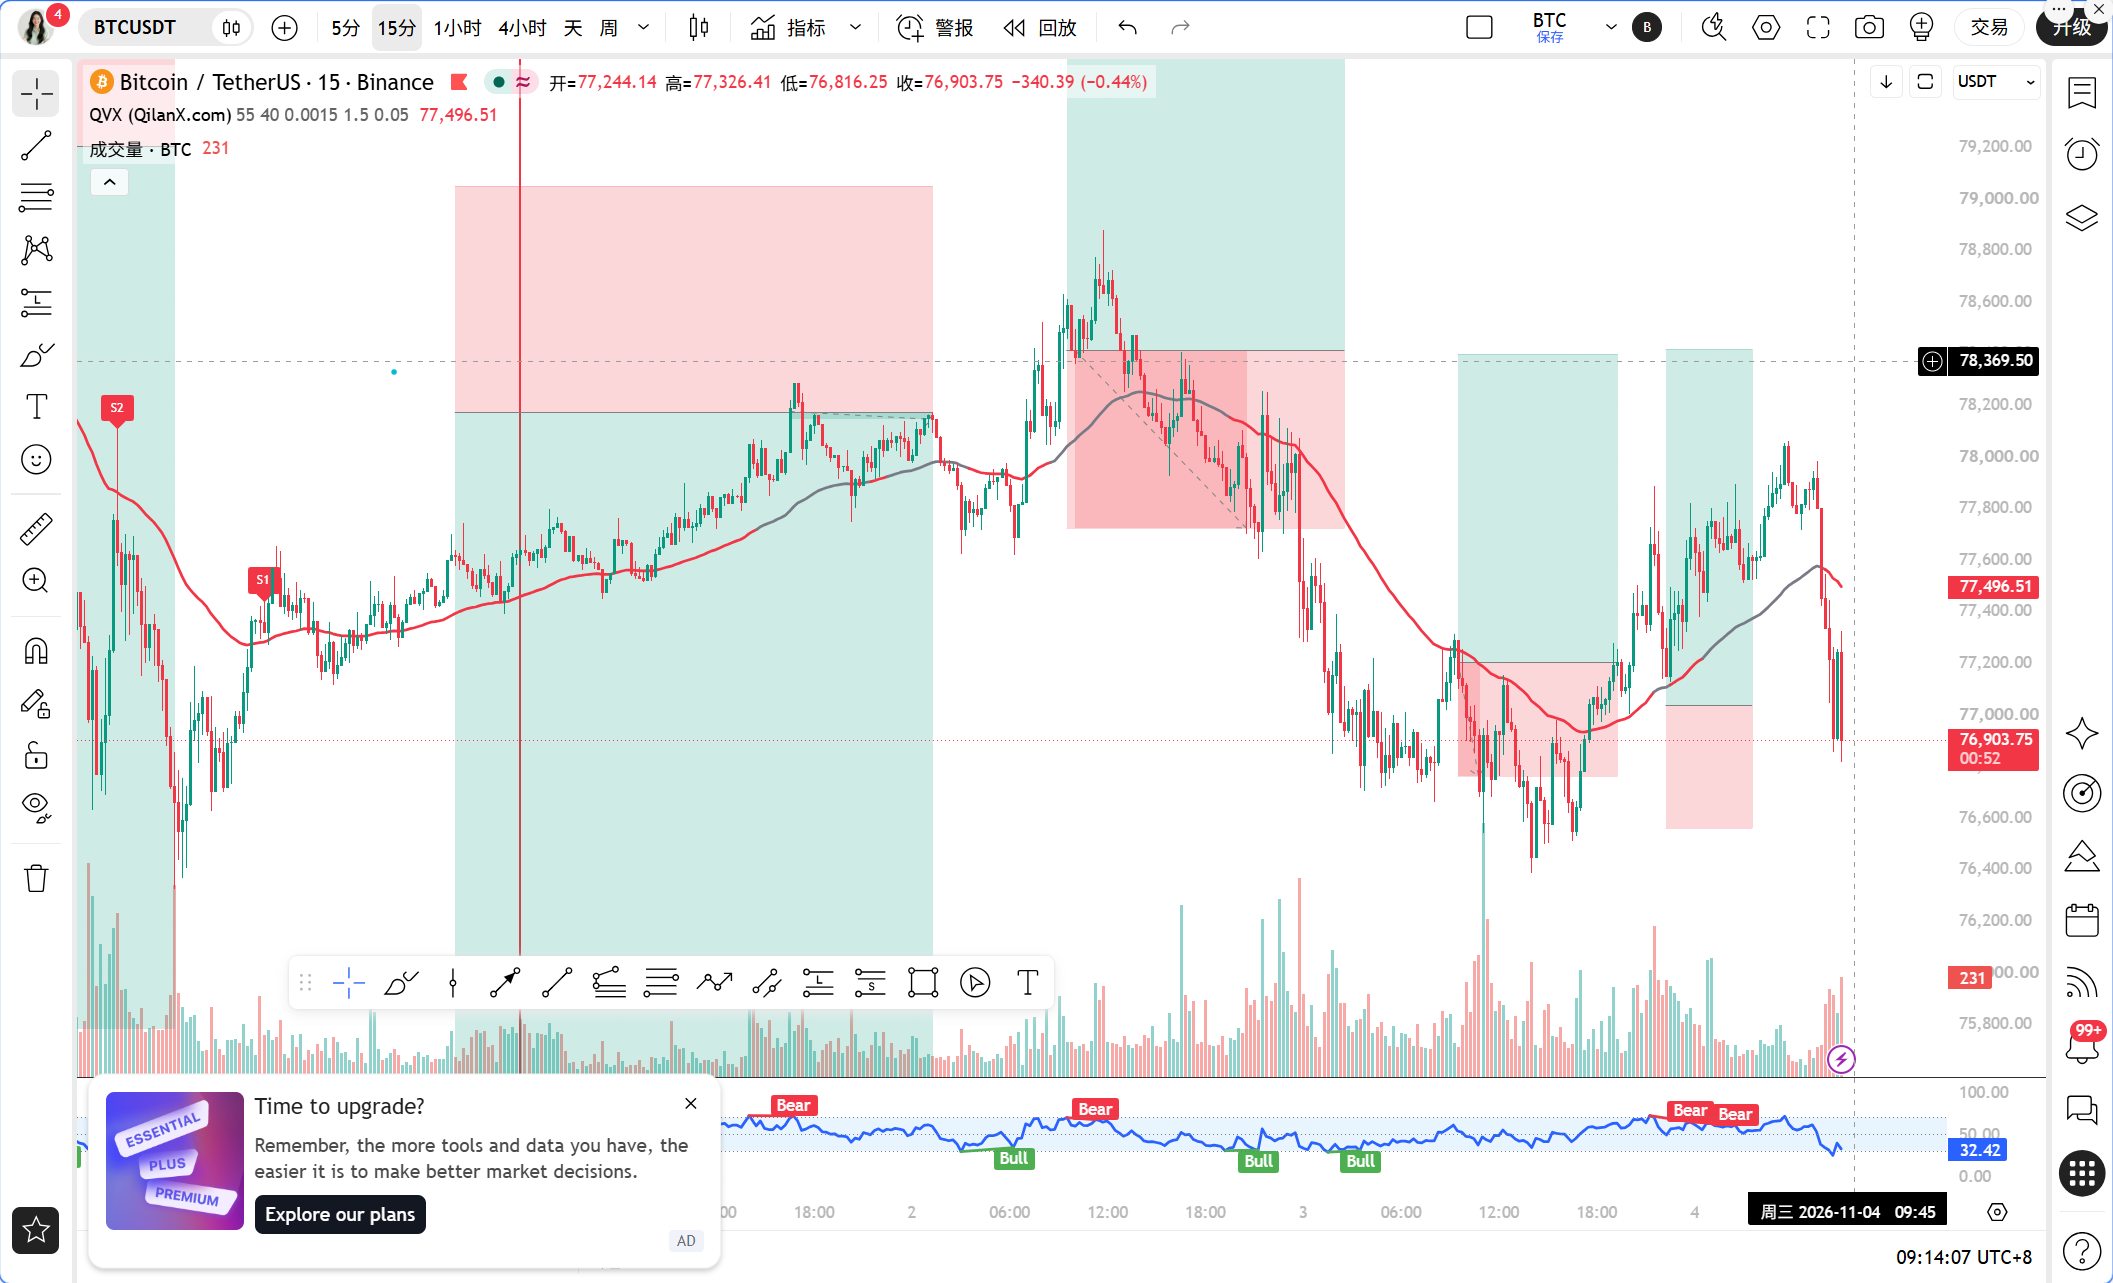
The current time is November 04, 09:10, with the latest BTC price at 77029 USDT. The 24-hour fluctuation is only 0.09%, nearly stagnant, but there are significant intraday price spikes in both directions. The fear and greed index is at 34, indicating a state of fear, with a market share of 59.27%. There are no obvious signs of capital flowing into altcoins, suggesting the market is still in a defensive posture.
Let’s first look at the multi-timeframe status. On the daily level, MA5 is at 77446.92, MA10 is at 78499.91, and MA30 is at 81063.32, showing a bearish arrangement where the price is below all three moving averages. The daily MACD has a DIF of -1357.01 and a DEA of -970.45, with a histogram value of -386.55, indicating that bearish momentum is still being released. The daily RSI is only 22.18, having entered the oversold area, which means the overall direction is bearish, but the space below is narrowing, and a technical rebound may occur at any time. On the 4-hour level, MA5 is at 77378.29, MA10 is at 77208.96, and MA30 is at 77568.94, with the price caught between the moving averages. The 4-hour MACD shows a DIF of -375.89, a DEA of -430.26, and a histogram value of +54.37, which has turned positive, indicating that the bearish momentum on this timeframe is weakening, marking the most positive signal at present. The 4-hour RSI has risen to 41.24, out of the oversold state. On the 1-hour level, MA5 is at 77501.02, MA10 is at 77593.76, and MA30 is at 77202.19, with the price tangled around MA30. The 1-hour MACD shows a DIF of 39.81, a DEA of 62.30, and a histogram value of -22.48, having just formed a death cross, with an RSI at 48.04, showing a neutral to weak bias. The 15-minute level is the weakest, with MA5 at 77147.21, MA10 at 77466.05, and MA30 at 77650.15, displaying a bearish arrangement. The MACD shows a DIF of -130.16, a DEA of -26.76, and a histogram value of -103.40, with bearish momentum still expanding; the 15-minute RSI is only 24.10, indicating significant short-term overselling.
Next, we will verify point by point using the TPV system. In terms of trend positioning, the 1-hour EMA55 is at 77474.80, and the current price of 77029 is below this line; according to system rules, this indicates a bearish trend area. The first condition for selling short is that there must be two consecutive 1-hour candlestick closes below the EMA55. From the market view, the price is currently operating below this line, satisfying this condition. The second condition is that there is resistance at higher levels; recently, the 1-hour level has seen a bounce high followed by a retreat, with the 77500 to 77600 area encountering frequent resistance, consistent with the characteristics of touching an effective high point and retreating. The third condition states that the rebound is weak; the 1-hour MACD has just experienced a death cross with a negative histogram, indicating downward momentum, hence this condition is also met. All three conditions being satisfied, the TPV system gives a bearish signal. However, it’s crucial to note a key detail: the oscillation assistance data shows that in the past 8 1-hour candlesticks, the closing prices above the EMA55 were 5/8, with only 1 crossover case. The current price has an absolute distance of 0.58% from the EMA55, failing to reach the oscillation threshold within 0.3%. The system determines that it does not meet the oscillation condition, and may be in a unilateral trend. In other words, this bearish signal is valid, but since the price has just recently dropped from above the EMA55, with few crossover cases, the solidity of the signal must be discounted, thus a heavy bet cannot be made.
From an on-chain and capital perspective, a fear and greed index of 34 indicates a cool sentiment, with nearly 80% of long positions liquidated, suggesting that leveraged longs have been sufficiently purged, which in turn decreases the momentum for further significant declines. The net buying of Bitcoin by publicly listed companies has dropped sharply by 85%, with institutional buying clearly cooling off, leading to reduced upward momentum. Bhutan's new central bank has been approved to include Bitcoin in its reserves, which is a medium to long-term benefit at the sovereign state level, but has limited immediate impact on prices. The U.S. stock AI sector has evaporated over $1.5 trillion in a month, and the correlation between tech stocks and crypto means that if risk appetite continues to weaken, BTC is unlikely to remain unaffected.
Remember the key attack and defense levels. The first resistance above is the 1-hour EMA55 at 77474.80, which is also the boundary line for bullish and bearish signals according to the TPV system. If the price cannot return above this line, the bears will still have a voice; the second resistance is in the 77600 to 77700 area, corresponding to the 1-hour MA10 and prior highs. The first support below is in the 76800 to 76900 range, which is near the recent low point; the second support is at 76500; if breached, the daily oversell condition may be further realized, targeting the next round number at 76000.
The trading perspective is given more clearly. The prevailing direction is bearish, but only confirming short positions after a rebound is valid; do not chase shorts. The entry condition is when the price retraces to the 77300 to 77450 range, which is close to below the 1-hour EMA55, and shows a long upper shadow or a bearish engulfing on the 15-minute level. Meanwhile, the 1-hour MACD histogram shows no obvious shortening; entry can be made in batches to short. The stop-loss should be placed above 77650, which is above the 1-hour MA10 and EMA55; if it’s breached, it indicates the short logic is invalidated. The first target is set at 76850, and the second target at 76500. After reaching the first target, reduce the position by half and move the remaining stop-loss to protect profits. If the price instead strongly stands above 77474.80 for two consecutive 1-hour candlestick closes, the TPV system will shift to the bullish area. At that point, no further short positions will be taken; a low buy will be considered after waiting for a retest confirmation, targeting 77800 to 78000.
Risk reminder in one sentence: Geopolitical news and the aftermath of the theft case may trigger instantaneous violent fluctuations; position control is always more important than directional judgment.
Follow Qinglan Crypto Classroom to seize more trading opportunities! Welcome to visit the official website www.qinglan.org
📊 Qinglan TPV Trading Strategy Backtest Reference
🕒 Last Backtest Time 11-04 07:00:02
Total Analysis: 4869 Backtest: 4860 Accuracy Rate: 76.4% (3711/4860)
免责声明:本文章仅代表作者个人观点,不代表本平台的立场和观点。本文章仅供信息分享,不构成对任何人的任何投资建议。用户与作者之间的任何争议,与本平台无关。如网页中刊载的文章或图片涉及侵权,请提供相关的权利证明和身份证明发送邮件到[email protected],本平台相关工作人员将会进行核查。