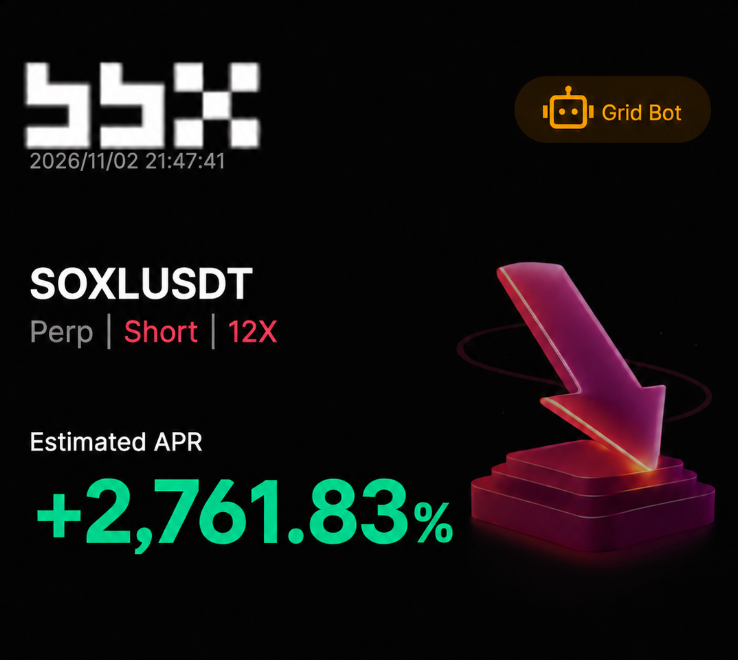
Abstract: In October, US stocks fluctuated unpredictably, with technology stocks and chip stocks experiencing intense pullbacks, making trading difficult, and contracts even harder. On October 30, a concentrated sell-off in US tech stocks caused the Nasdaq Composite Index to fall 2.9% in a single day. During this period, according to data from the BBX platform, a trader achieved a monthly return of approximately 227% (estimated annualized 2,761.83%) using a short contract grid with SOXLUSDT. This article dissects how this yield was achieved, what scenarios are suitable for stock contract grids, and the risks that must be clearly understood.
1. Last Friday, the Nasdaq fell 2.9%
Throughout October, trading in US stocks was challenging, and trading contracts was even more difficult.
At the beginning of the month, the AI market was still rallying: On October 6, the Nasdaq Composite Index closed at an all-time high. However, just a few days later, the trend changed. The market began to doubt whether the massive investment in AI infrastructure could yield returns, leading technology and chip stocks to undergo consecutive corrections. There were fluctuations in between: on October 22, the Nasdaq fell 2.6%, but by the 28th, it had recouped all losses and even gained 2.1% more.
This environment is most torturous for contract traders. When shorting, a rebound can trigger stop-loss; when trying to catch the bottom, the next bearish candlestick can drop again. If the direction is correct but the timing is wrong, one can still lose money.
On October 30, 2026, a Friday, pressure exploded on the last trading day of the month.
According to the Associated Press, the S&P 500 fell 1.8% that day, marking the worst single-day performance since June; the Nasdaq Composite Index fell 2.9%. According to Cboe market commentary, $NVDA fell 4.2% that day, with the chip sector generally under pressure. The Philadelphia Semiconductor Index dropped 7.2% that day, with a month-end decline exceeding 15%.
Overall, the Nasdaq fell by about 5.3% in October, marking the worst monthly performance since March 2025, and pulling back about 7.8% from its peak.
(Source: AP News "Wall Street drops to its worst day since June after the sell-off for tech stocks deepens"; Cboe Insights "Tech Selloff Wipes Out $1 Trillion in Value"; Reuters "October ends with a thud for Intel, Reddit, AI stalwarts"; FinancialMarkets.com "The Nasdaq Lost 5.3% in October While the Dow Gained 1.5%"; ForkLog "Six shocks, no panic: October in review")
Many people during such days can only do one thing: stare blankly at their accounts.
But if we pull the lens back a month and look from a different angle—
BBX platform data shows that a trader achieved a return of approximately 227% (2,761.83% APR) using a short grid with SOXL.
Let me preface this: The market conditions of the past 30 days will not repeat themselves; this figure does not represent the future.
However, it answers an important question well: In a severe downturn, what can a grid actually do?
2. Breakdown: How is the 227% Achieved?
First, let's look at the parameters:
Item | Setting |
Contract | SOXLUSDT |
Direction | Short |
Leverage | 12× |
Price Range | 80–170 USDT |
Grid | Arithmetic, 20 grids |
Price Difference per Grid | 4.5 USDT |
Initial Investment | 1,000 USDT |
Starting Price | About 164.01 USDT |
Result: Monthly return of approximately 227%, with an estimated annualized return of 2,761.83%.
Why was this achieved? Let’s break it down into four levels.
First level, the underlying asset is strong enough. $SOXL is a leveraged ETF that triples the long position in semiconductors. If chip stocks drop 1%, it roughly falls by 3%. When technology stocks correct, its decline is magnified several times.
Second level, a good starting point. The strategy entered short at about 164 USDT, nearly at the upper limit of the range at 170. According to publicly available market data, $SOXL dropped from over 160 dollars to below 80 dollars during these 30 days, hitting around 70 dollars at the end of the month; the entire downward segment within this range was within the grid's "reach." After dropping below 80, the grid's short positions were fully closed and no further trades were made.
Third level, the decline isn't linear. There were rebounds and pullbacks during the downturn; for example, after the big decline on October 22, $SOXL rebounded around the 28th. Each rebound triggered a sell-off to open short positions, and every drop triggered buying to close positions, pairing off grid by grid, turning fluctuations into profits.
Fourth level, leveraging at 12 times. With a principal of 1,000 USDT, and calculating at 12 times leverage, one could control a position of about 12,000 USDT, syncing both profits and risks.
To put it plainly: This 227% mainly came from "correct directional judgment + leverage"; the grid's role is to turn the back-and-forth fluctuations during the downturn into paired-off profits, rather than making all-in bets.
3. What's Good About Contract Grids? What Scenarios are Suitable for Stock Contract Grids?
After reviewing this case, we return to the most fundamental question: Why use a contract grid instead of entering contracts manually?
Several benefits of contract grids:
Both long and short are possible: Spot grids can only buy low and sell high, waiting for a rebound; contract grids can go long or short and can also operate neutral grids, allowing for actions even in downturns.
Batch entry, without betting on a single point: Positions are divided into grids, adding in batches when prices rise and cashing in batches when prices drop, avoiding heavy chasing at mid-levels.
Turning fluctuations into paired profits: Every time the price oscillates in the range, a buy low-sell high or sell high-buy low is completed, the more oscillation, the greater the number of pairings.
Automated execution, keeping hands off: Robots operate 7x24 based on predetermined ranges and grids, without needing to monitor, also reducing emotional trading behaviors like panic and chasing losses.
Higher capital efficiency: Can use leverage to cover a larger range with the same principal; existing stock contract positions can be directly converted into grids without prior liquidation.
Stock contract grids are suitable for the following scenarios:
Highly volatile individual stocks and leveraged ETFs: For example, $$SOXL$$ and MSTR, which have large intraday fluctuations, have more pullbacks and more pairing opportunities in grids.
Judgment on direction but lacking timing confidence: If bearish on semiconductors but worried about betting mid-levels, use a short grid to open shorts in batches; if optimistic about a stock but fear buying at high points, use a long grid to build positions in batches.
Wide fluctuations around earnings season and macro data releases: In scenarios with unclear direction, oscillating back and forth, neutral grids or wider range grids are appropriate.
Cryptocurrency users wanting to expand into US stocks: The same grid logic can be applied without needing to relearn; using USDT margin allows participation in US stock-related trends.
Existing positions that want more flexible management: If holding stock contract positions, can convert to grids to capitalize on range fluctuations while holding positions.
Situations that are less suitable should also be clearly stated: In cases of unidirectional surges or drops, and when prices break out of the range in one go, there are few pairing opportunities, and reverse grids may continue to bear pressure; for assets with very narrow fluctuations, grids may rarely be triggered, and after deducting fees, may yield very little.
4. What Other Stock Contract Grids are Available in the Strategy Square?
SOXL is not an isolated case. The BBX contract grid strategy square has numerous popular stock contract grid strategies, such as:
SKHYNIXUSDT Long Grid: Range 1000–1110, 10 grids in an arithmetic sequence, 10x position, 30-day backtest +34.39%. Fewer grids and larger intervals make it suitable for assets with large fluctuations and slower rhythms.
MSTRUSDT Long Grid: Range 125–140, 25 grids in a geometric sequence, profit per grid (after fees) 0.45%, 10x position, 30-day backtest +26.96%. As of October 25, 2026, $MSTR holds about 848,517 BTC, and its stock price is highly correlated with Bitcoin trends, making it easier for users familiar with the crypto market to get started. (Source: Strategy's 8-K filing submitted to the SEC; Strategy's Q3 2026 earnings press release, October 29, 2026)
SOXLUSDT Long Grid: Range 68–83, 30 grids in a geometric sequence, 30-day backtest +39.54%. The same asset has traders operating both long and short directions.
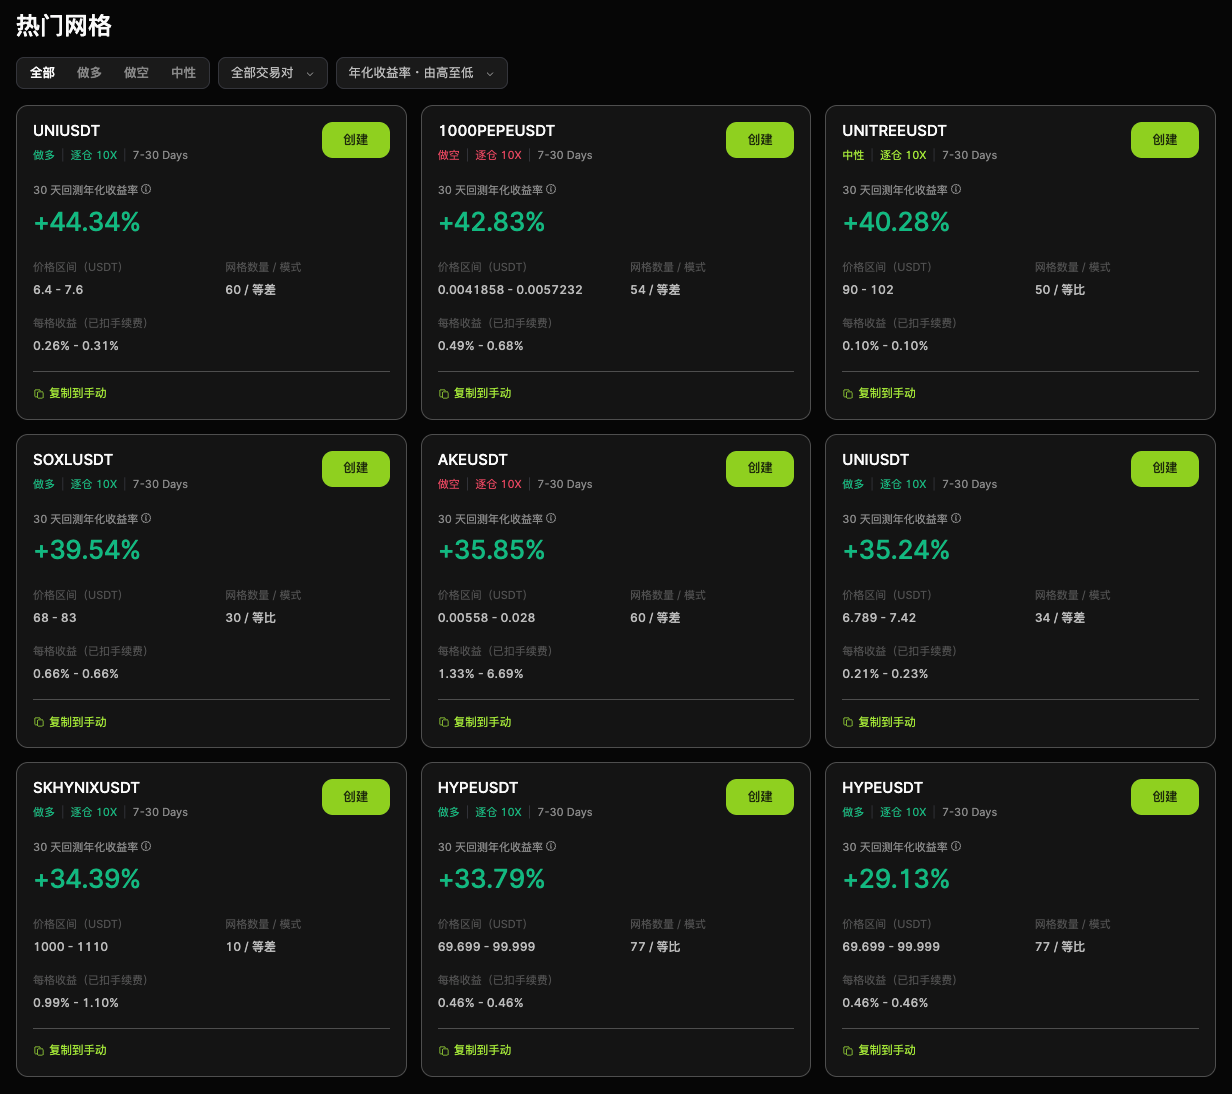
These popular strategies do not require setting parameters from scratch: just find the one you like, click "Create," and start with the original parameters; you can also "Copy to Manual," bringing in the range, grid numbers, and leverage, and then tweak according to your own capital and risk preferences. For newcomers to grids, this is the quickest way to get started.
Ultimately, stock contract grids and those commonly used in the crypto market follow the same logic. Users who have used BTC grids can switch to $SOXL without having to relearn.
5. How to Get Started
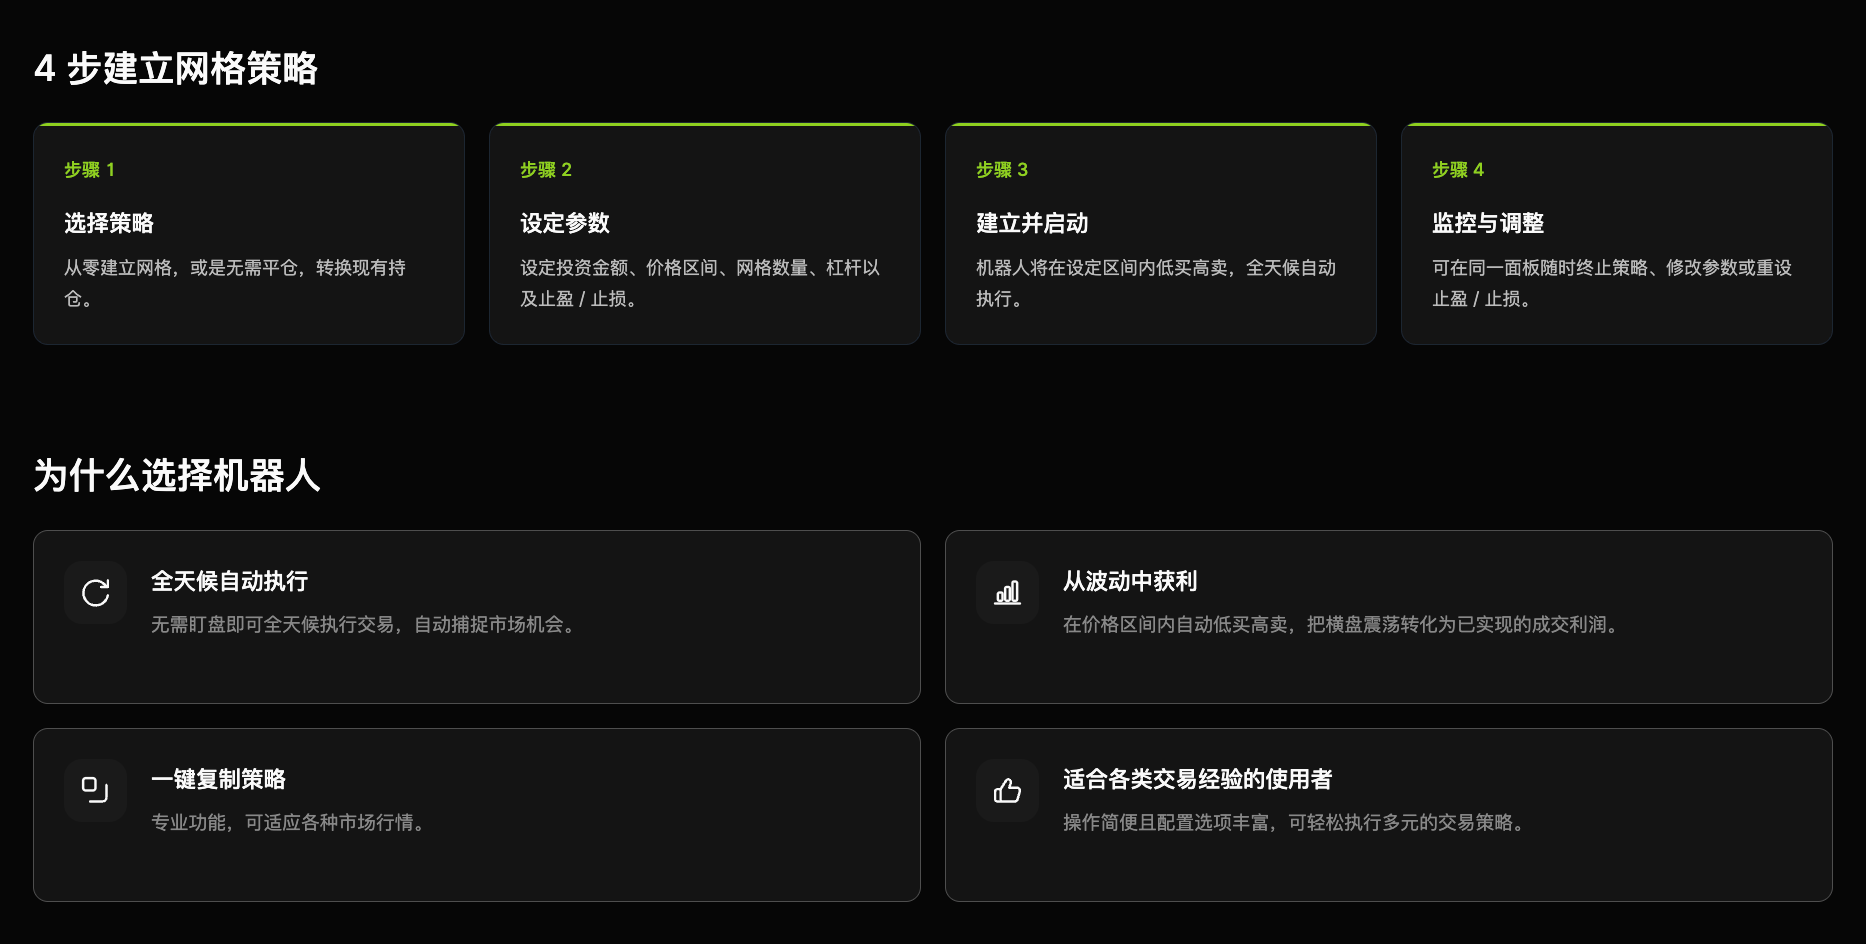
The contract grid page of BBX DEX (connect your wallet at https://dex.bbx.com/en/futures/pilot-trading) is usable and you can also directly create grids on the right side of the stock contract trading page. There are three ways to create: by AI recommending parameters based on historical data, one-click copy of ready-made strategies from the strategy square, or manually setting direction, range, grid numbers, and arithmetic/geometric and leverage. Existing stock contract positions can also be directly converted into grids without needing to close positions first, but any existing unrealized losses from original holdings will not disappear.
Regarding leverage: The leverage limit for BBX stock-related perpetual contracts varies by contract, with some contracts supporting up to 100 times leverage. When grids are overlaid with leverage, both gains and losses will be magnified.
6. When Strategy Tools Become Callable Abilities
Those who first form trading judgments in the market often do so in research communities, trader groups, and content platforms: some analyze semiconductors daily, while others track the correlation between $MSTR and Bitcoin. They understand market rhythms best but may not have the capability to build an entire trading system from scratch.
AZverse addresses exactly this point with its proposed open financial network. According to its official introduction, AZverse, positioned as "Compose All Finance," allows different teams to share underlying liquidity, markets, and financial capabilities through a Composer model and build their financial applications on this foundation.
For stock contract grids, this means a trading community that has long studied US tech stocks can leverage BBX and the AZverse ecosystem to directly integrate stock contract grid capabilities and community traders' strategies into their products. Users can read a market recap and instantly copy the corresponding grid strategy in the same place.
7. Seeing 227%, First Understand These Points
The past ≠ the future: 227% is the result under the past 30 days of market conditions, and this market will not replay.
Estimated annualized return ≠ actual annual profit: 2,761.83% is the annualized figure extrapolated from current performance, not necessarily what will be achieved a year from now.
The risk of liquidation at 12× leverage: If prices fluctuate a few percentage points in the opposite direction, margin might be quickly depleted, leading to liquidation.
Unidirectional surges are the nemesis of short grids: $SOXL is a leveraged ETF, and rebounds can be equally fierce. Once it breaks the upper limit of the range, the short grid will continue to face pressure, potentially leading to liquidation.
Costs and total account: Fees, funding costs, and slippage will erode profits; strategy effectiveness = paired profit + unrealized gains/losses from positions - fees.
Grids are tools for executing discipline, not predictive tools, and definitely not guaranteed arbitrage. If the direction is wrong, grids won't save you; if the direction is right, they help you avoid betting everything on a single point.
About BBX
BBX (https://www.bbx.com) is a multi-asset trading platform with stablecoins as the funding entry point. BBX allows real trading of US and Hong Kong stocks: US stocks are executed through registered cooperative brokers under FINRA and cleared and custodied by cooperative clearing institutions; Hong Kong stocks are executed through brokers holding a license from the Hong Kong Securities and Futures Commission. BBX DEX supports 24/7 trading of tokenized stocks and multi-asset perpetual contracts with USDT margin, also提供 automatted strategy tools such as contract grids.
One account, trading global assets (One Account. Global Markets.).
Disclaimer
This article is for product functionality introduction and market information sharing only and does not constitute any investment advice, offer, or solicitation. Market data is sourced from public reports and may contain errors or be subject to updates. Specific product, asset, parameters, and regional availability are subject to actual presentation on the BBX platform.
Risk Warning
Perpetual contracts and contract grids involve high-risk leveraged trading, which may lead to the loss of the entire margin. Grid strategies may incur losses or be liquidated under unidirectional markets, price breakouts of the range, or insufficient margin; automated execution does not guarantee profit, and past earnings, backtesting, and demonstration results do not represent future performance. Stock-related perpetual contracts do not represent purchase of actual stocks and do not confer shareholder rights. Please participate cautiously according to your own risk tolerance and local legal regulations.
免责声明:本文章仅代表作者个人观点,不代表本平台的立场和观点。本文章仅供信息分享,不构成对任何人的任何投资建议。用户与作者之间的任何争议,与本平台无关。如网页中刊载的文章或图片涉及侵权,请提供相关的权利证明和身份证明发送邮件到[email protected],本平台相关工作人员将会进行核查。