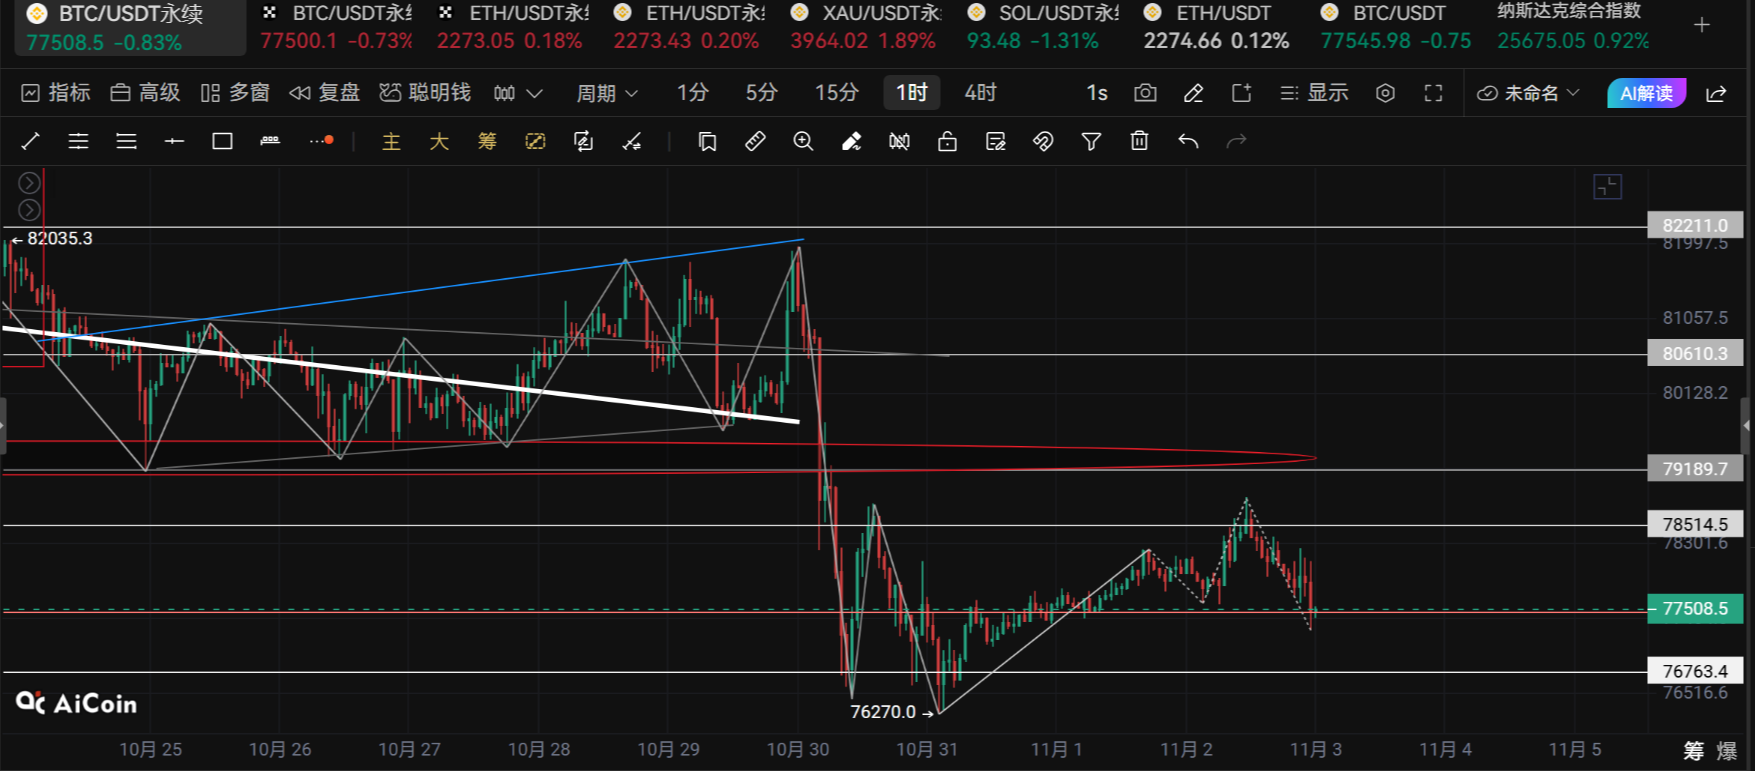
Cryptocurrency Scholar: Ethereum (ETH) rebounded to 2300 on November 3 but was pushed back down; this round of bulls has failed three times!
Brothers, ETH pretended to be dead today at 2270, not going up or down, both bulls and bears are uncomfortable. Is it a pullback or a turn to bearish? To conclude, this isn't something that can be decided with one sentence; it requires looking at the structure, moving averages, and volume, rather than emotions. In my years in this industry, I've seen too many people bottom-fishing midway down during a decline, and I've seen others get swept back and forth during fluctuations. So this account does one thing: it breaks down and discusses daily K-line, moving averages, MACD, and BOLL for you, without making calls, drawing visions, making promises of profits, and definitely not telling you nonsense about doubling your investment. If you find my explanations practical, please hit follow first.
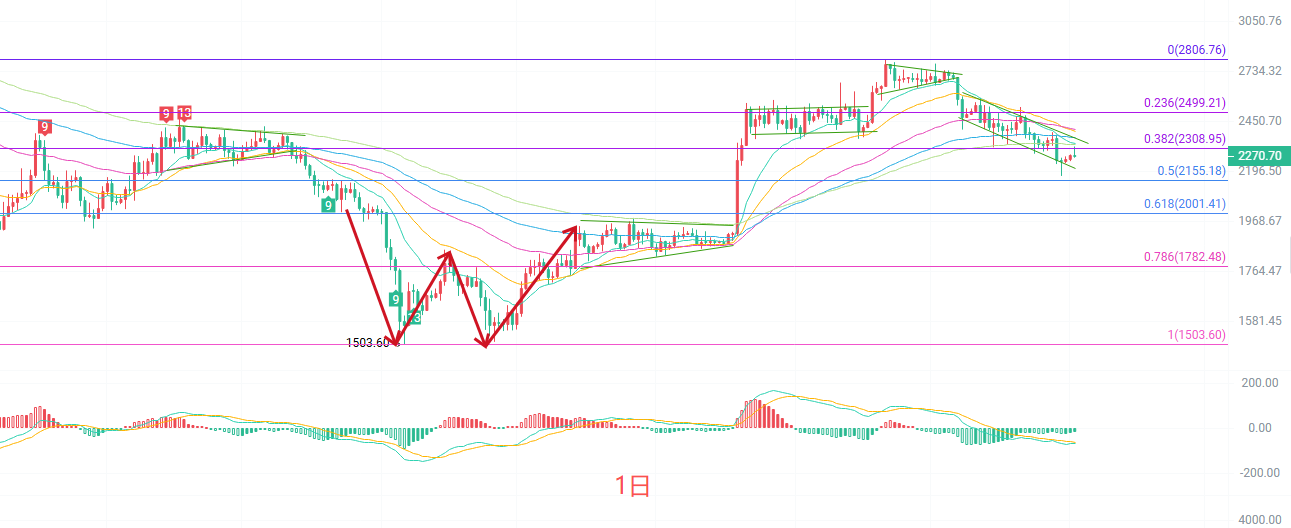
The daily K-line moving averages are firmly below all five moving averages, showing a typical bearish arrangement in the short to medium term. This indicates that the daily trend has not truly reversed. In terms of MACD, the death cross is still being released, with momentum leaning bearish but the green bar has not visibly enlarged. The Bollinger Bands' middle track is at 2360, and the lower track is at 2221. The price is currently between the middle and lower tracks, with about 45 dollars of space before reaching the lower track. Overall assessment: The daily line is still in a pullback structure after a rebound, and there have been no clear signs of a stop to the decline. TD count is 1, belonging to a weak pullback in a downward trend.
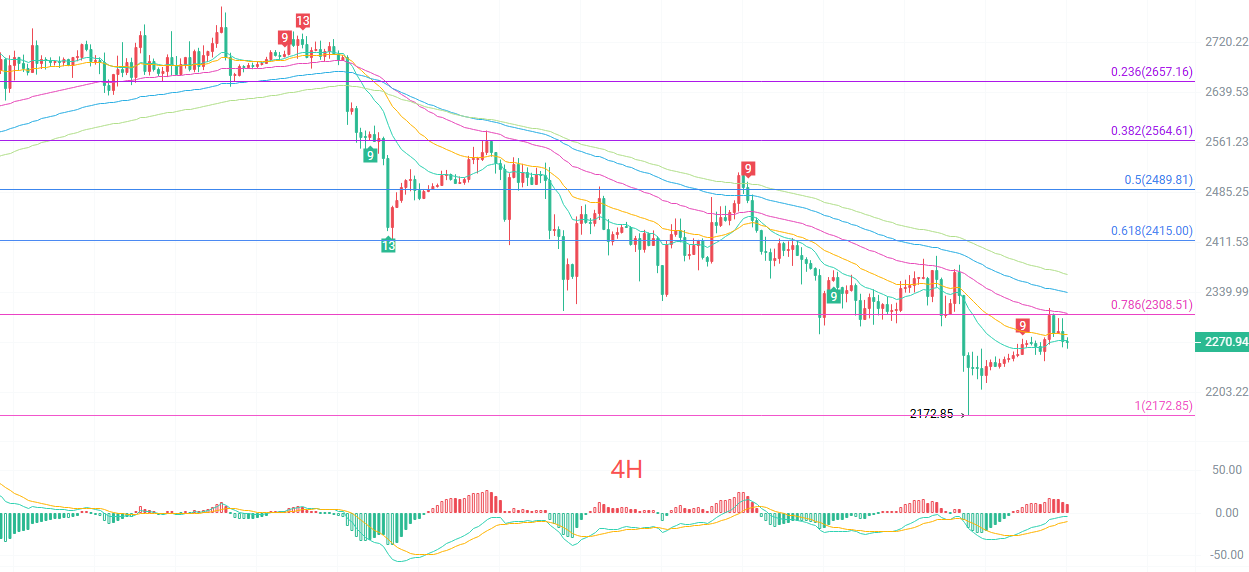
The four-hour K-line alternates between small declines and small rises. The TD count has reached 2, indicating that the short-term downward structure is still continuing. The EMA moving average shows a standard bearish arrangement, with prices repeatedly being pressured around EMA15, with each rebound weaker than the last. Notably, the MACD indicator's DIF has crossed above DEA, which is a golden cross below the zero axis, suggesting short-term bullish intentions for a repair, but at a smaller level. The Bollinger Bands' middle track is at 2260, and the price is just near the middle track, with the upper track at 2298 being the first pressure point, the lower track at 2222 being the first support, and the previous low at 2172 being the bottom line that the bulls must defend.
Short-term reference:
To the north, if it hits 2220 to 2180, it meets resistance, with a stop-loss of 30 points, targeting 2280 to 2320.
To the south, if it hits 2280 to 2320, it faces stagnation, with a stop-loss of 30 points, targeting 2250 to 2200.
Specific operations should focus on real-time market data, and for more information details, you can consult the author. There is a delay in article publication, so it's recommended for reference only, and the risk is to be borne by you.
Reminder: The above content from the Cryptocurrency Scholar is continuously updated on major trading platforms like Binance, OKEx, Huobi, etc. For more content, you can add me as a friend in Binance OKEx and join my fan group.
免责声明:本文章仅代表作者个人观点,不代表本平台的立场和观点。本文章仅供信息分享,不构成对任何人的任何投资建议。用户与作者之间的任何争议,与本平台无关。如网页中刊载的文章或图片涉及侵权,请提供相关的权利证明和身份证明发送邮件到[email protected],本平台相关工作人员将会进行核查。