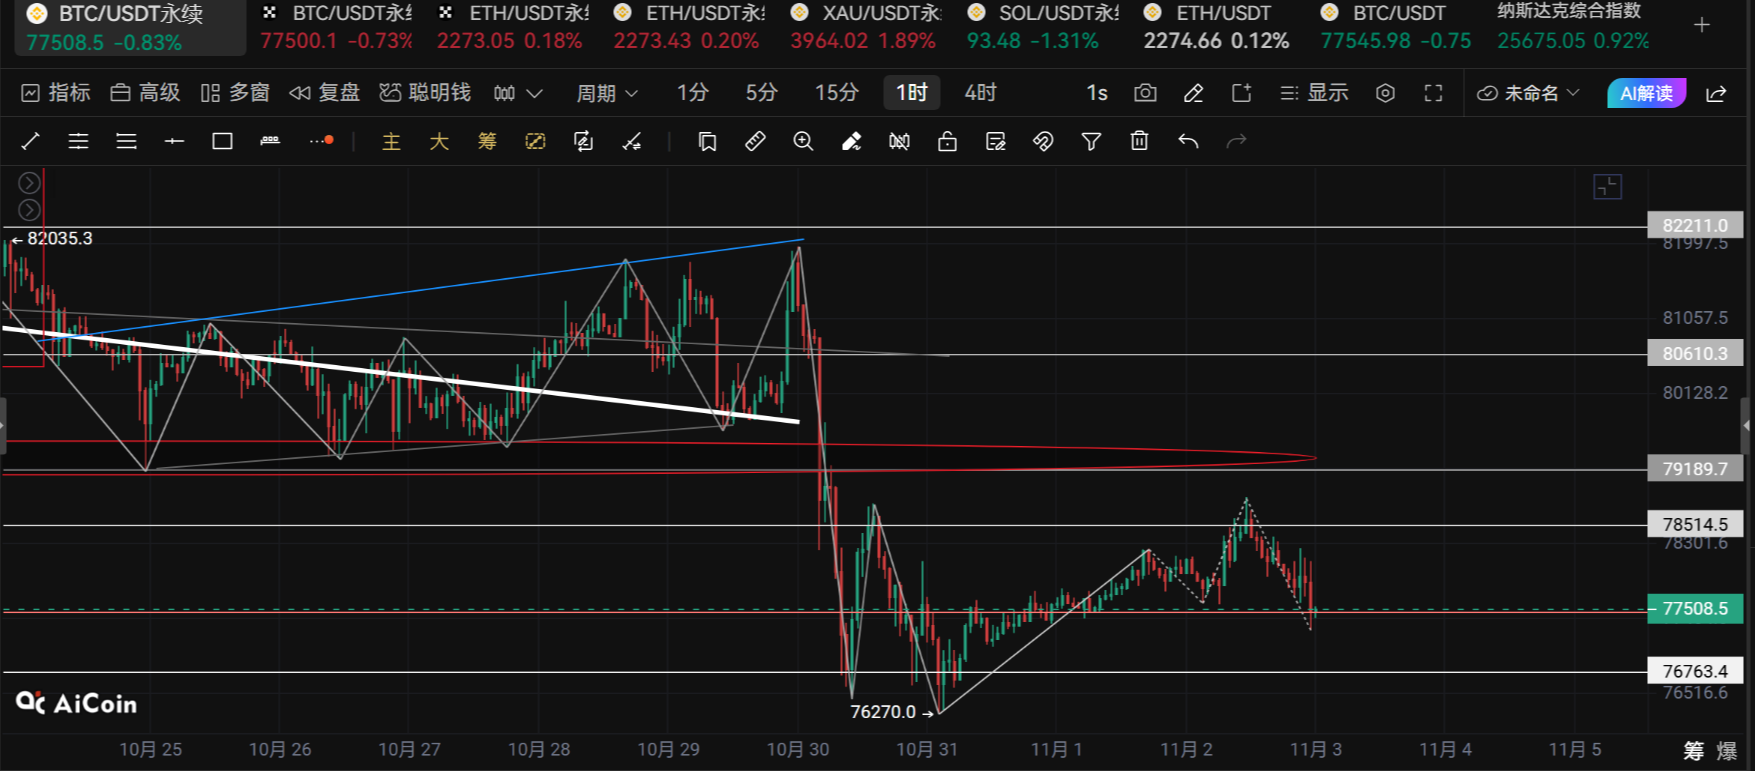
Scholar of Cryptocurrency: The 11.3 Bitcoin (BTC) shorts can no longer exert pressure, but the bulls are still hesitant; is the main force feeling awkward now?
The current price of Bitcoin is 77,400. This figure itself is meaningless; what matters is that it is stuck at a position everyone is waiting for. Bottom seekers are waiting at 76,000, and top seekers are waiting at 78,000. The 3,000 points in between are a grinding meat grinder. I’ll put it this way: in the next 24–48 hours, it’s highly probable to fluctuate between 76,300 and 78,800. All my expectations that prices are going to rise or fall before the direction is established are illusions. Those who can execute plans will reap the rewards, while those who rely on feelings will take the hits. As per the usual rule, the above is purely technical sharing, without any elements of soliciting trades. Assess your own leverage positions, and don’t come crying to me if you get liquidated. If likes exceed a hundred, I will update the direction of this fluctuation after tomorrow's close.
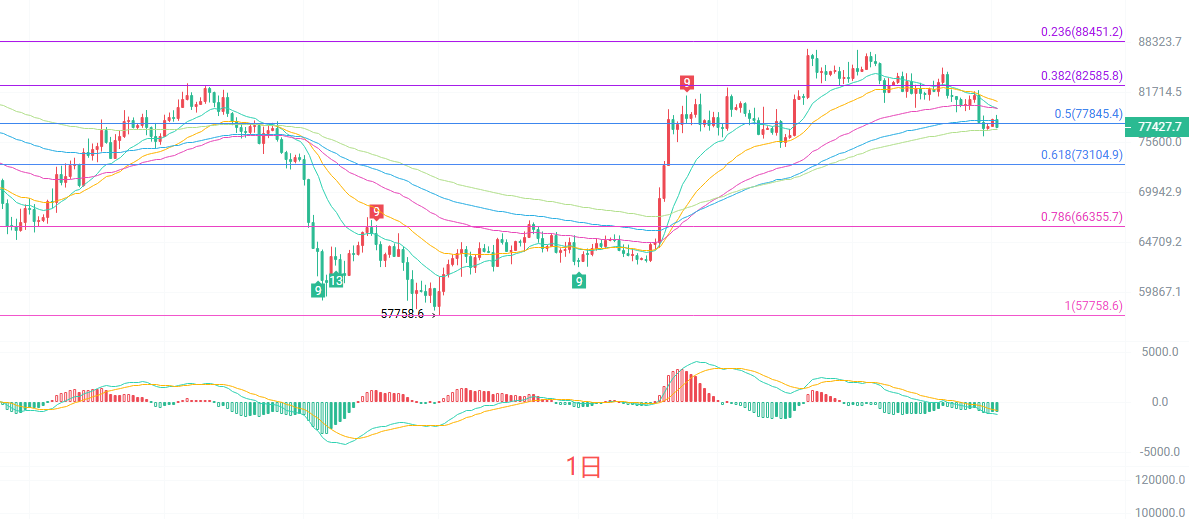
The daily candlestick has completely engulfed the rebound from the previous two days. Structurally, the price has broken below EMA15 and EMA60, and is moving towards EMA90 at 78,204, just a step away from EMA120 at 77,098. The MACD has not fully released its bearish momentum at the daily level. The lower Bollinger Band at 76,817 is currently the most critical defense line, and the TD sequence has reached 5. According to counting rules, it will require two more candlesticks downwards to possibly reach a low of 9. Overall characterization: the daily line is in a pullback phase after a rebound, and it has not yet completely turned bearish, but the bulls must stabilize the 76,800 position in the short term. If this level cannot be held, it will have to retest the ascending structure since the previous low of 57,758.
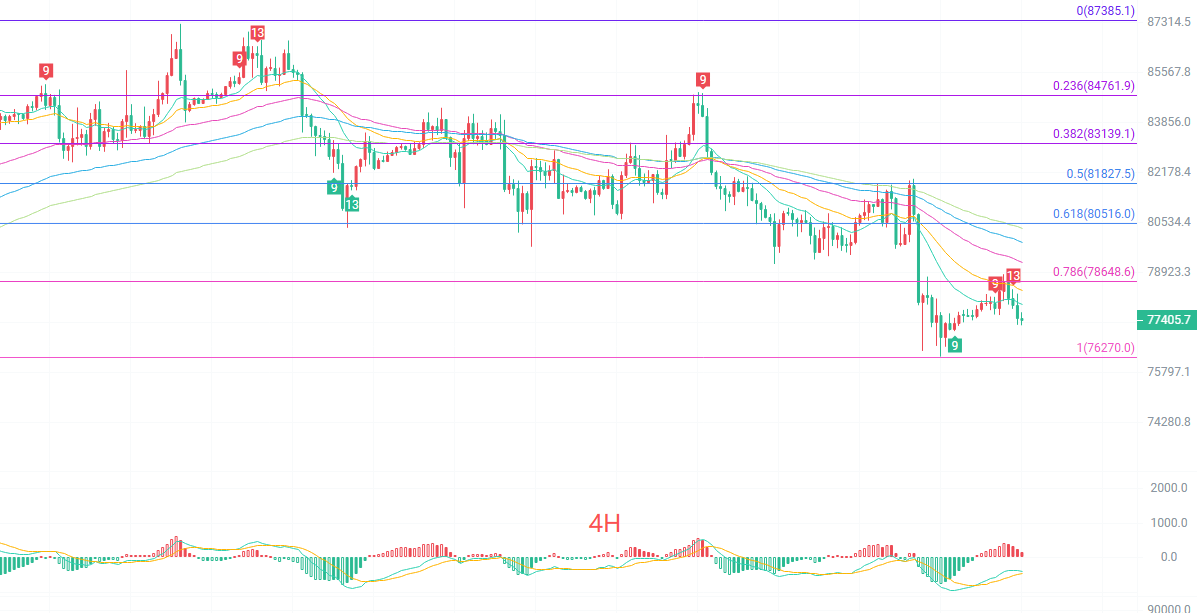
In the four-hour chart, this candlestick has nearly flatlined, with highs and lows closing within the Bollinger Band channel. On the moving average level, the price is pressed below EMA15 at 77,908, but EMA30 at 78,362 has already flattened out, and short-term bears seem to struggle around 78,000. The MACD indicator has seen the DIF cross above the DEA, which is a typical signal of a slowdown in the downtrend and exhaustion of bearish momentum. The middle line of the Bollinger Band at 77,674 is the dividing line between bulls and bears: if it can reclaim this level, it will serve as the starting point for a short-term oversold rebound; if it cannot, it will continue to grind around the lower line at 76,895. There is still a downward inertia in the short term, but the space has already diminished.
Short-term reference:
Bullish from 76,500 to 77,000 faces resistance, with a stop loss of 500 points and a target of 77,500 to 78,500.
Bearish from 78,300 to 78,800 is stagnating, with a stop loss of 500 points and a target of 77,000 to 76,500.
Specific operations should primarily depend on real-time market data. For more detailed information, you can consult the author. There might be a delay in article release; this is meant for reference only, and risks are to be borne by individuals.
Friendly reminder: The above content from the cryptocurrency scholar is updated simultaneously on major trading platforms like Binance, Ouyi, Huobi, etc. For more content, you can add me as a friend in Binance Ouyi and join my fan group.
免责声明:本文章仅代表作者个人观点,不代表本平台的立场和观点。本文章仅供信息分享,不构成对任何人的任何投资建议。用户与作者之间的任何争议,与本平台无关。如网页中刊载的文章或图片涉及侵权,请提供相关的权利证明和身份证明发送邮件到[email protected],本平台相关工作人员将会进行核查。