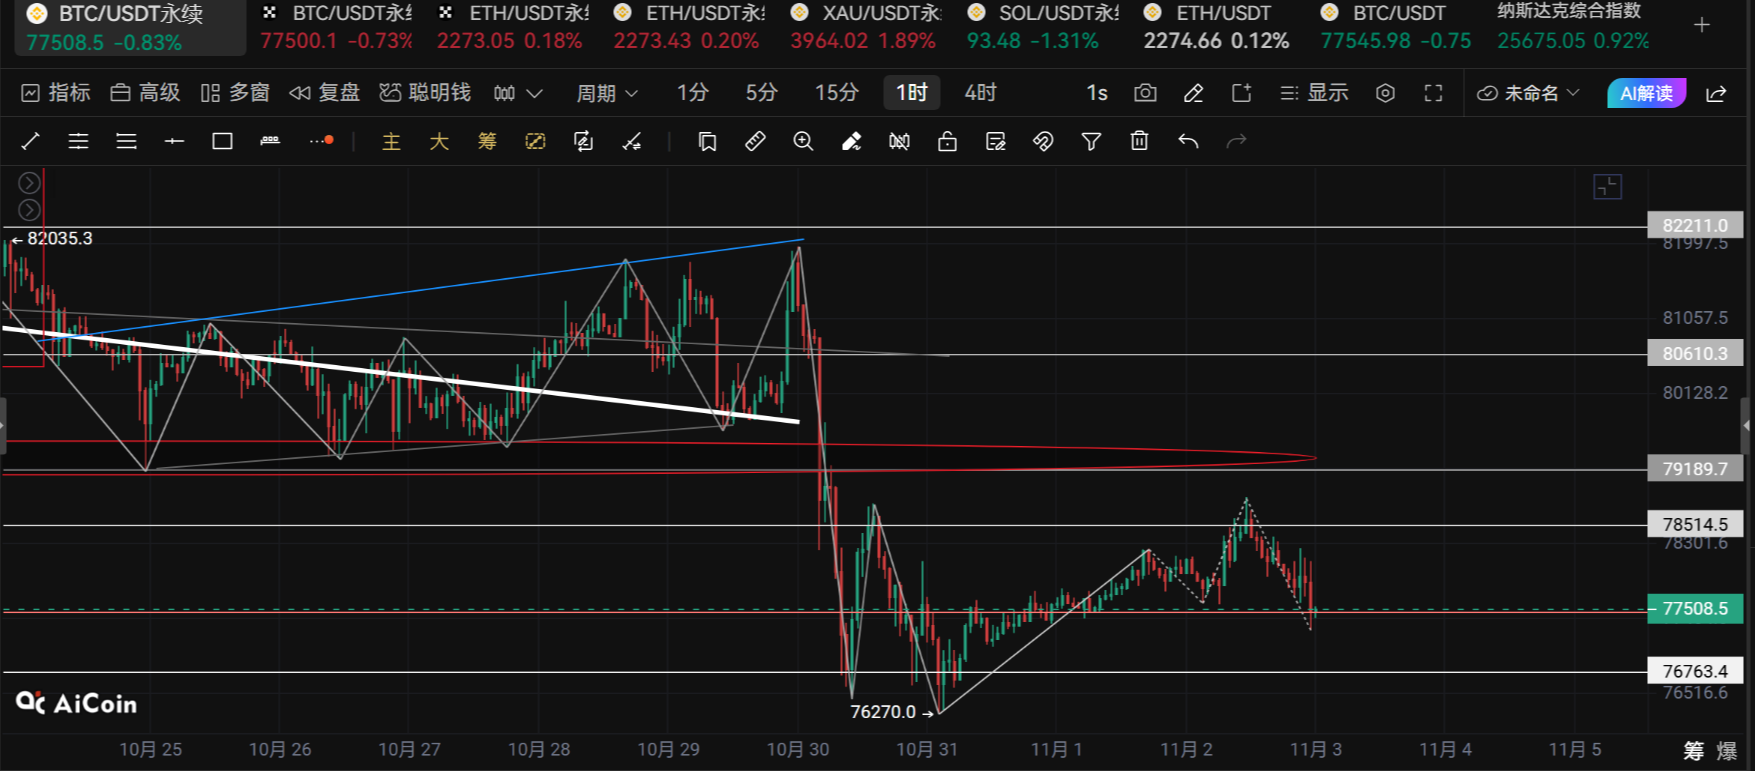
Liying Chat Coin: 11.2 Bitcoin (BTC) and Ethereum (ETH) Latest Market Analysis
Family! The current price of Bitcoin is 77400, and the overall trend is weak. Recently, it fell to around 76270 but managed to hold. However, the rebound lacks strength, as if it is being pressed down. The current price is trapped between several moving averages, unable to rise or fall. The technical indicators of the EMA moving average system show a bearish arrangement. Only if it stands firm at 78000 can we say that the short-term trend is strong. The MACD indicator is operating below the zero line, and the DIF and DEA have not yet formed a golden cross, indicating that the rebound lacks strength. The middle track at 77985 is a key resistance point, while the lower track at 77469 is a short-term support. This means the market is on the eve of a turning point, with decreasing volatility. Once it breaks through the upper and lower tracks, there will be significant movements. Currently, the bears have a slight advantage, and we need to be wary of the risk of a downward breakout.
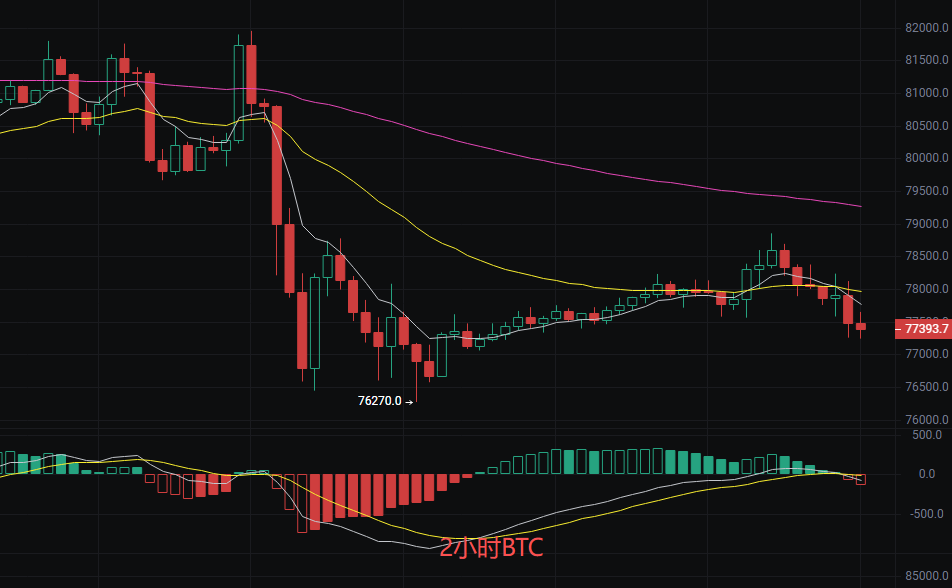
It is recommended to trade on the right side, and the prudent should observe.
For long positions, if the price does not break the previous low at 76270, try going long, with a stop loss set below 75800, and target 78000;
For short positions, enter if the price rebounds to 78000-78200, with a stop loss above 78500, targeting first 76500 and then 76000.
Position must be controlled within 20%, as the current market is not suitable for heavy positions. Strictly set stop losses to avoid false breakouts, preserving principal to sustain.
Ethereum
Family, the current price of Ethereum is 2265. From the chart, it previously experienced a sharp drop to around 2172, and then began to rebound for correction. Now the price is entangled near several moving averages. This position tests one’s mentality the most; fear of being caught while chasing highs and fear of missing out while picking bottoms. However, as long as we understand the intentions of the main players, this range of fluctuation is actually the best opportunity for positioning. We do not guess tops and bottoms; we follow the trend. The technical indicators of the EMA moving average system show that the short-term major trend has not completely reversed yet. The MACD indicators, DIF, and DEA values are very small, indicating that the upward momentum is diminishing, facing a choice of direction. The Bollinger Bands are clearly narrowing, with the middle track at 2275 right beneath us, the upper track at 2300 acting as resistance, and the lower track at 2251 as support. Volatility is decreasing, signaling an imminent change.
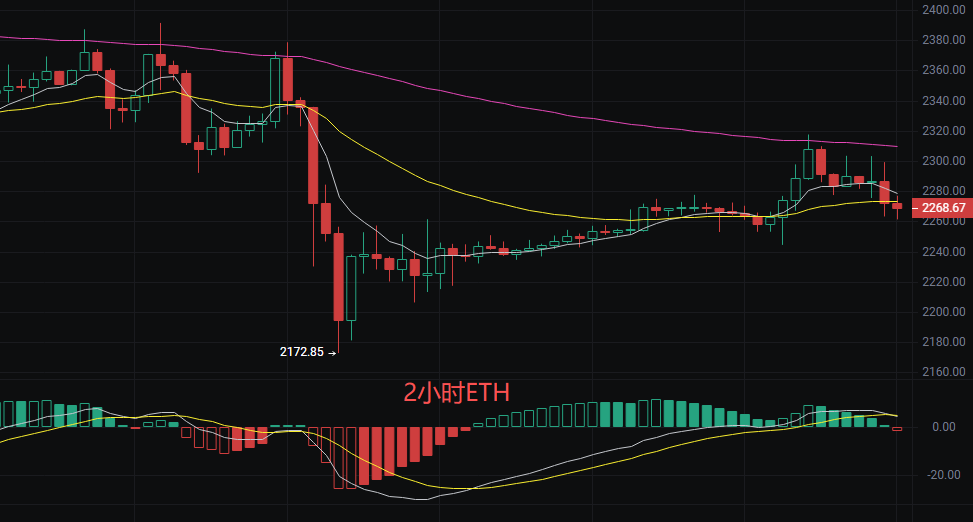
Strategy recommendation: buy high and sell low.
Enter long positions to stabilize in the range of 2250-2255, with a stop loss below 2235, targeting 2290-2300.
Enter short positions when faced with resistance in the range of 2305-2310, with a stop loss above 2325, targeting 2250-2260.
Remember to test with light positions. Narrow fluctuations are prone to spike losses, heavy positions are strictly prohibited.
The above content is exclusively original by Liying, please cite the source when reprinting! The article publication reviews have a time delay, and the market changes rapidly. The above suggestions are for reference only, and the risk is borne by the individuals.
Warm tips: The above content is only from Liying's official account: Crypto Training Camp, created by the author. The advertisements at the end of the article and in the comments section are unrelated to the author, please discern carefully. Thank you for reading.
免责声明:本文章仅代表作者个人观点,不代表本平台的立场和观点。本文章仅供信息分享,不构成对任何人的任何投资建议。用户与作者之间的任何争议,与本平台无关。如网页中刊载的文章或图片涉及侵权,请提供相关的权利证明和身份证明发送邮件到[email protected],本平台相关工作人员将会进行核查。