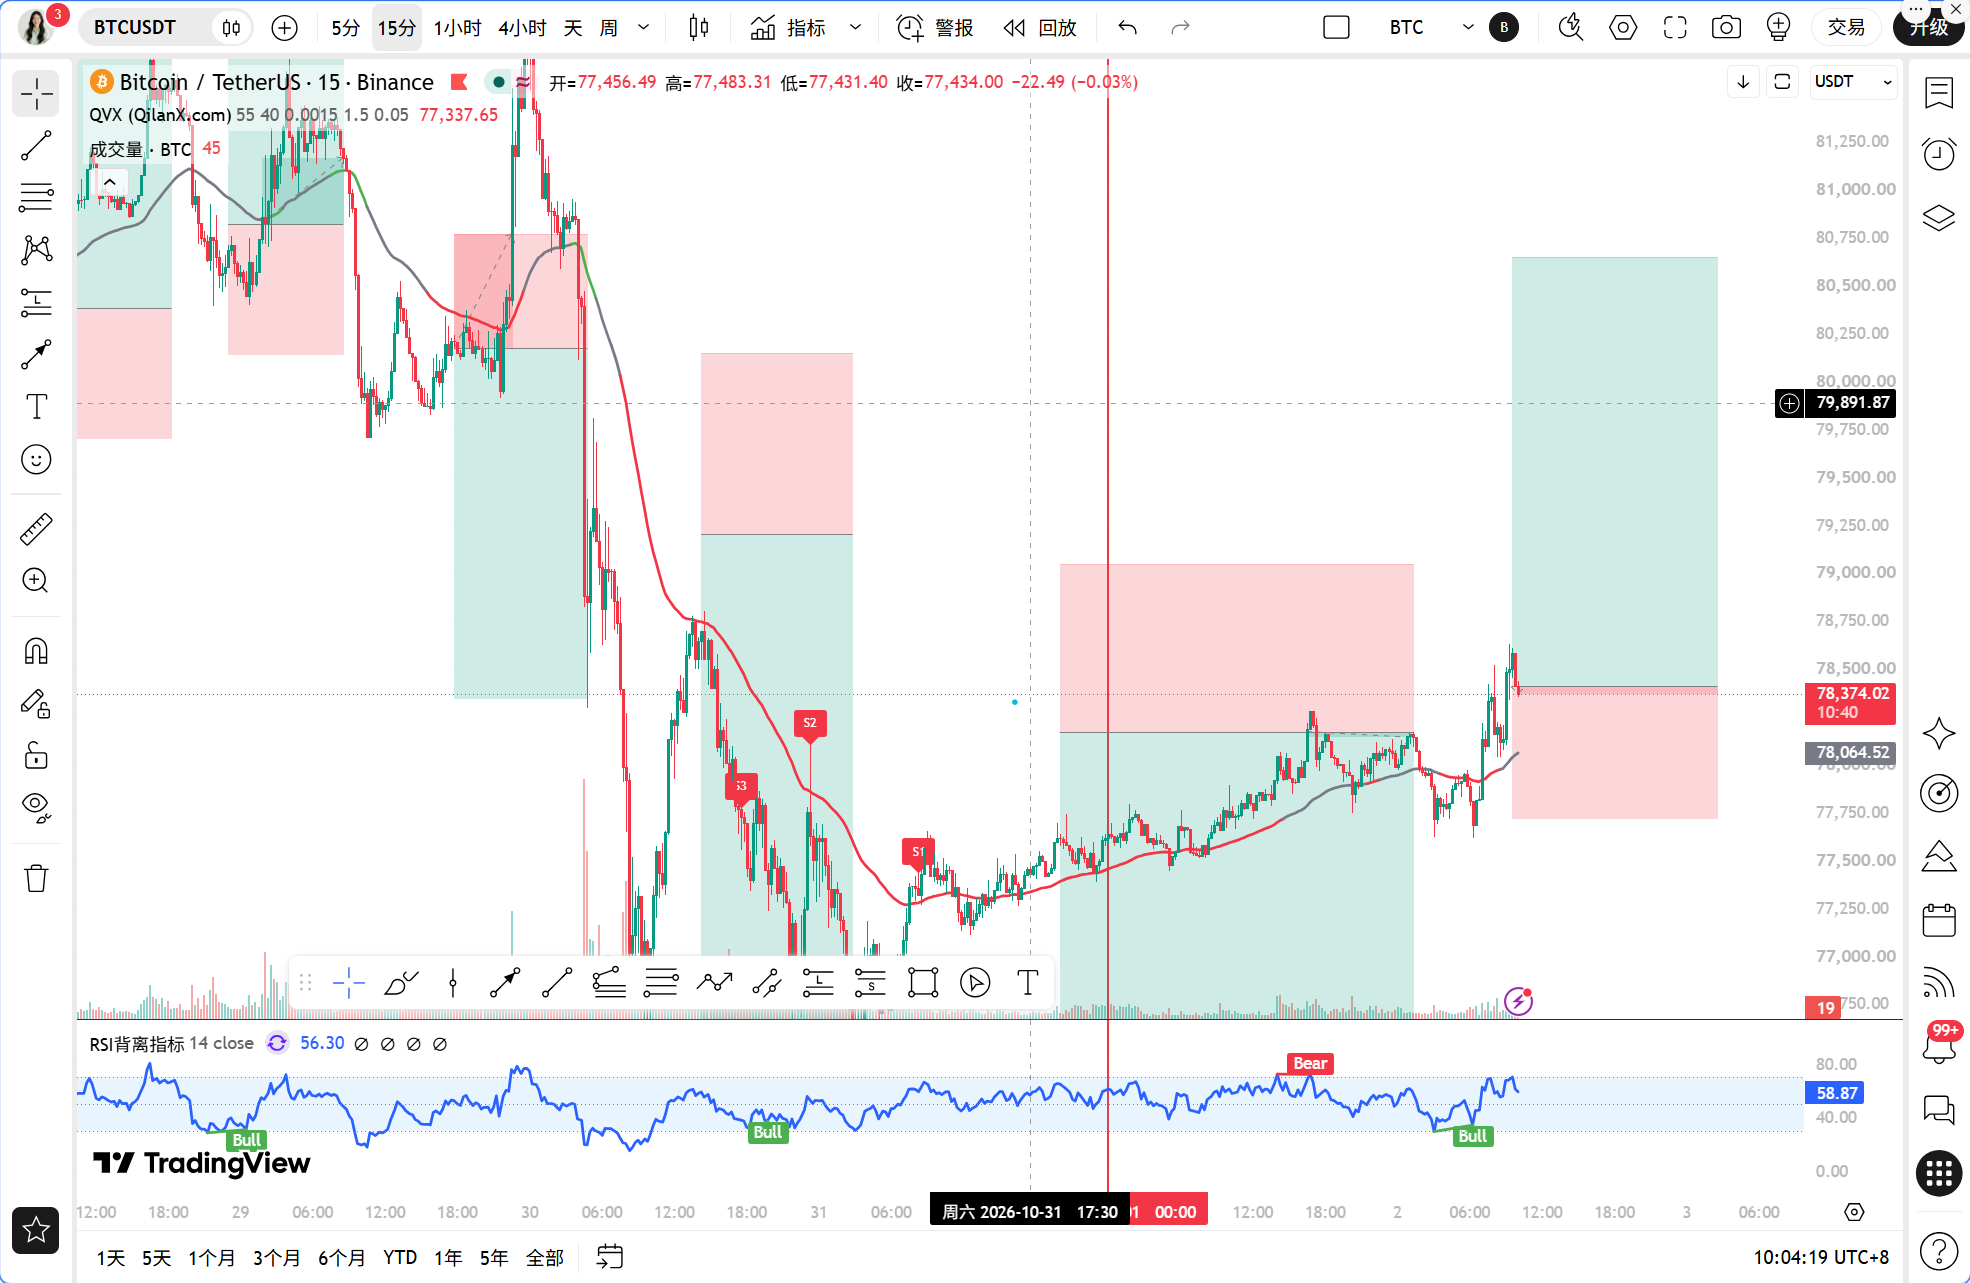
Dear teammates, the news this morning is somewhat unsettling. After Binance resumed withdrawals, there was a net outflow of 3.64 billion USD in a single day, a figure that would typically trigger a wave of panic selling; meanwhile, losses from crypto attacks in October have accumulated to 6.48 billion USD, and the BTCPay Server hot wallet has also been attacked, raising security and trust issues once again. Not to mention the geopolitical news about Israel's preparations against Iran and the rising likelihood of joint action between the US and Israel, causing risk aversion to weigh heavily on risk assets. However, interestingly, BTC did not experience a collapse-style decline, but instead slightly increased by 0.98% in 24 hours, stabilizing at 78,374 USDT. This state of being heavily burdened with bad news yet unable to drop is precisely the signal that Qinglan Jie will focus on today.
Current Price and Time
It is now November 2nd, 10:04 AM, with BTC priced at 78,374 USDT, a 24-hour increase of 0.98%, market dominance at 60.06%, and the fear and greed index at 37, indicating a state of fear. This combination is quite interesting: sentiment is cold, but the price is not weakening alongside it, indicating that selling pressure is being absorbed.
Multi-Period Overview
First, looking at the daily chart. MA5=77,934.14, MA10=79,311.68, MA30=81,709.07, with moving averages showing a bearish arrangement; the price is struggling near MA5 but remains below MA10 and MA30. The MACD's DIF=-1,119.12, DEA=-737.62, and histogram=-381.50, showing that bearish momentum is still being released but the histogram is not continuing to expand. RSI=35.48, approaching oversold but not in an extreme zone. Overall, the daily chart is showing a weak repair pattern, not a strong reversal.
Next, looking at the 4-hour chart. MA5=78,095.59, MA10=77,906.41, MA30=78,778.66, with short-term moving averages beginning to flatten and showing signs of a golden cross. The MACD's DIF=-416.70, DEA=-601.47, histogram=184.77, the histogram is positive and expanding, which is a clear signal of warming momentum at the 4-hour level. However, RSI=80.56 has entered the overbought zone, indicating a need for a pullback in the short term, which must be monitored closely.
The 1-hour chart is the core of today’s discussion. MA5=78,221.10, MA10=78,057.33, MA30=77,954.93, with the moving averages showing a clear bullish arrangement forming. The MACD's DIF=120.18, DEA=87.18, histogram=33.00, the histogram is positive above the zero line after a golden cross. RSI=62.09, slightly strong but not overbought. EMA55=78,024.04, with the current price of 78,374 clearly above it.
On the 15-minute level, MA5=78,472.61, MA10=78,333.46, MA30=78,037.31, with a clear bullish arrangement. The MACD histogram=35.75 is positive, and RSI=67.40 is slightly strong. The overall structure for the short cycle is bullish, but the 15-minute RSI is approaching 70, indicating that chasing after highs requires waiting for a pullback.
TPV Signal Verification
Following the Qinglan TPV system's rules, we check against each condition. In terms of trend positioning, the current price of 78,374 is greater than the 1-hour EMA55 of 78,024.04, indicating we are in a bullish trend area, which is the first basic condition.
Verification of long position conditions: First, the price stabilizes above the 1-hour EMA55, requiring two consecutive 1-hour candles to have closing prices greater than EMA55. From the current structure, it appears that the price has been operating above EMA55, which fulfills this condition. Second, a stable support formation, with the recent low on the 1-hour chart touching around 77,954 before rebounding; MA30=77,954.93 provides effective support, meeting the criteria for rebounding from an effective low point. Third, declining bearish momentum, with the 1-hour MACD histogram positive and DIF above DEA, and RSI rebounding from a low to 62.09, showing no signs of weakening in momentum. All three conditions are simultaneously met, and the TPV system indicates a bullish signal.
However, the oscillation auxiliary data needs to be addressed separately: the closing prices above EMA55 in the past 8 1-hour candles were 4/8, with only 1 instance crossing over, and the current absolute distance from EMA55 is 0.45%, which does not meet the oscillation threshold, leading the system to conclude that it may be in a unidirectional trend. This suggests a bullish bias in directional choice, but the RSI overbought condition on the 4-hour chart is the only place needing caution.
On-Chain/Funding Analysis
The funding situation is the most contradictory part today. Binance's net outflow of 3.64 billion USD is a tangible short-term bearish signal; the Coinbase Bitcoin premium index has been negative for 39 days, indicating weak purchasing power in the US market, and Bhutan's BTC holdings have dropped sharply from 13,000 to 518, suggesting that sovereign-level selling pressure has released some. However, on the other hand, Strategy has set a record with 21 billion USD in operating profits, and Saylor's continued Tracker signal suggests ongoing accumulation, indicating that institutional buying has not stopped. The fear and greed index at 37 shows that retail investors are scared, while institutions are accumulating; this type of divergence often occurs at phase bottom areas rather than at the top. Qinglan Jie’s judgment is that funding remains slightly bearish in the short term, but structural buying is providing a bottom support, so it is unwise to be overly bearish.
Key Support and Resistance Levels
The first pressure point above is at the 1-hour MA5 of 78,221, which has already been surpassed; the real resistance lies at the 4-hour MA30 of 78,778.66, a position that the bulls must conquer, and once achieved, it opens up space towards 79,311 (daily MA10). The first support below is at the 1-hour EMA55 of 78,024.04, which serves as the TPV system's dividing line between bullish and bearish; if broken, the signal is invalidated. The second support is at the 1-hour MA30 of 77,954.93, and below that is the daily MA5 of 77,934.14, with these three levels almost overlapping in the 77,930 to 78,030 range, creating a dense support zone. In other words, the 78,000 level is the critical line for today.
Trading Strategy
Direction: Bullish bias, but only on pullbacks not chasing highs. The overbought condition on the 4-hour RSI diminishes the cost-effectiveness of entering long directly at the current price of 78,374.
Entry Conditions: Wait for the price to pull back to the 78,050 to 78,150 range, and when a 1-hour candle shows a long lower shadow or a bullish engulfing stabilization pattern, while also ensuring the 1-hour MACD histogram does not turn negative; only then can you enter in batches. If the price breaks above 78,778 with volume and stabilizes, one may follow in lightly after confirming a pullback to 78,700.
Stop Loss: Set uniformly below 77,900, which is below the overlapping support of the 1-hour MA30 and daily MA5. A break below this position means the TPV bullish signal is invalidated, and one must exit without holding the position.
Target Price: The first target is 78,778 (4-hour MA30), and the second target is 79,311 (daily MA10); if sentiment supports, it can extend to around 79,700. The profit-loss ratio based on the first target is about 1 to 1.5, and based on the second target about 1 to 2.5, meeting system requirements.
Risk Warning
In one sentence: Escalation of geopolitical conflicts and the fermentation of security incidents may interrupt the technical structure at any time, and position management always takes precedence over directional judgment.
Follow Qinglan Crypto Classroom for more trading opportunities! Welcome to visit the official website www.qinglan.org
📊 Qinglan TPV Trading Strategy Backtest Reference
🕒 Last Backtest Time 11-02 07:00:02
Total Analysis: 4,827 Backtest: 4,820 Accuracy: 76.3% (3,678/4,820)
免责声明:本文章仅代表作者个人观点,不代表本平台的立场和观点。本文章仅供信息分享,不构成对任何人的任何投资建议。用户与作者之间的任何争议,与本平台无关。如网页中刊载的文章或图片涉及侵权,请提供相关的权利证明和身份证明发送邮件到[email protected],本平台相关工作人员将会进行核查。