Cryptocurrency Expert: 10.31 Bitcoin (BTC) Spikes, Whipsaw, Panic Selling: This round of decline has replayed retail investor psychology
From the historical high of 97932 to the yearly low of 57758, Bitcoin has gone through a complete large range, and is now at a critical point for directional choice. Technical analysis can tell you probabilities, but it cannot tell you destiny. Before entering any trade, first ask yourself: Where is the stop loss? How much will I lose? Can I sleep? If you cannot answer these three questions, do not act yet. This article is merely a personal chart review and does not constitute any investment advice. Cryptocurrency assets are highly volatile; please make independent decisions based on your own risk tolerance.
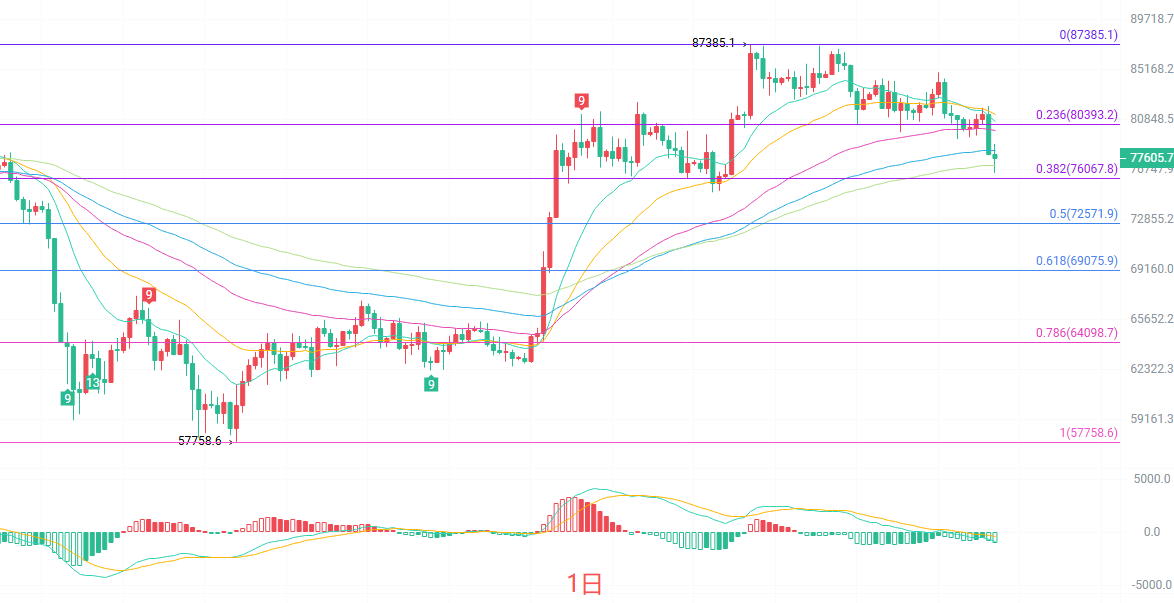
The daily K-line shows a short upper shadow, indicating that the bears are still actively pushing. In the moving average system, prices have consecutively fallen below the EMA15, 30, 60, and 90, and the only support currently is the EMA120, which is the pivot point for the mid-term bull-bear market. The green bars of MACD are still extending, indicating an acceleration phase within the bearish trend, with no signs of any bottom divergence. The lower boundary is at 78203, and the price has effectively broken below the lower boundary; it is oversold in the short term, but oversold does not equate to a bottom. Conclusion: The daily level is still in a bearish arrangement, and a rebound does not change the weak structure.
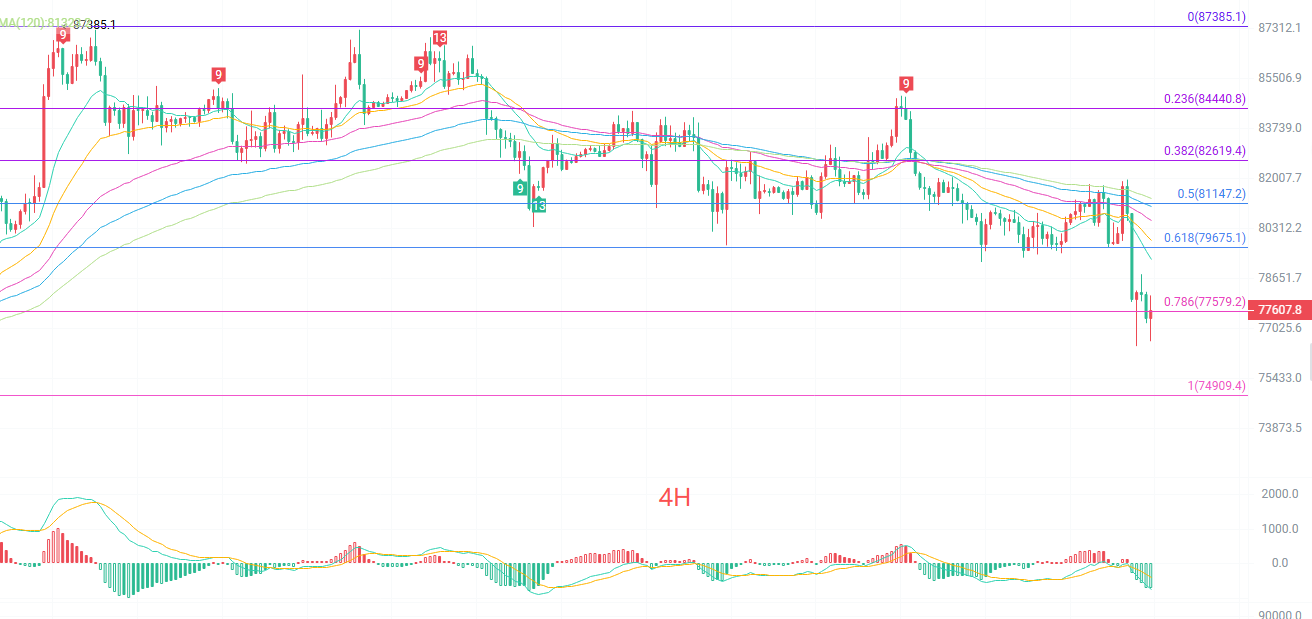
The four-hour K-line shows a weak rebound after consecutive bearish days, which is not a reversal. All moving averages are in a bearish arrangement, with EMA15 at 79275 pressing down from above, nearly 2000 points away from the current price, meaning any rebound will hit a wall first. The TD sequence has reached 5; according to DeMark counting, it usually needs to go down a few more bars to easily form a short-term low, but this is just a probability, not a law. The MACD continues to open below the zero line, with green bars not significantly narrowing. The lower boundary is at 77263; today, it reached a low of 76600, piercing the lower boundary but later recovering, indicating that there is buying support around 76600, but the strength of this support needs to be confirmed by the next K-line.
Short-term reference:
Northbound 77000 to 76500 faces resistance, stop loss 500 points, target at 78000 to 80000
Southbound 79500 to 80000 experiencing stagnation, stop loss 500 points, target at 78500 to 77500
Specific operations should primarily rely on real-time market data. For more information, you can consult the author. There may be delays in article publication; the suggestions are for reference only and risk is borne by the reader.
Friendly reminder: The above content is synchronously updated by the cryptocurrency expert on major trading platforms such as Binance, OKEx, and Huobi. For more content, you can add me as a friend inside Binance or OKEx to join my fan group.
免责声明:本文章仅代表作者个人观点,不代表本平台的立场和观点。本文章仅供信息分享,不构成对任何人的任何投资建议。用户与作者之间的任何争议,与本平台无关。如网页中刊载的文章或图片涉及侵权,请提供相关的权利证明和身份证明发送邮件到[email protected],本平台相关工作人员将会进行核查。