When looking at K-lines, don't just focus on whether the price is red or green. Price tells us where the market is going, while volume gives us a second glance: how many transactions are participating at this step.
Today let's break down the relationship between volume and price. The observations in the article correspond to the live stream on October 29, 2026, at 14:30, using the 5-minute K-line of BTC as an example.
Open the K-line, and the columns below represent the volume area. If it has not appeared yet, you can check the Volume indicator in the indicator list and follow along.
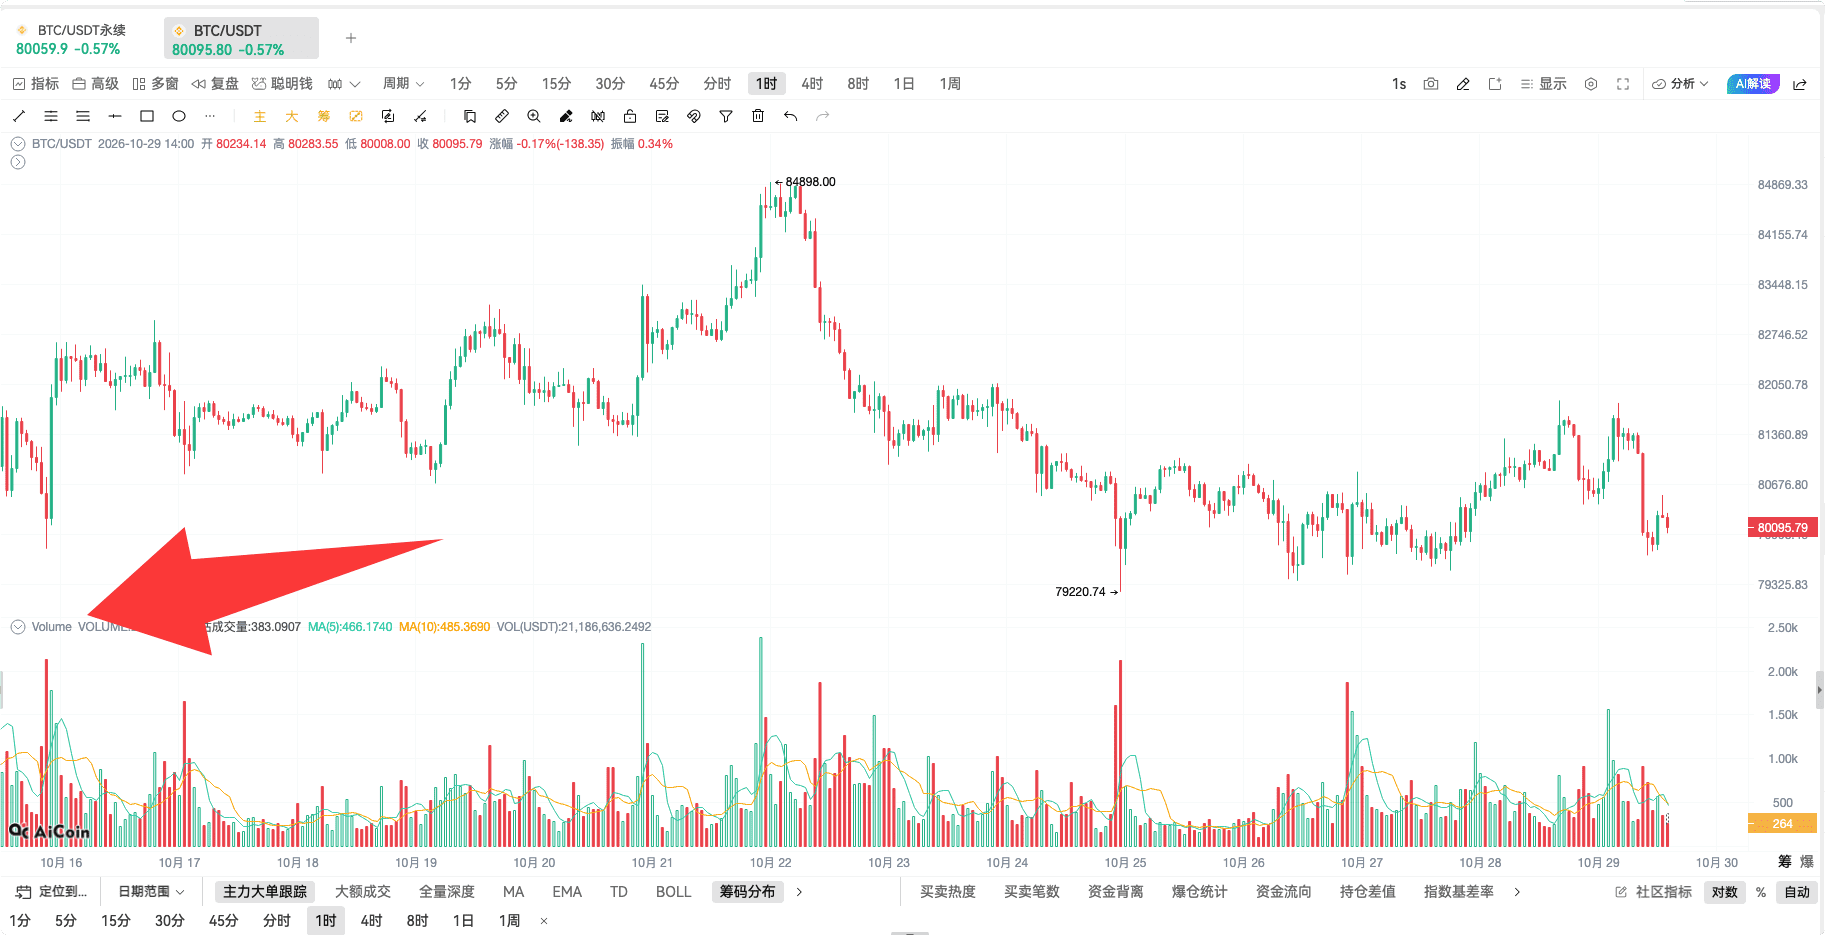
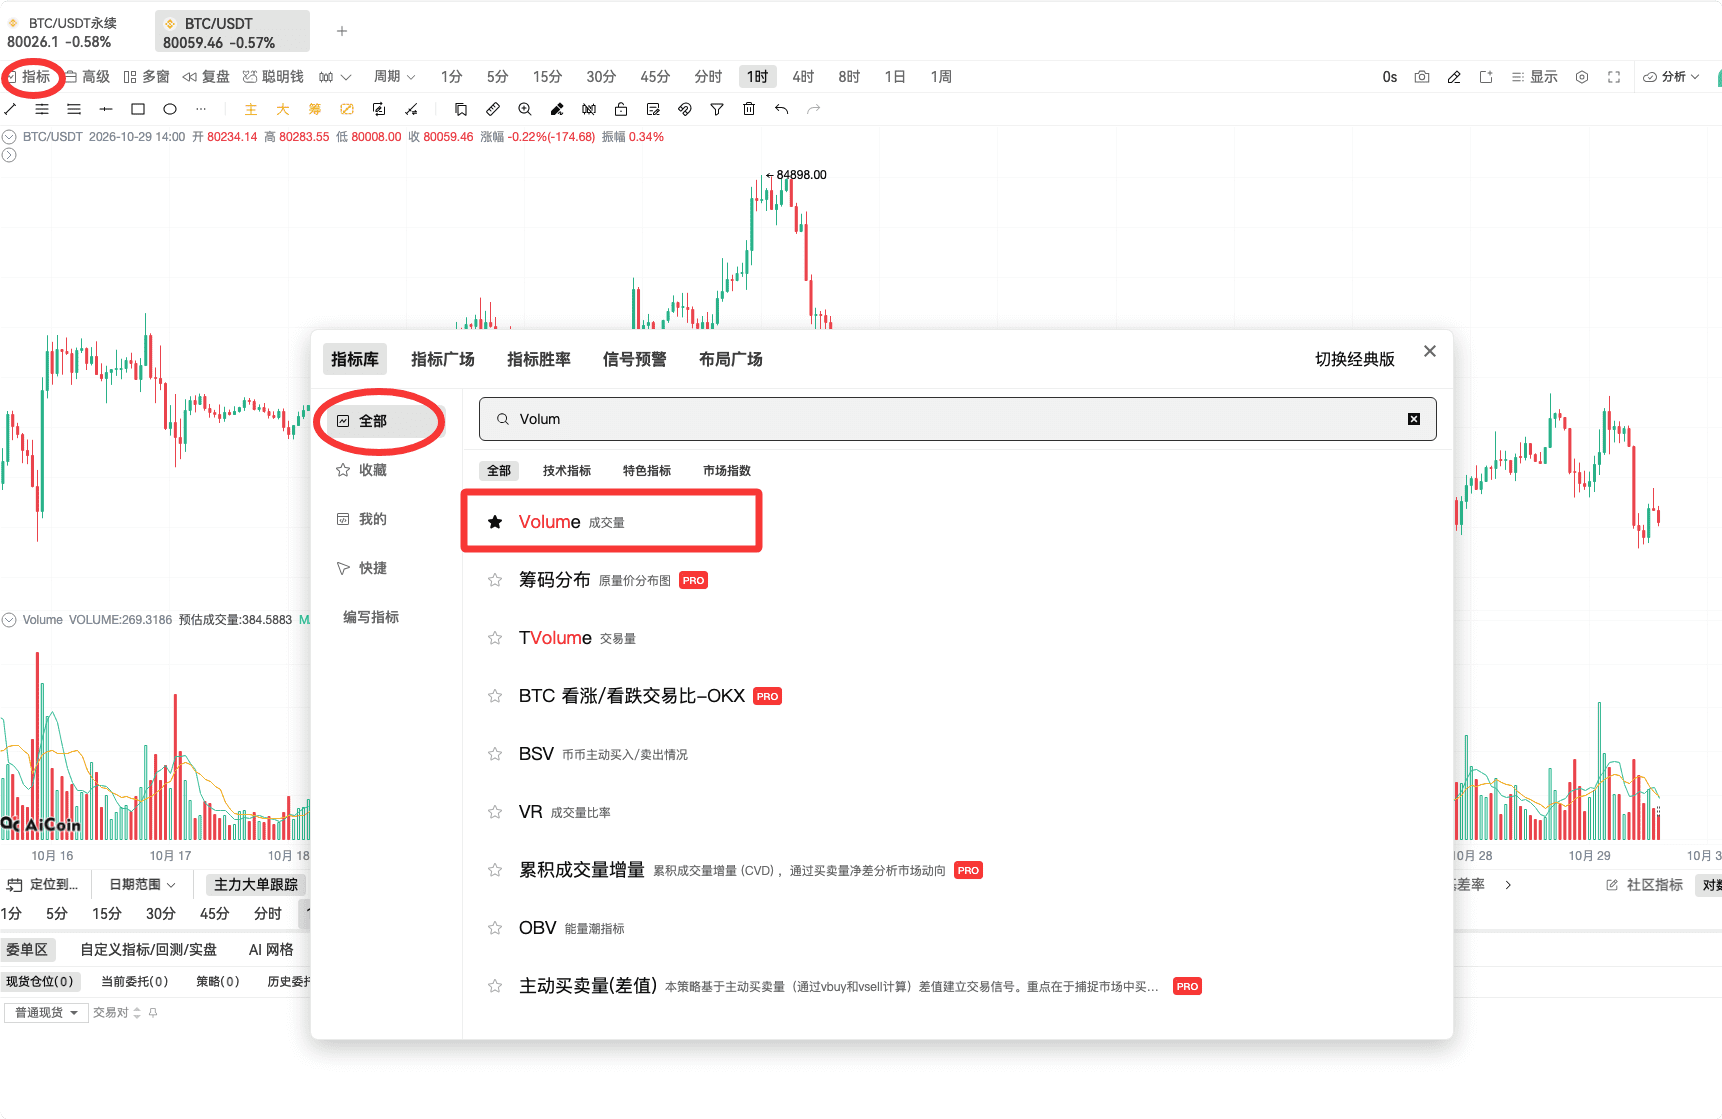
The relationship between volume and price is fundamentally four combinations: increasing volume with rising prices, decreasing volume with rising prices, increasing volume with falling prices, and decreasing volume with falling prices. The names are not difficult, but the same combination appearing in different positions can mean completely different things.
I tend to understand volume from the perspective of "divergence." At the same price level, some are willing to sell their chips, while others are willing to take the money, and only then will transactions occur. Increased volume indicates more active exchanges of chips between both parties; decreased volume indicates reduced transactions.
Understanding it as divergence and consensus helps in reading charts, but don't treat this metaphor as a formula. Volume can tell us whether trading is active or not, but it cannot directly read each person's thoughts. Reduced selling pressure, insufficient buying, or a temporary wait-and-see attitude can all cause volume to decrease. We must return to the price structure to make judgments.
Increasing volume with rising prices: Understand clearly whether it is just starting or has already increased significantly.
When both price and volume are rising, it indicates that the price is increasing while the trading volume expands. If this combination appears in the early stages of a rise, it shows that this period of increase has more active participation, which can lead to observing opportunities along the trend.
However, when the market reaches a high position, this judgment cannot be directly applied. If the price continues to push upwards but volume cannot catch up, the original rhythm of the rise may loosen. In the short term, some may capture reversals by reacting to this exhaustion, based on the fact that the subsequent rise could not be maintained, rather than saying "it's reached a new high, so it should be shorted."
Looking at the BTC 5-minute K-line for the corresponding period yesterday, this segment shows increased volume and rising price: the price rises, and the transaction volume is also increasing.
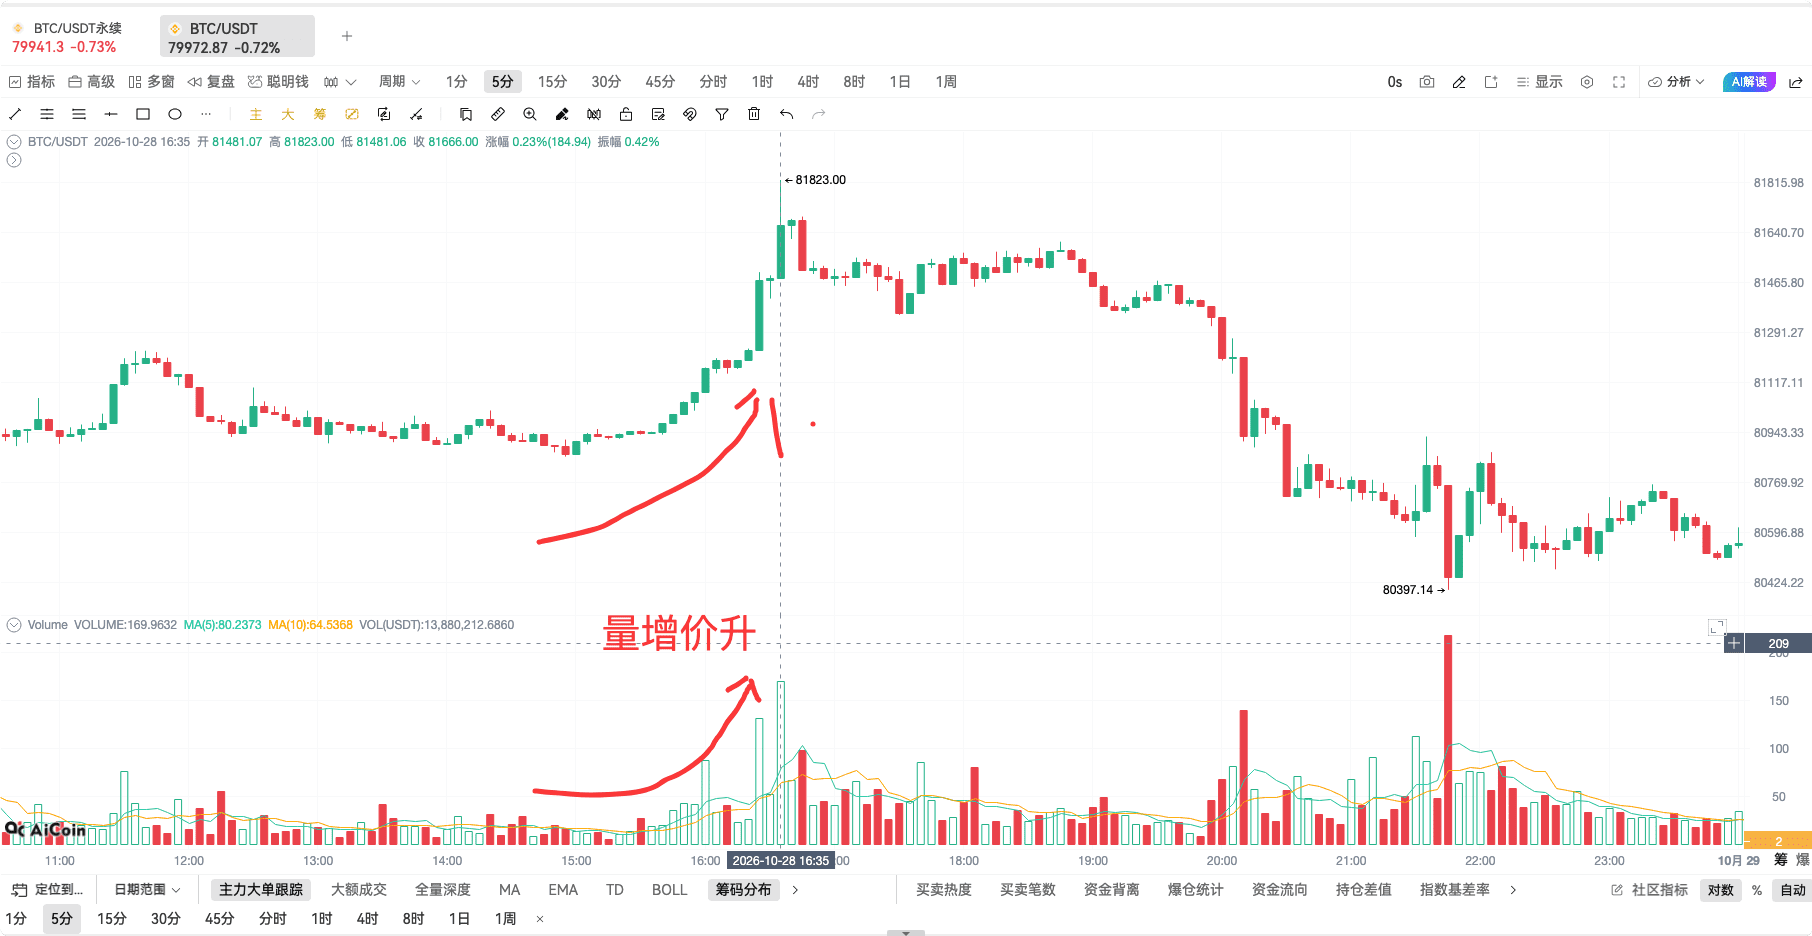
Continuing to look ahead, after the price surged, the volume could not be maintained, and the price also showed a decline. By comparing the two segments, it becomes easier to understand why I repeatedly emphasize the position. The same is true for increasing volume; it can help confirm the trend at the startup stage but needs to be monitored for its capability to continue pushing the price later on.
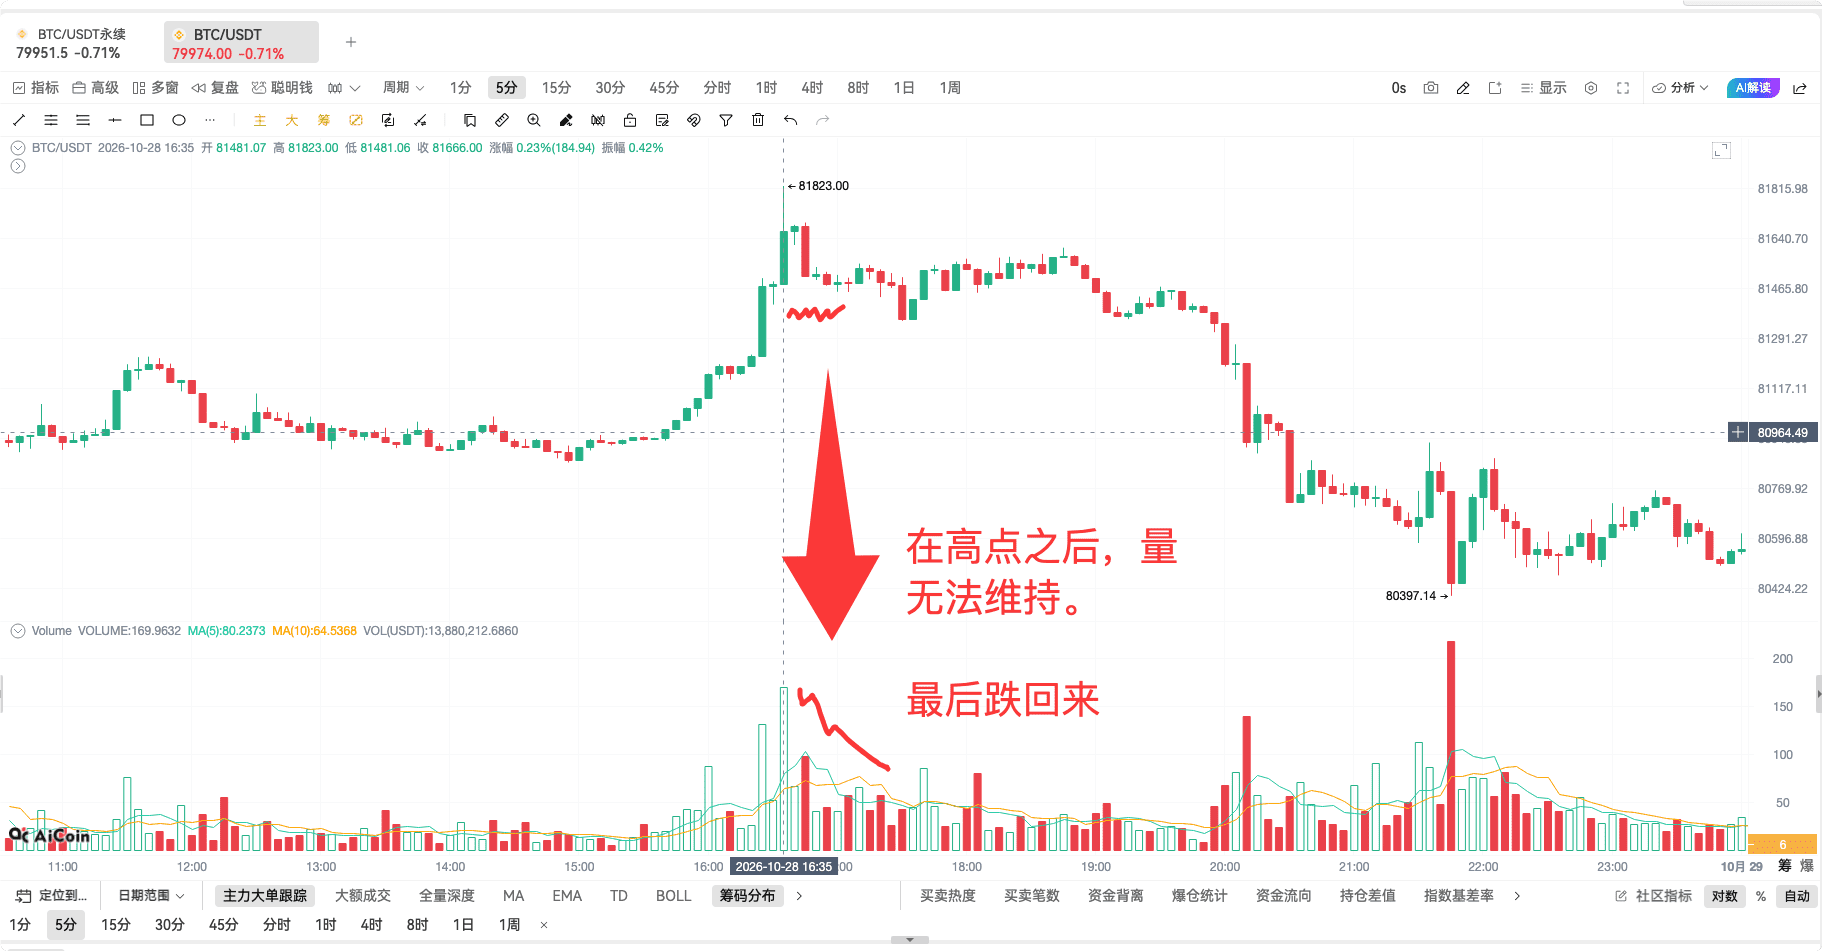
Decreasing volume with rising prices: Volume is low, but the price is still moving upward.
One possibility is that those holding positions are not in a hurry to sell, and the buying pressure does not require too much transaction volume to slowly push the price higher. I understand this state as a decrease in divergence during the rising process.
This segment in the chart shows such a combination: the price rises while trading volume gradually shrinks. If the price structure remains intact, existing holders can continue to monitor whether the trend has been damaged, as there is no need to rush to exit upon seeing decreased volume.
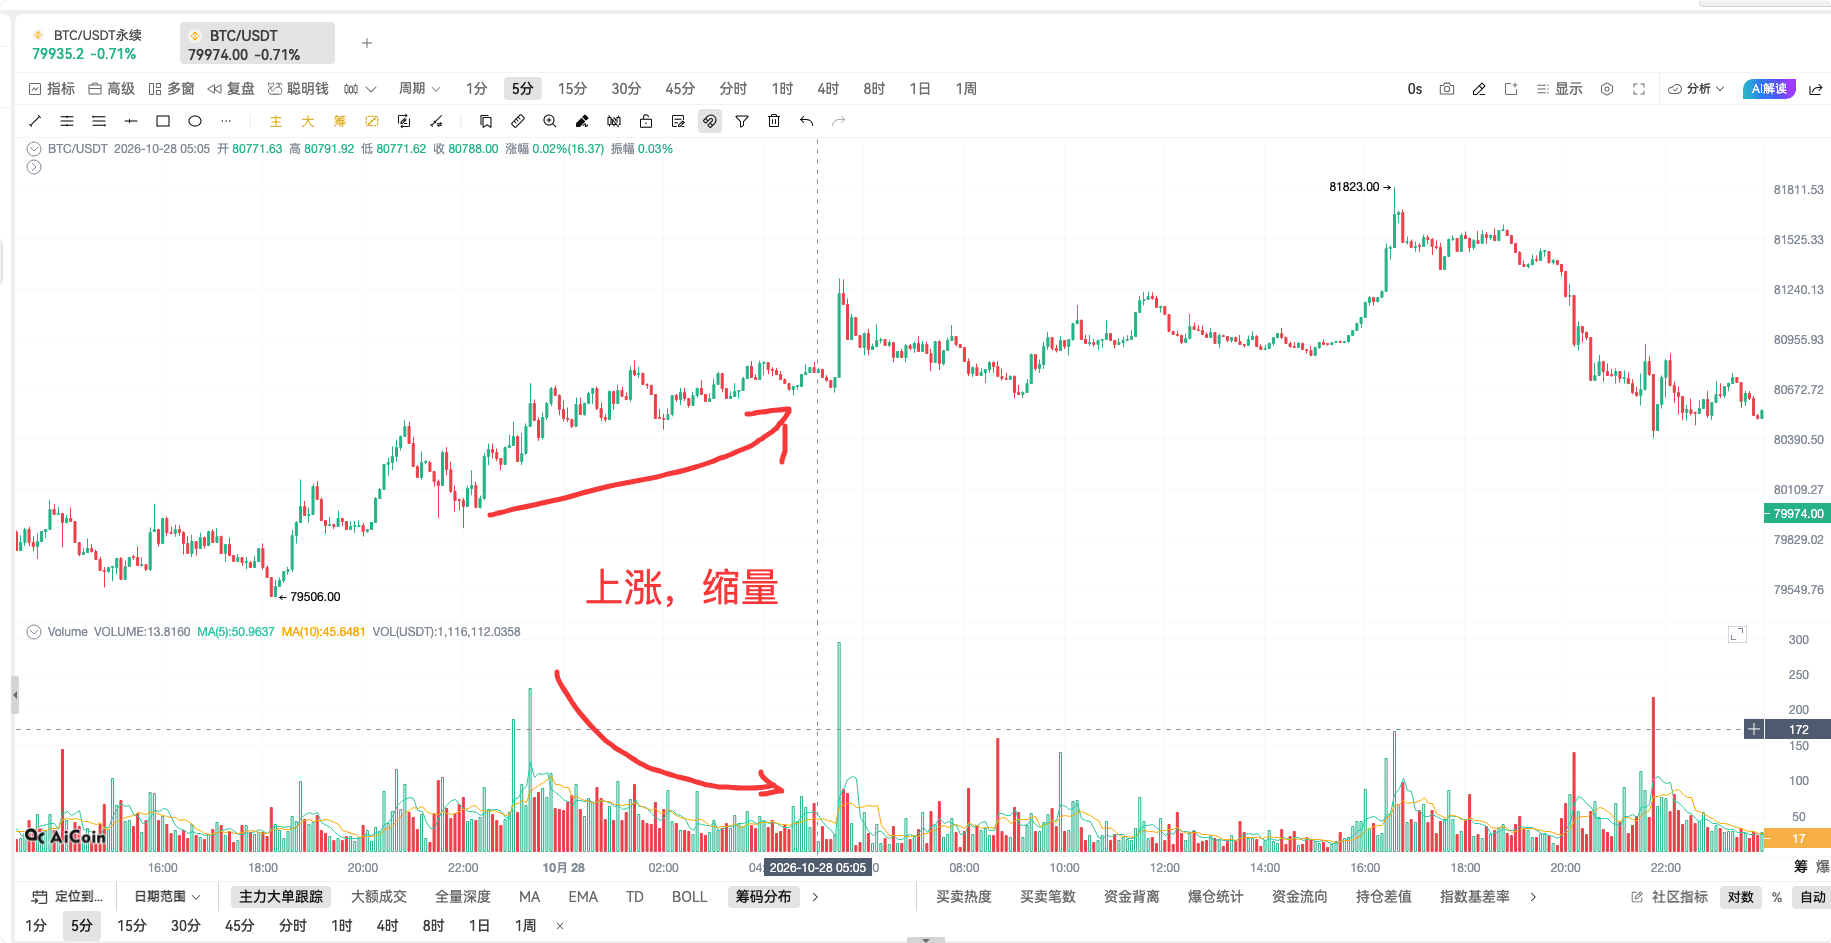
However, decreased volume may also indicate insufficient demand. Whether it is reduced selling pressure or weak buying pressure depends on whether the subsequent price can stabilize and rise after a pullback. Relying solely on shorter volume bars cannot conclusively determine that the market will move further.
Increasing volume with falling prices: Look at the early stage of decline and the release of selling pressure separately.
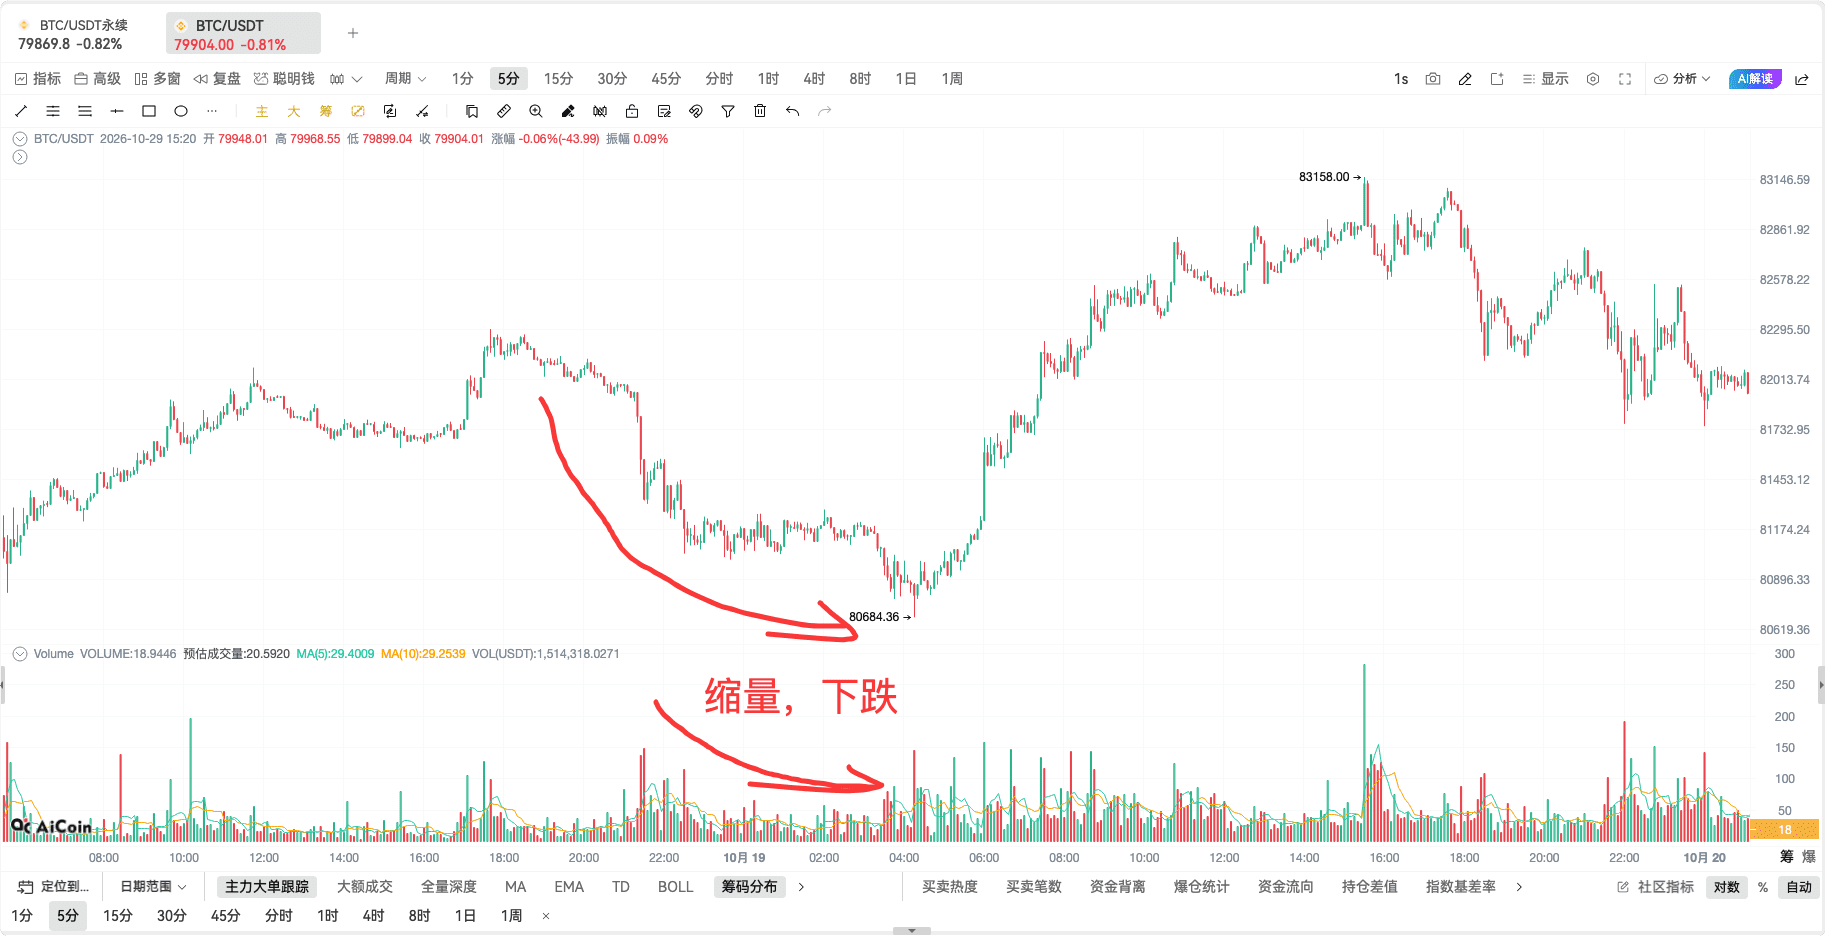
When price falls and volume increases, it indicates that while the price is declining, trading is clearly becoming more active. In the early stages of a decline, if the price structure is also weakening, it can be observed along the downward trend; towards the later stage, attention should be paid to whether the volume can be maintained or if the price has started to stabilize.
The first phase in the image shows a noticeable increase in volume during the decline. After entering the second phase, volume could not continue to be maintained and even began to shrink. At this time, it is worth noting the possibility of a rebound, but volume reduction is just an observational clue; it is necessary to wait for price evidence of support and stabilization.
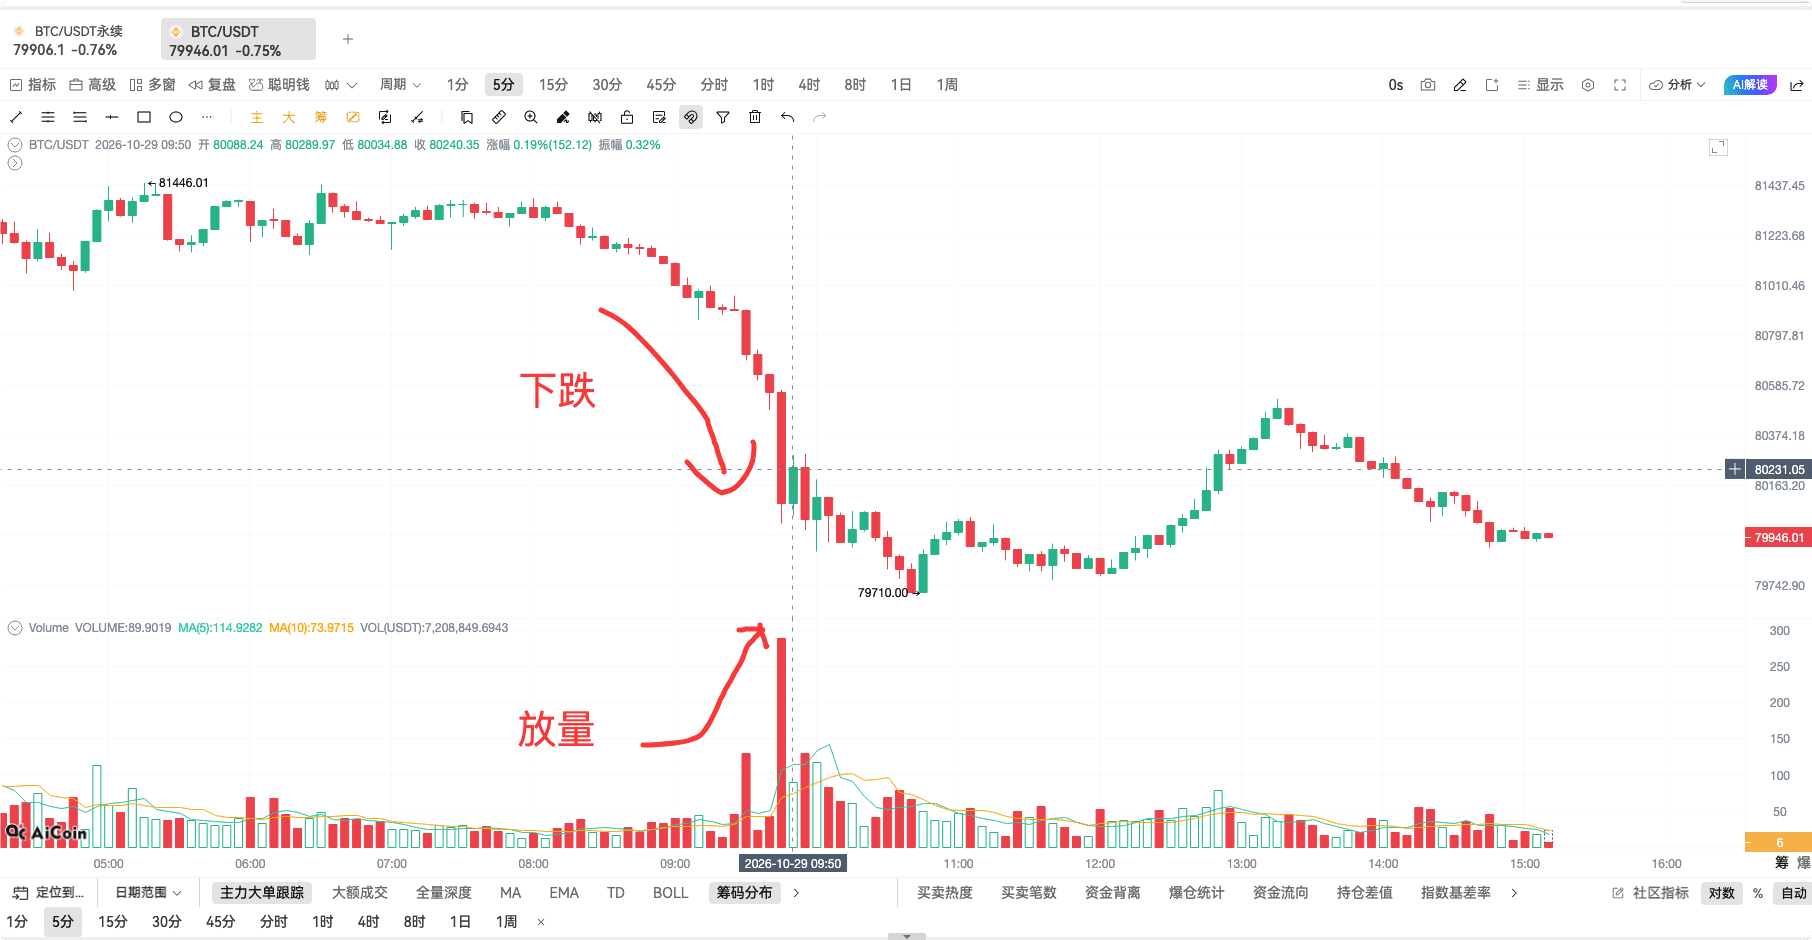
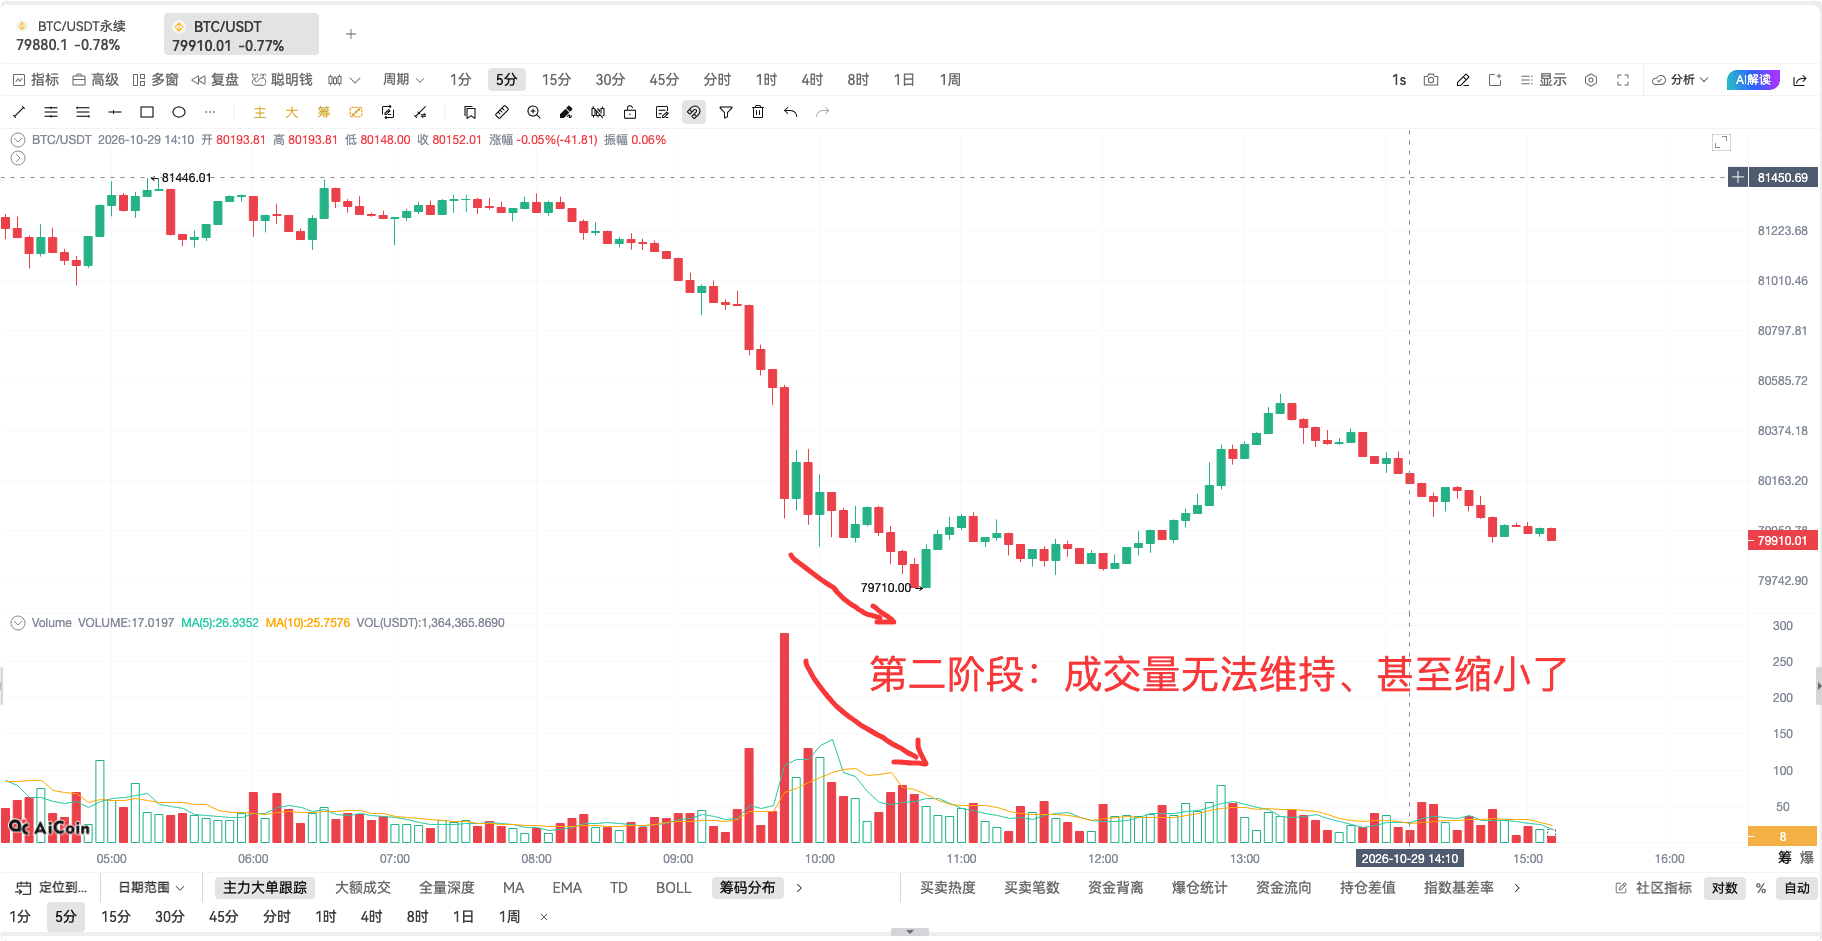
The short-term concept of "catching the needle" refers to trying to capture that rebound after a sharp decline. It sounds straightforward, but in practice, it goes against the current downward trend. Volume may have decreased, and the price could continue to fall, so it should not be taken as proof that it has already hit the bottom.
Connecting this market segment, the context becomes clearer: previously there was decreasing volume with rising prices, then it fluctuated, and then there was a surge in volume; after that, the volume lacked follow-through, and the price turned downward. The interesting aspect of volume-price analysis is that these changes occur in a connected manner; one cannot explain the entire market by isolating just one K-line.
Decreasing volume with falling prices: Don't think that just because the volume is getting smaller, it's about to bottom out.
When the price drops, reduced transactions sometimes mean that the buying support is also not active. Few sell orders are needed, and the price can still slowly move downward. This trend may last for a while; being eager to bottom fish can easily lead to an accumulation of losses.
During the live stream, the latest trend on the right side of the BTC 5-minute chart showed a state of decreasing volume with falling prices. I prefer to wait for subsequent changes rather than drawing a bottom just because "it has dropped significantly already."
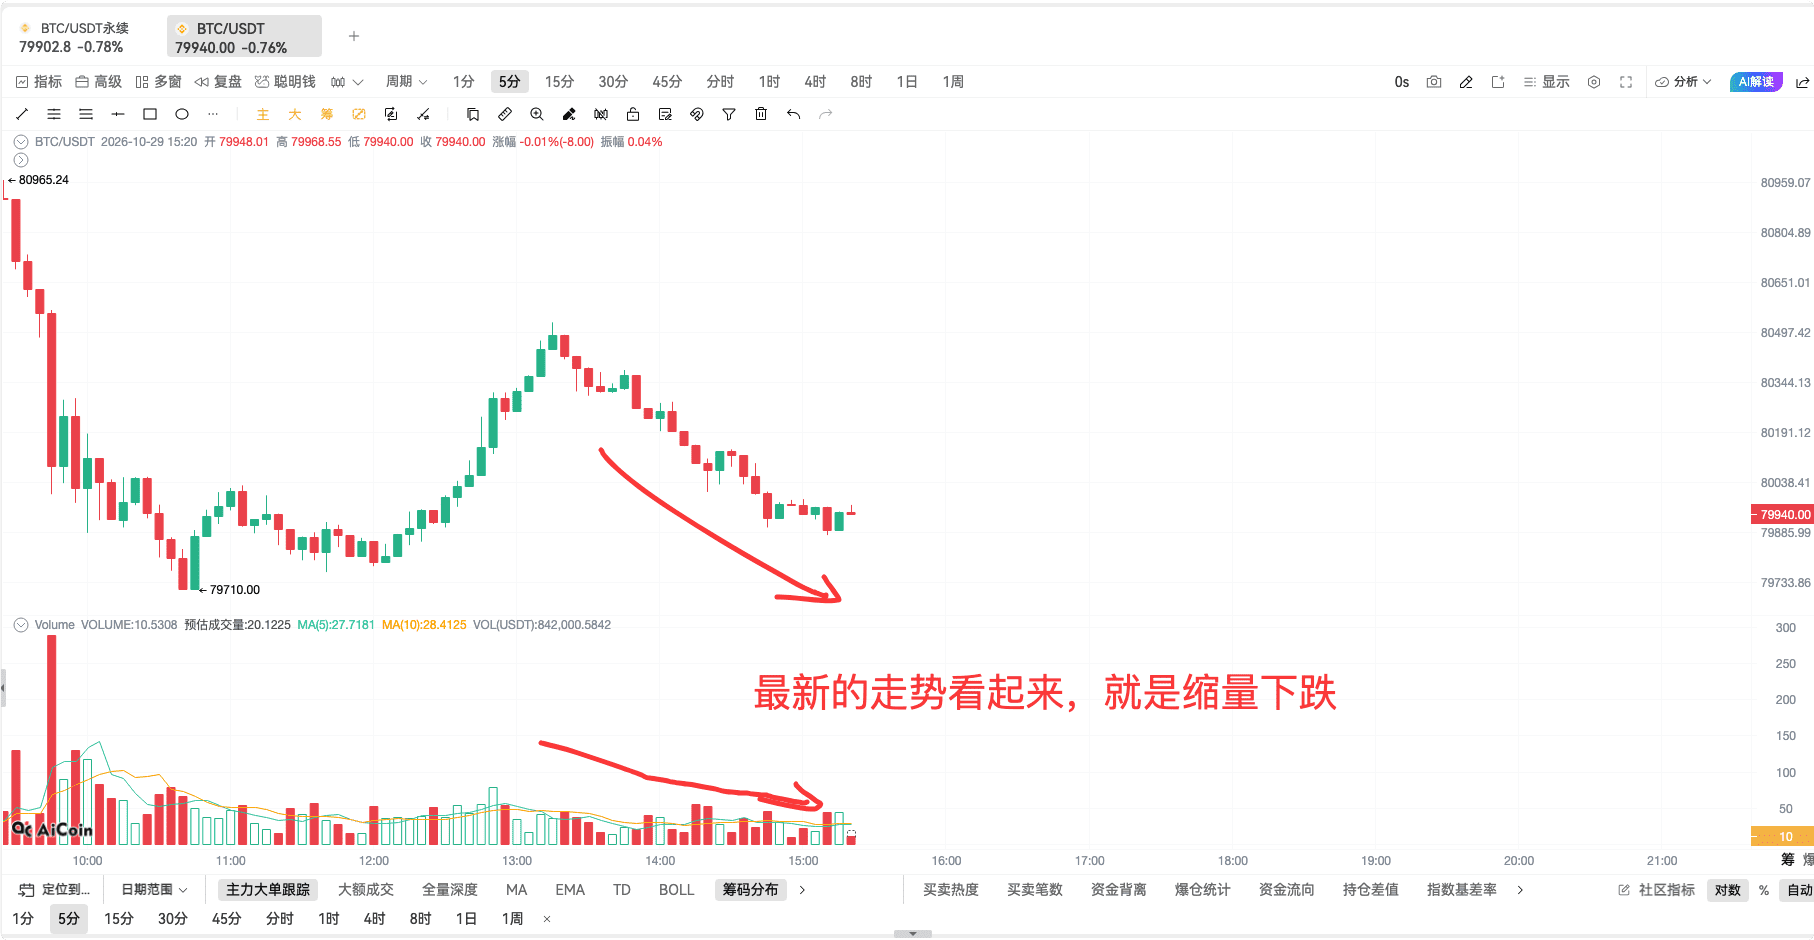
Looking at historical cases, after prolonged decreasing volume and falling prices, several noticeable K-lines with increased volume appeared, and the price gradually recovered. This reminds us to pay attention to whether the price really receives support when trading becomes active again.
Increasing bullish candles can be clues, but a single bullish candle cannot confirm a bottom. Whether it can hold, whether there is buying support during pullbacks, and whether the original downward structure is repaired—looking at these collectively makes judgments more solid.
The four combinations of volume and price ultimately revolve around two questions: What stage are we in now, and has the change in transactions been confirmed by the price? The 5-minute chart is just an example for today; when the cycle changes, the structure should be rechecked, and conclusions from one chart should not be transferred unchanged to another.
We can continue to discuss below the Wyckoff system, gradually breaking down supply and demand balance, causation laws, and input-output laws. Familiarize yourself with these four relationships so that the next time you face a trend, you won't just fret over ups and downs but can ask: At this price point, is the volume keeping up?
Currently, there are live streams every day, and you're welcome to keep following AiCoin partners! Reserve your spot in advance 👇
https://www.aicoin.com/zh-Hans/live/list?tab=upcoming
Join our community to discuss and grow stronger together!
Official Telegram community: https://t.me/aicoin_support
AiCoin Chinese Twitter: https://x.com/AiCoinzh
Hype commission: https://app.hyperliquid.xyz/join/AICOIN88
Binance commission: https://jump.do/zh-Hans/xlink-proxy?id=3 Invite code: aicoin668
Coinbase commission: https://jump.do/xlink?checkProxy=true&proxyId=25 Invite code: Y8L23JL
免责声明:本文章仅代表作者个人观点,不代表本平台的立场和观点。本文章仅供信息分享,不构成对任何人的任何投资建议。用户与作者之间的任何争议,与本平台无关。如网页中刊载的文章或图片涉及侵权,请提供相关的权利证明和身份证明发送邮件到[email protected],本平台相关工作人员将会进行核查。