Behind the 3000-point decline of Bitcoin, why is the bull line so easily broken?
Today, Bitcoin experienced a rapid adjustment within the day. As of now, the current price of Bitcoin is 78500, a decline of about 3000 points from the 81689 level earlier this morning, with an intraday fluctuation of nearly 3%. Comparing the daily and 4-hour periods, this round of decline shows characteristics of a short-term breakdown and a medium-term pullback.
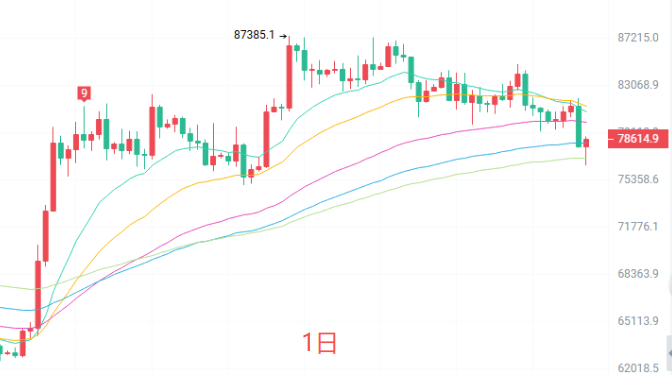
At the early morning point, the price was still around 81689, at the upper edge of the consolidation range after the drop from the high of 87385. In comparison to the daily chart at this moment, the closing price has fallen to around 78614, with an intraday low of 76444. The current price has broken below EMA15, EMA30, and EMA60, only gaining temporary support above EMA90 and EMA120. The MACD indicator's DIF and DEA continue to diverge downward, with the green bars expanding, indicating a bearish short-term momentum at the daily level, and the price is approaching the lower band at 78513, with the middle band around 84379 acting as resistance above.
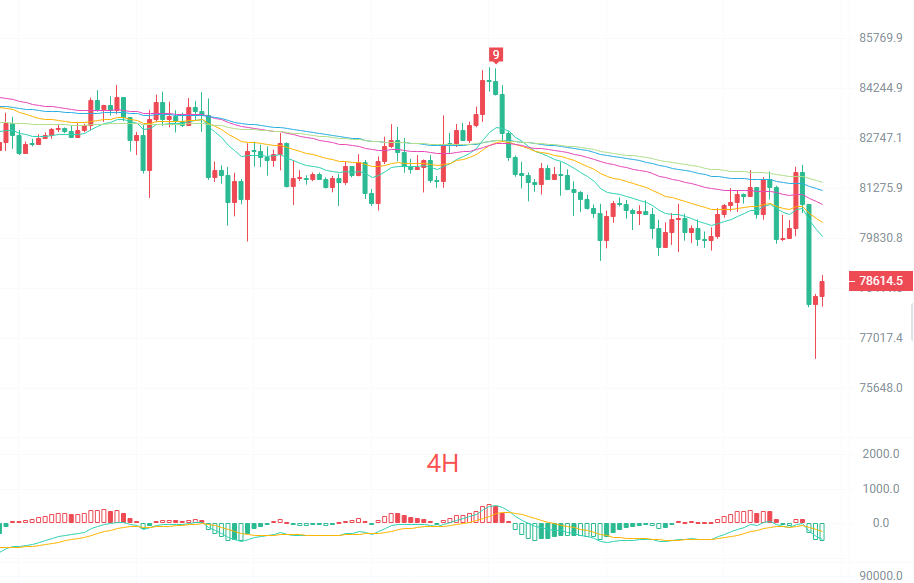
The price on the 4-hour chart is still around 81628, in a high-level fluctuation range after the rebound from 79178 to 84440. At this moment, the 4H level has formed a typical bearish arrangement with EMA stacked in order from top to bottom, with the price operating below all moving averages. The MACD on the 4-hour period also maintains green bars, and the lower band at 78192 is currently being tested.
Support below:
76444 today's intraday low
76067 daily 0.382 retracement
75025 previous low
Resistance above:
79675 at 4H 0.618 retracement
80393 daily 0.236 retracement
81446 Bollinger Band upper edge
In conclusion, the short-term has confirmed a breakdown downward, and the medium-term is currently testing the key Fibonacci support area. Moving forward, it is necessary to observe whether the range between 76000–76500 can stabilize; if this range holds, the daily level still represents a normal pullback in an upward trend; if it effectively breaks down, then we need to be cautious of deeper adjustment risks.
Warm reminder: The above content is updated simultaneously on major trading platforms such as Binance, OKEx, Huobi, etc. More content can be found by adding me as a friend in the Binance OKEx fan group.
免责声明:本文章仅代表作者个人观点,不代表本平台的立场和观点。本文章仅供信息分享,不构成对任何人的任何投资建议。用户与作者之间的任何争议,与本平台无关。如网页中刊载的文章或图片涉及侵权,请提供相关的权利证明和身份证明发送邮件到[email protected],本平台相关工作人员将会进行核查。