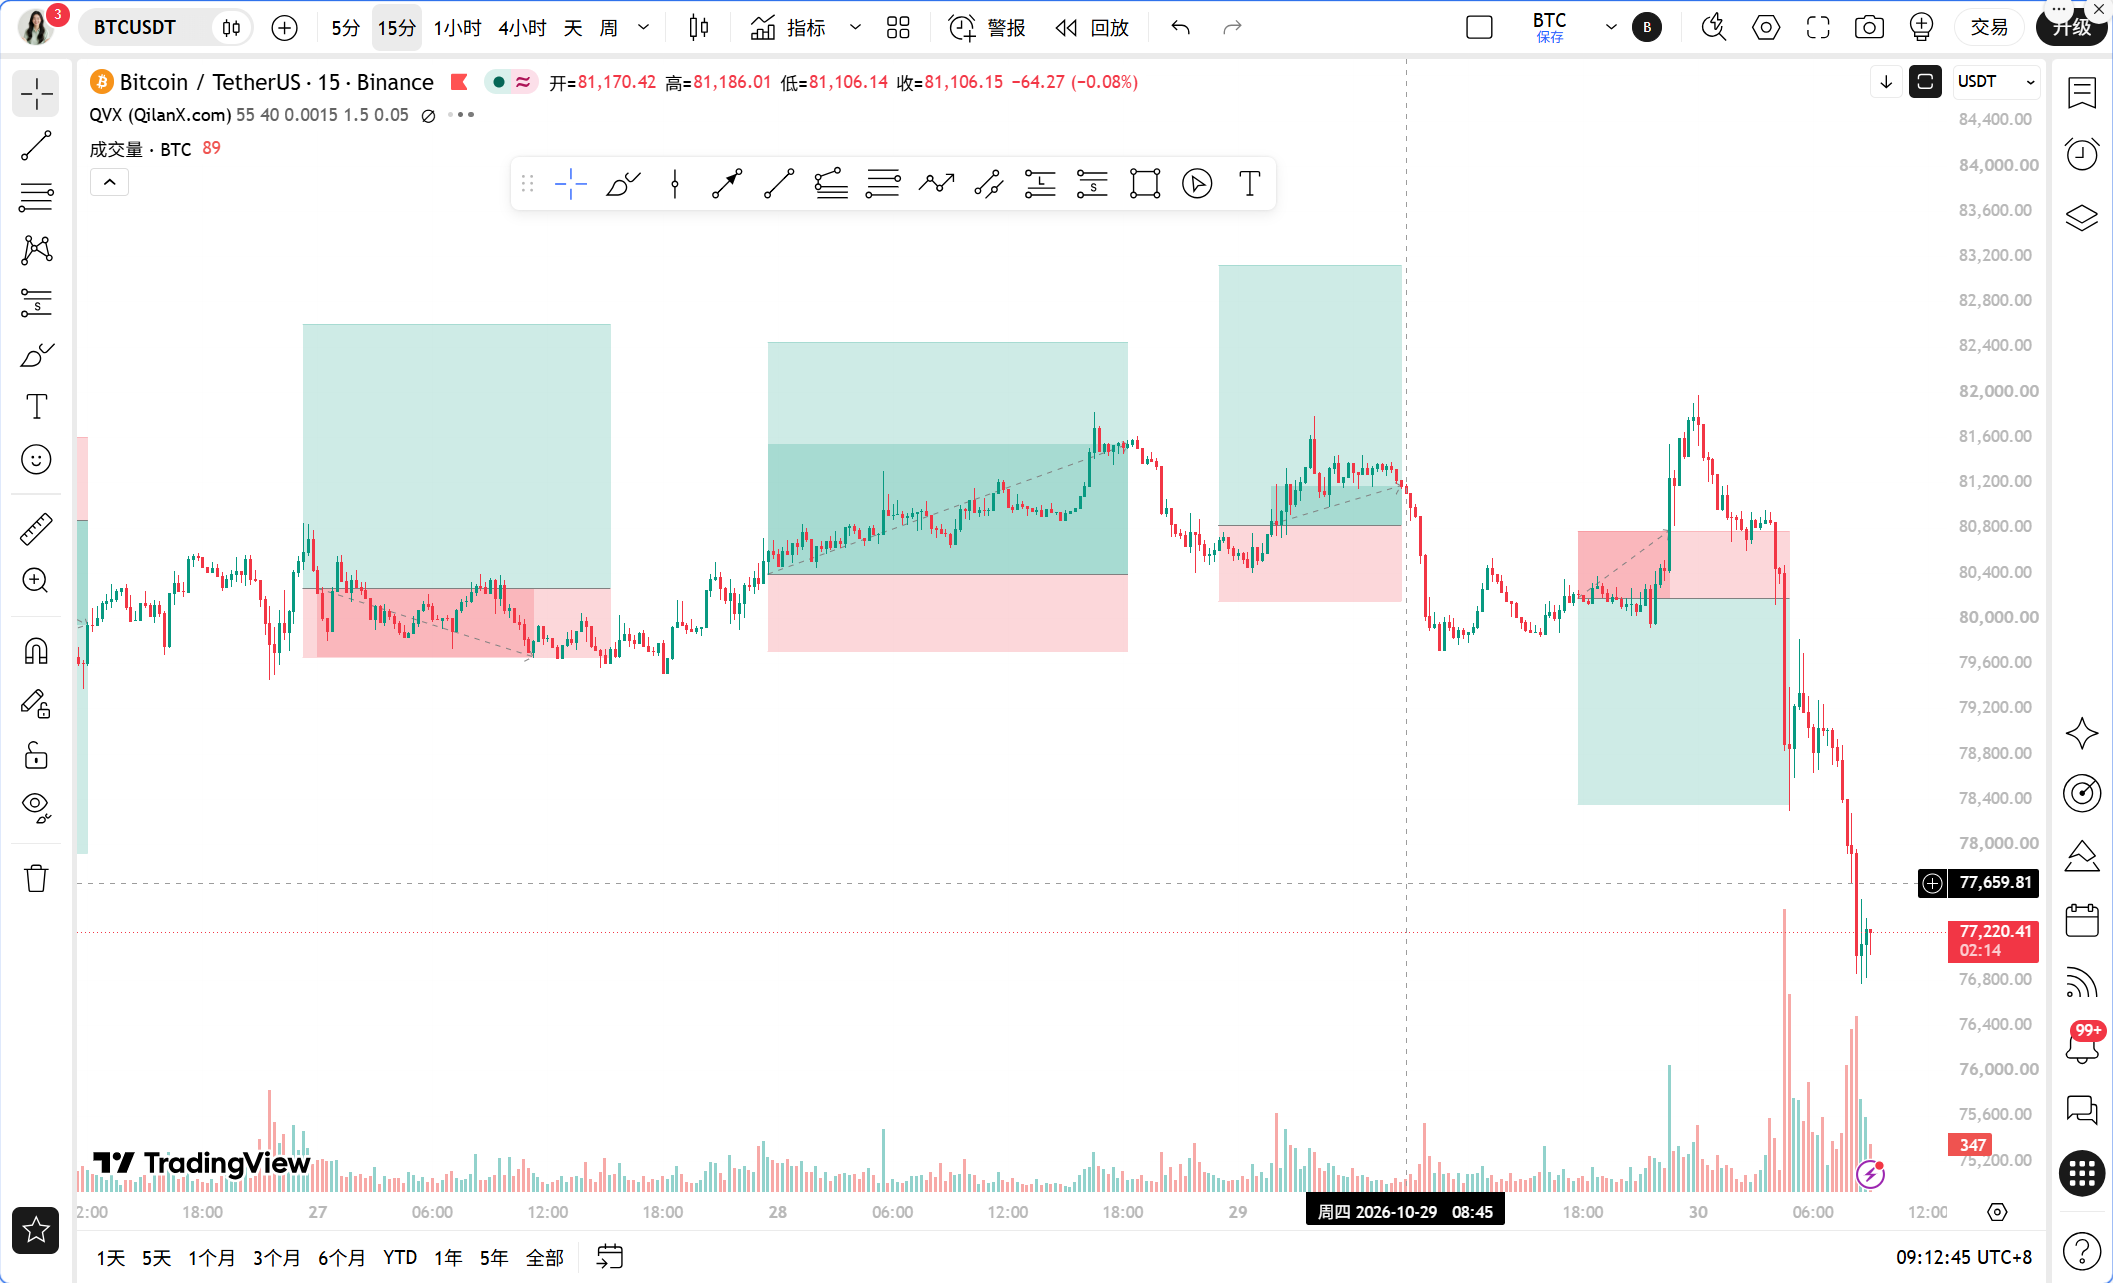
Team members, this morning when I opened the market, I believe many people's mindset collapsed. Binance's hot wallet is suspected of being attacked, with 2.5 billion dollars of assets transferred unusually, and the funds have already flowed to Tornado Cash, making recovery extremely difficult. Although CZ urgently stated that losses could exceed 1 billion dollars and will be fully borne, and the official also promised to cover, trust restoration takes time, and the market is voting with its feet. What's more troublesome is that on-chain data shows that funds flowing out of Binance reached 5.6 billion dollars, Tether froze 1.567 billion USDT, and the scale of frozen stablecoins reached 2.3 billion, causing liquidity to tighten abruptly. This is not a single event impact, but a combination of three pressures: security crisis, capital flight, and liquidity contraction. Meanwhile, the probability of the Federal Reserve raising interest rates by 25 basis points in December has risen to 79.6%, and the U.S. September PCE year-on-year at 3.6% exceeded the target. Accelerating inflation further heats up the tightening expectations. Both macro and micro lines are under pressure, and BTC has been diving after breaking below 79,000, currently priced at 77,361 USDT, down 4.84% in 24 hours. In this situation, the worst thing to do is to bottom fish based on feelings; the system must speak.
Current price and time
Current time is October 30, 09:13, BTC price is 77,361 USDT. The fear and greed index is 30, in the fear range, indicating that market sentiment is relatively cold but has not yet reached extreme panic, which means that selling pressure may not have fully released. BTC market share is 59.28%, funds are concentrating on Bitcoin for safe haven, but the overall market value is shrinking, indicating a pattern of existing game or even reduction game.
Multi-period status overview
First, let's look at the daily chart. MA5 is at 79,551, MA10 is at 80,549, MA30 is at 82,370, and the moving averages are clearly forming a bearish arrangement, with the price far below all three moving averages. In terms of MACD, DIF is -891.78, DEA is -401.30, and the column value is -490.48, with negative columns still expanding, showing no signs of crossing. The daily RSI is 32.56, close to oversold but has not yet entered the extreme area below 30. The daily conclusion is clear: bearish trend dominates, and downward momentum has not exhausted.
Next, let's look at the 4-hour chart. MA5 is at 79,629, MA10 is at 80,135, MA30 is at 80,333, also in a bearish arrangement. MACD's DIF is -436.16, DEA is -157.47, column value is -278.69, with negative columns continuing. The 4-hour RSI is 33.59, weak but showing no divergence signal. The 4-hour level has no structure showing any stabilization in the downtrend; the trend continues downward following the daily chart.
The 1-hour chart is the core period of the TPV system. MA5 is at 78,129, MA10 is at 79,337, MA30 is at 80,133, and the price 77,361 is below all moving averages. The critical dividing line EMA55 is at 80,145.89, and the current price is 3.47% away from EMA55, far in the bearish area. MACD's DIF is -700.33, DEA is -335.60, column value is -364.73, in negative column status. The 1-hour RSI is 29.43, having entered the oversold zone below 30, which is the only point worth noting, indicating the possibility of a technical rebound short-term, but a rebound does not equal a reversal.
On the 15-minute level. MA5 is at 77,334, MA10 is at 77,967, MA30 is at 79,311, and the price fluctuates near MA5, showing slight signs of stopping the drop short-term. MACD's DIF is -792.52, DEA is -664.64, and column value is -127.88, with negative columns narrowing. The 15-minute RSI is 18.89, deep in oversold. The 15-minute signal indicates that short-term selling pressure has somewhat released, and a small rebound may occur, but under the pressure of the hourly and 4-hour bearish trend, the rebound space is limited, more of a corrective rebound than a trend reversal.
TPV signal verification
According to the Qinglan TPV system rules, verify item by item. In trend positioning, the current price of 77,361 is clearly below the 1-hour EMA55 of 80,145.89, placing it in the bearish trend area, that is a major premise.
Short-selling condition verification: First, the price is under pressure below the 1-hour EMA55, with two consecutive 1-hour candle closing prices below EMA55, which is satisfied. Second, the pressure meets resistance shape, as the recent K line overall runs below the moving averages, and rebounds touch MA5 and MA10 immediately retreat, conforming to the characteristic of retreating from effective high points. Third, the rebound is weak; although the negative column of the 1-hour MACD has a large absolute value, it needs to be observed whether it continues to shorten; currently, both DIF and DEA are negative, and DIF is below DEA, indicating bearish momentum still exists; RSI is recovering from low levels but still around 30, and an effective momentum exhaustion reversal signal has not yet formed. Among the three conditions, trend and pressure clearly meet, and the momentum condition is in observation window, overall determining it as a continuation of bearish trend, with valid short-selling signals but needing to be cautious of short-term oversold rebound risks.
Handling of the oscillating market: In the past 8 1-hour candles, the closing prices greater than EMA55 occurred 2/8 times, with 1 crossover, and the current price is 3.47% away from EMA55, which is far greater than the 0.3% threshold. The system clearly judges that it currently does not meet the oscillating conditions and is in a one-sided trend. This is very crucial, which means do not use interval thinking to high sell low buy, but rather follow the trend.
On-chain/funding situation
The fear and greed index is 30, fearful but not extremely fearful; historically, this position often still has downward space. The 24-hour drop of 4.84% belongs to a sharp drop rather than a slow decline; after a sharp drop, there is usually a technical rebound, but the strength of the rebound depends on whether the funding situation stabilizes. The 5.6 billion dollars flowing out of Binance is the core contradiction, with funds fleeing centralized exchanges, and the freezing of 2.3 billion dollars in stablecoins further withdrawing liquidity. Tether's freezing of 1.567 billion USDT involves stolen assets, which in the short term looks to curb capital outflow, but conversely also indicates that the event scale is huge. The stolen funds flowing to Tornado Cash makes recovery challenging, which will continue to suppress market risk appetite. On the macro side, December interest rate hike probability is 79.6%, with PCE at 3.6% exceeding the target; tightening liquidity expectations create systemic pressure on the valuation of crypto assets. The only bright spot is Strategy's third-quarter operating profit of 21 billion dollars hitting a historical high, providing support for institutional position confidence, but under the current panic sentiment, this positive role is limited.
Key offensive and defensive positions
The first pressure level above is around the 1-hour MA5 at 78,129, which is the first barrier for a short-term rebound. The second pressure level is at the 1-hour MA10 of 79,337, and the more important pressure level is at the 1-hour EMA55 of 80,145, the dividing line of the TPV system; if the price does not stand above this position, the bearish trend will not change. For support below, 77,361 is the current price level, and in the short term, look towards the support strength around 15-minute MA5 at 77,334; if it breaks, look towards the previous low area, with the integer point 77,000 as psychological support, and further down the 76,500 to 76,000 range as the next reference area. It must be emphasized that in a one-sided bearish trend, support levels are used to observe stopping signals, not to blindly bottom fish.
Trading thoughts
Direction: Bearish trend continuation; primarily short in the trend, not recommended to counter-trade bottom fishing.
Entry conditions: Wait for the price to pull back to the 1-hour MA5 to MA10 range, i.e., the area of 78,129 to 79,337, and look for resistance patterns such as long upper shadows or top formations, and ensure the 1-hour MACD negative column no longer shortens or the RSI retreats from rebound highs; can enter short positions in batches. If the price directly breaks below 77,334 and the rebound is weak, can also lightly follow through after confirming the effective break.
Stop-loss: The stop-loss for short positions is set above the 1-hour EMA55, i.e., above 80,145, specifically can be placed around 80,300 to allow ample room for error. If the price closes above EMA55 for two consecutive 1-hour candles, the short logic is invalidated, and it must exit.
Target position: First target is the integer point 77,000, second target is 76,500, third target is 76,000. After reaching the first target, reduce the position by half and move the remaining position's stop-loss to protect profits.
Risk reminder: The 1-hour RSI has entered the oversold zone, and the 15-minute RSI is deeply oversold, a short-term technical rebound may occur at any time; ensure to wait for rebound resistance signals before shorting, and do not chase falling prices indiscriminately.
Follow Qinglan Crypto Class to seize more trading opportunities! Welcome to visit our official website www.qinglan.org
📊 Qinglan TPV trading strategy back-testing reference
🕒 Last back-testing time 10-30 07:00:02
Total analysis: 4760 Back-testing: 4751 Accuracy: 76.9% (3655/4751)
免责声明:本文章仅代表作者个人观点,不代表本平台的立场和观点。本文章仅供信息分享,不构成对任何人的任何投资建议。用户与作者之间的任何争议,与本平台无关。如网页中刊载的文章或图片涉及侵权,请提供相关的权利证明和身份证明发送邮件到[email protected],本平台相关工作人员将会进行核查。