Cryptocurrency Expert: The true bottom of Ethereum (ETH) on October 30 is never a point, but a long shadow that makes you question life.
Yesterday I still held onto the order from 2300 going north, and now the market rose to 2372 and came back, a fellow trader asked if I should take profits first. To be honest, I have no such plan. Entering at 2300 was based on the support around the lower Bollinger Band at 2297 and waiting for the four-hour MACD to gold cross. The logic hasn't changed, so why should I run? Now sitting on a floating profit of over 60 points, to be honest, it’s not much, but this is how I’ve walked out my trades step by step at my own pace. I set my stop loss below 2290; if it breaks, I will accept it, if not, I will hold and look at 2377 and then at 2413, leaving the rest to time.
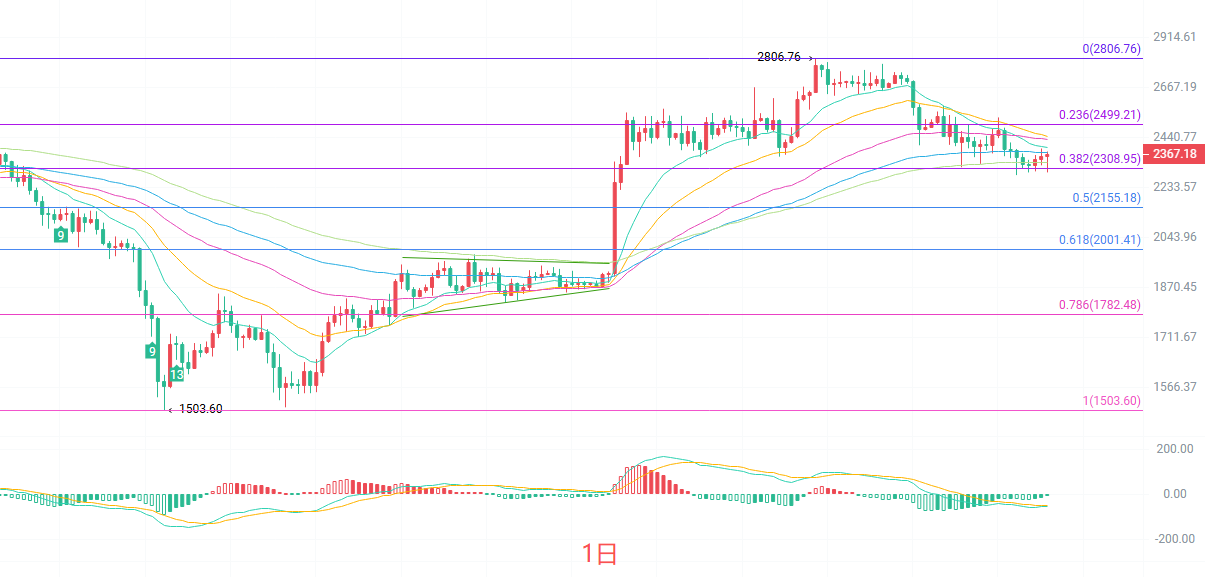
The long lower shadow on the daily candlestick indicates that there is buying support around 2290. Looking at the moving averages: the price of 2364 is above EMA120, but is being pressured by EMA15 at 2397, EMA30 at 2446, EMA60 at 2432, and EMA90 at 2377 which is just holding the current price. The MACD here shows that the bearish momentum has not been completely released, but the green bars are shortening, indicating signs of convergence. The middle Bollinger Band at 2413 is resistance, while the lower band at 2297 is support. Overall, the daily chart is showing a consolidation pattern after a high level pullback; the overall trend hasn't turned bad, but in the short term, it is still testing the bottom.
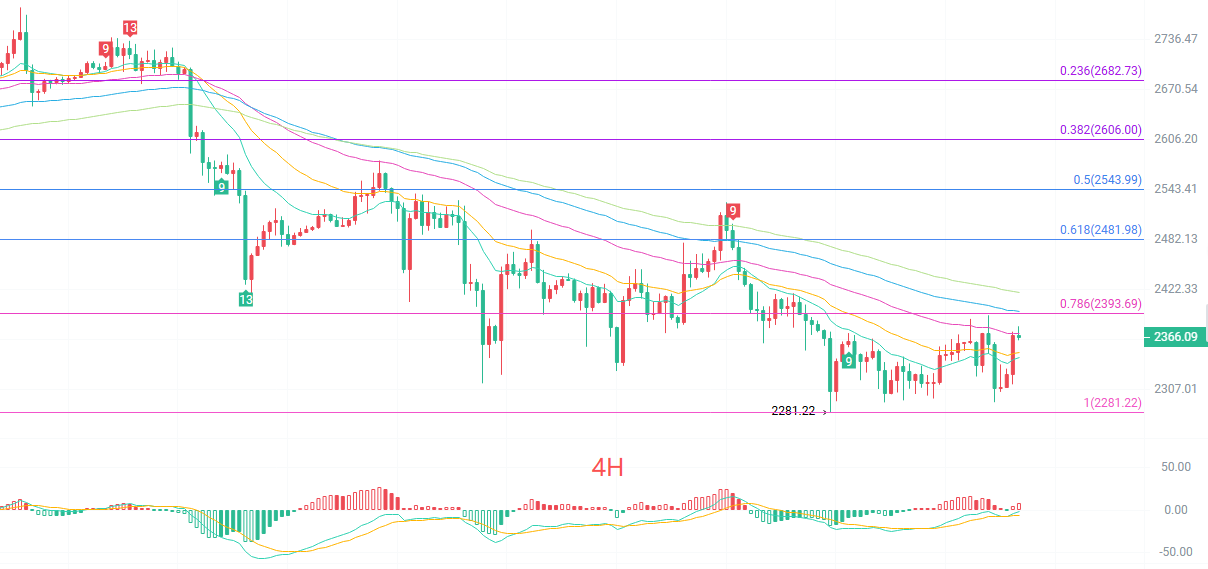
The four-hour candlestick chart is much more positive than the daily. Looking at the arrangement of moving averages: the price has already surpassed EMA15 and EMA30, but EMA60 at 2371, EMA90 at 2397, and EMA120 at 2419 are still pressing down from above. The MACD here shows that the DIF has crossed above, which is a short-term golden cross signal. The middle band at 2336 has been firmly established beneath, and the upper band at 2377 is just the high point for today. After the spike made by the previous low at 2281, the four-hour chart has made a small V-shaped rebound. There is upward momentum in the short term, but the area from 2377 to 2400 is a dense pressure zone, and the probability of breaking through all at once is low; it’s more likely that there will be a spike followed by a pullback and then another rise.
Short-term reference:
Going north from 2340 to 2300 encounters resistance, stop loss 30 points, target looking at 2375 to 2450.
Going south from 2380 to 2420 stagnates, stop loss 30 points, target looking at 2340 to 2300.
Specific operations should be based on real-time market data. For more information, you can contact me. The article is published with a delay; suggestions are for reference only, and risk is borne by yourself.
Friendly Reminder: The above content from the cryptocurrency expert is updated simultaneously on major trading platforms such as Binance, Ouyi, Huobi, etc. For more content, you can add me as a friend on Binance Ouyi and join my fan group.
免责声明:本文章仅代表作者个人观点,不代表本平台的立场和观点。本文章仅供信息分享,不构成对任何人的任何投资建议。用户与作者之间的任何争议,与本平台无关。如网页中刊载的文章或图片涉及侵权,请提供相关的权利证明和身份证明发送邮件到[email protected],本平台相关工作人员将会进行核查。