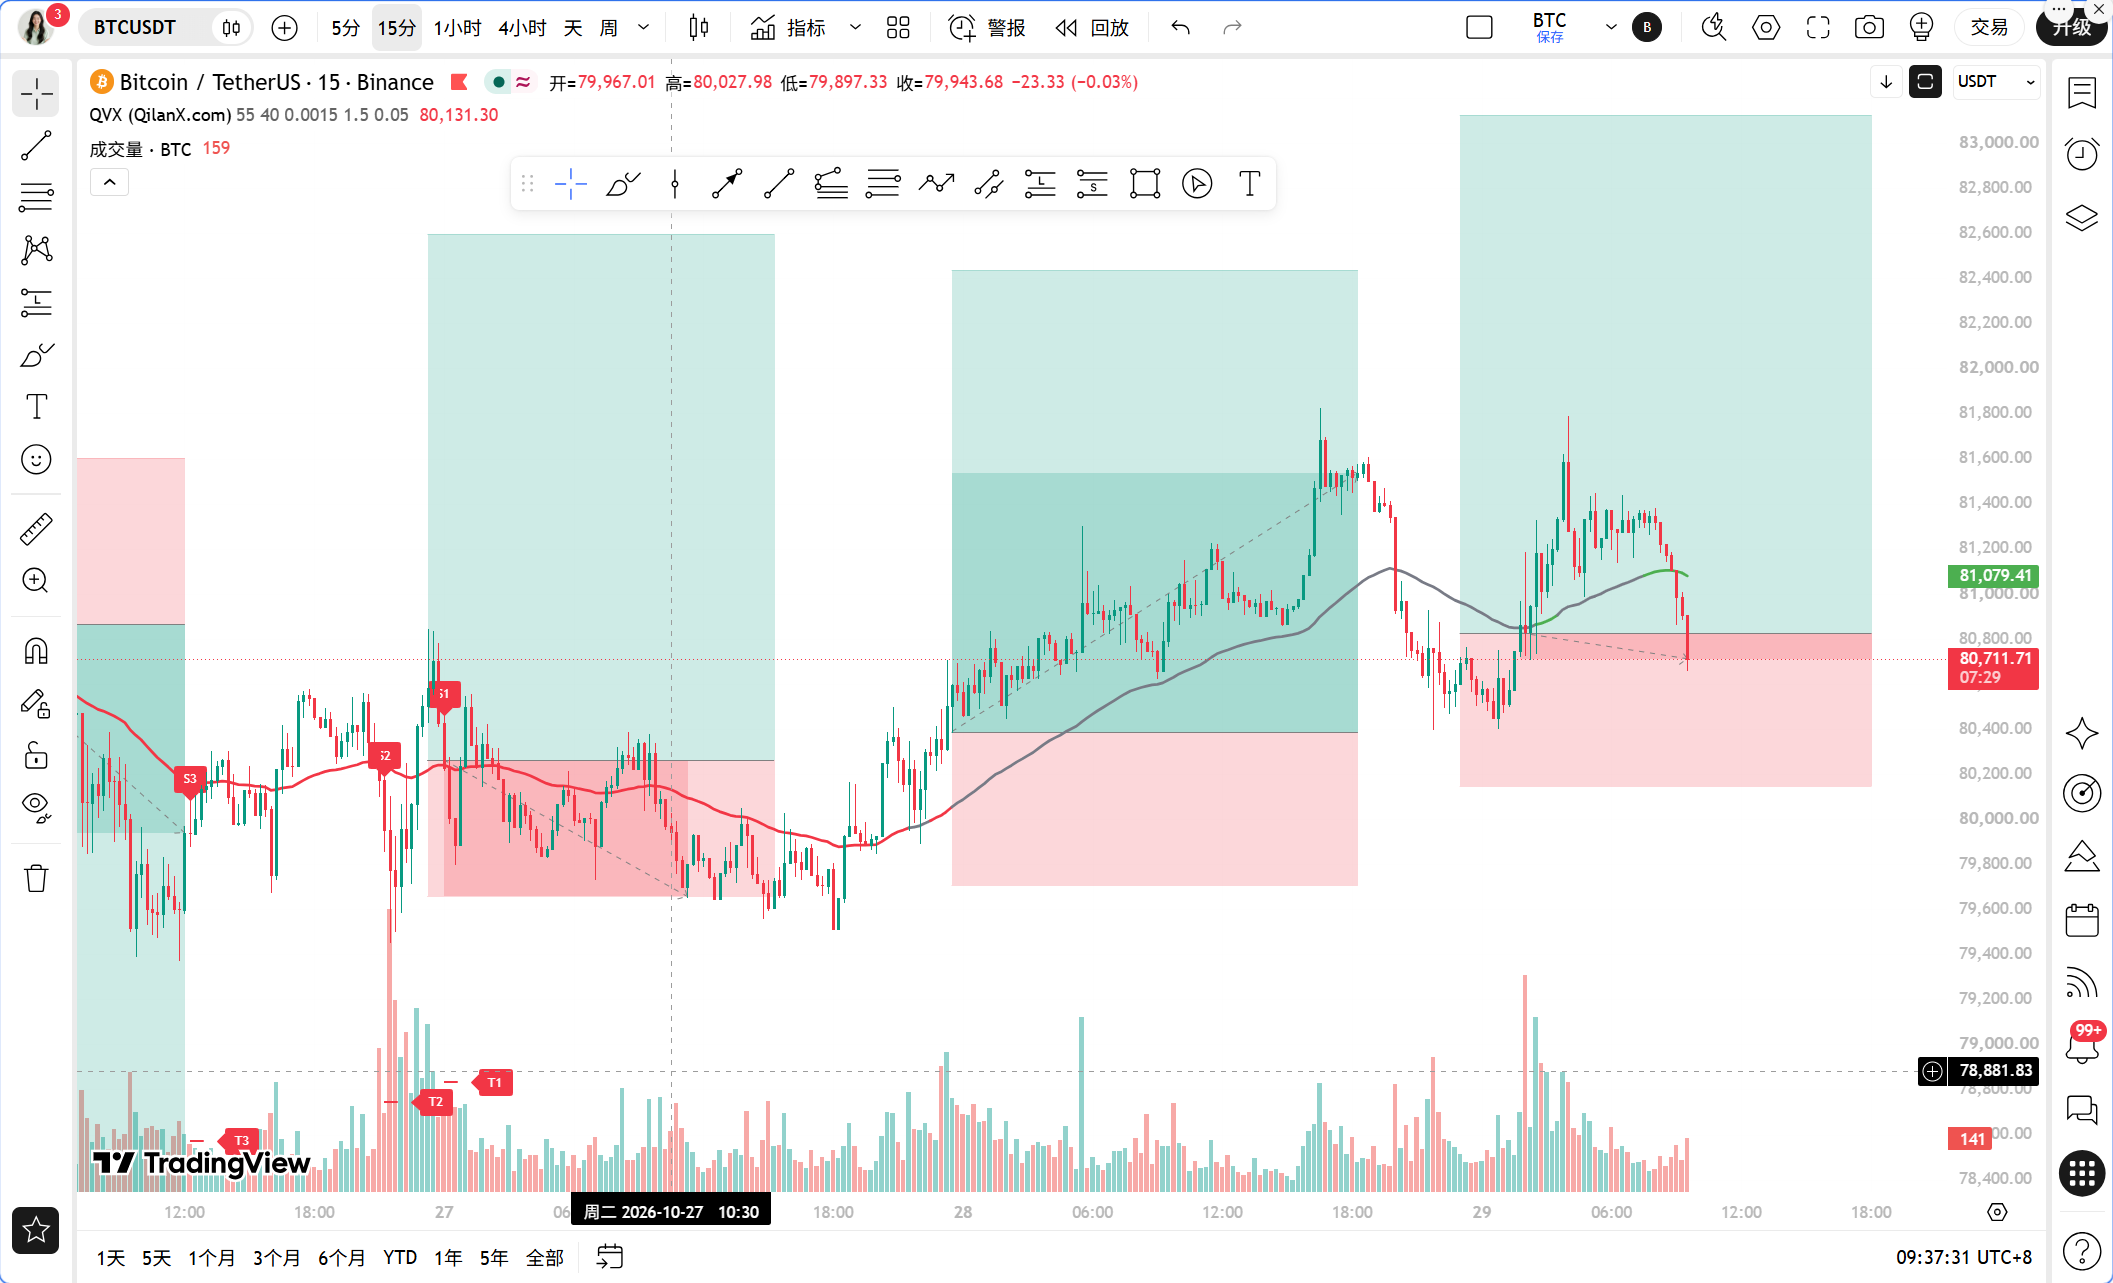
Dear teammates, the news this morning is quite mixed. On one hand, BlackRock's IBIT Bitcoin ETF has made a significant purchase of 3,441 BTC, valued at $276.7 million, indicating a substantial institutional accumulation, which is very positive. On the other hand, Federal Reserve official Walsh has clearly stated that inflation remains too high and the credit environment is tightening, coupled with the Bank of Canada's first interest rate hike in more than three years by 25 basis points, signaling a tightening global liquidity. Moreover, it should be noted that Bitcoin Core has just revealed three new vulnerabilities, allowing for remote attacks that could cause node crashes, which indeed dampens short-term sentiment. The clash between bullish and bearish news has left BTC with no clear direction, fluctuating only 0.12% over the last 24 hours, stuck at around 80,613 USDT. This kind of situation, where news contradicts and prices remain stagnant, is precisely when trading discipline is most tested.
Current Price and Time
It is currently October 29 at 09:39, with BTC priced at 80,613 USDT. The Fear and Greed Index is at 51, neutral. BTC's market share is 59.47%, with no significant signs of capital flowing from Bitcoin into altcoins, indicating that the market is still on the sidelines. The Fed's decision to maintain interest rates unchanged caused a brief uptick in BTC to around 81,000, but the recovery strength was weak, and the price could not hold above 81,000, which itself indicates a stance.
Multi-Timeframe Overview
First, let's look at the daily chart. The daily MA5 is 80,634.22, MA10 is 81,378.63, and MA30 is 82,666.32, showing a bearish alignment with the price struggling near the MA5. The daily MACD has a DIF of -448.57, DEA of -237.26, and histogram of -211.31. The histogram is still expanding in the negative range, which indicates that the downward momentum at the daily level has not yet exhausted. The daily RSI is at 41.48, within a neutral to weak area, with room to move before reaching oversold. The conclusion from the daily chart is clear: the larger trend remains under bearish pressure, and any rebounds are corrective in nature, not reversals.
Next, we examine the 4-hour chart. The 4h MA5 is 81,087.43, MA10 is 80,995.41, and MA30 is 80,537.88. The shorter moving averages are above the longer ones, with the price at 80,613 having fallen below the MA5 and MA10 but still above the MA30. The 4h MACD shows a DIF of 45.37, DEA of -71.87, and histogram of 117.24, indicating that the histogram is positive and expanding, which is the only bullish signal at the 4-hour level. The 4h RSI is at 56.02, neutral to bullish. The 4-hour analysis tells us that there is potential for a rebound in the medium term, but the price has already broken below the short-term moving averages, calling into question the sustainability of that momentum.
The 1-hour chart is the key for today. The 1h MA5 is 81,141.77, MA10 is 81,112.17, and MA30 is 81,026.66, with all three moving averages above the price, creating resistance. The 1h MACD shows a DIF of 89.86, DEA of 130.72, and histogram of -40.86, indicating a death cross, with the histogram turning negative, meaning the upward momentum is fading on the 1-hour timeframe. The 1h RSI is at 37.89, weaker but not yet oversold. Most critically, the 1h EMA55 is at 80,779.85, and the current price of 80,613 is below the EMA55, with a gap of only about 166 USDT.
The 15-minute chart is the most extreme. The 15m MA5 is 80,956.02, MA10 is 81,134.23, and MA30 is 81,208.41, which shows a bearish arrangement of the moving averages. The 15m MACD has a DIF of -46.19, DEA of 35.58, and histogram of -81.77, indicating a death cross and a histogram deeply in negative territory. The 15m RSI is at 15.96, having entered a severely oversold area. The 15-minute signal indicates that the short-term drop has been sharp, and there may be a technical rebound at any time, but a rebound does not equate to a reversal.
TPV Signal Verification
According to Qinglan's TPV system rules, we will verify each point step by step.
For trend positioning: The current price of 80,613 is below the 1-hour EMA55 of 80,779.85, indicating a bearish trend area. This is the premise, confirming that the direction is bearish.
First condition for shorting: The price is under pressure below the 1H EMA55, requiring two consecutive 1-hour candles to close below the EMA55. From auxiliary data, in the past 8 1-hour candles, 7 closed above the EMA55 with only 1 crossing, indicating that the price has spent most of the time above the EMA55 and has only just fallen below. This means that the condition of closing two consecutive candles below EMA55 has not yet been fully confirmed, requiring observation of the closing of the next 1 to 2 1-hour candles. This is the most critical point to observe today.
Second condition for shorting: Resistance encountered. The 1-hour MA5, MA10, and MA30 create a dense resistance zone between 81,026 and 81,141, making that area the point of resistance upon a rebound. The current price is still 400 to 500 USDT away from this resistance zone.
Third condition for shorting: Weakened rebound. The 1h MACD has already exhibited a death cross with the histogram negative, indicating weakened momentum. However, following the strict rules requires that the MACD histogram must contract for two consecutive periods, or the RSI must fall back from above 70, or there must be a bearish engulfing pattern. Currently, the 1h RSI has been falling from a high position, and the 15m RSI has dropped to 15.96, indicating that short-term momentum has exhausted quite sufficiently, but the weakness signal on the 1-hour chart still needs another candle to confirm.
This point regarding oscillating market conditions should be noted particularly. Auxiliary data shows that in the past 8 1-hour candles, there were 7 closures above the EMA55 and only 1 crossing, which does not meet the oscillation threshold, suggesting possible single-directional trend behavior. However, the price is only 0.21% away from EMA55, which is less than 0.3%, indicating that it is fluctuating closely, increasing the probability of oscillation. These two signals are contradictory: one suggesting characteristics of a single-sided trend, the other indicating features of close-line oscillation. Qinglan's judgment is that close-line fluctuations mean a directional choice is imminent, and until a clear direction is confirmed, no active trades should be pursued, waiting for confirmation signals.
In summary, the TPV system currently indicates a bearish trend area, but the three conditions for shorting have not been fully satisfied, remaining in the phase of condition brewing. This is not a moment to enter with heavy positions, but rather a time to patiently await confirmation.
On-chain/Funding
On-chain data indicates a Fear and Greed Index of 51, neutral, with market sentiment lukewarm. BTC's 24-hour price change is 0.12%, almost flat, suggesting neither bulls nor bears are exerting force at this position. BTC's market share remains at 59.47%, which is relatively high, indicating that funds are still clustering in Bitcoin with no obvious spillover of risk appetite.
The most noteworthy aspect of funding is BlackRock's IBIT additional purchases. Acquiring 3,441 BTC, worth $276.7 million, is not a small amount and suggests that institutions are willing to buy at this price level. However, it should be noted that institutional accumulation is a medium-term logic and does not mean that prices won’t continue to decline in the short term. Meanwhile, macro pressure comes from other fronts: Bank of America clients have net sold $18.5 billion in US stocks over the past two weeks, the Bank of Canada has raised interest rates, and the World Bank has warned that commodity prices could spike by 23%, all reinforcing expectations of tightening liquidity. The funding situation features both supportive and restrictive elements, which is also the fundamental reason for the price remaining stagnant.
Key Attack and Defense Levels
The first resistance level above is the 1-hour EMA55 at 80,779.85, which is the dividing line between bulls and bears; if the price cannot surpass this, bears maintain the initiative. The second resistance level above is the dense zone of 1-hour moving averages between 81,026 and 81,141, where any rebound faces strong resistance. The third resistance level above is the 4-hour MA5 at 81,087 and daily MA10 at 81,378; breaking through these levels is necessary for discussing trend repair.
The first support level below is daily MA5 at 80,634, which is where the current price is situated, serving as the last line of defense in the short term. The second support level below is 4-hour MA30 at 80,537; breaking below this level would disrupt the bullish structure at the 4-hour level. The third support level below is the 80,000 integer threshold, serving as a psychological defense line as well as a densely accumulated area from prior positions.
Trading Thoughts
Direction: The current situation is in a bearish trend area, but shorting conditions have not been fully confirmed, focusing on shorting upon rebound rather than chasing shorts.
Entry conditions: Wait for the price to rebound to the vicinity of the 1-hour EMA55, around the 80,780 to 80,850 zone, and observe whether there are long upper shadows or top formations. Additionally, the 1-hour MACD histogram should continue to be negative, and the RSI should rebound and then drop again; enter short when these three conditions resonate. If the price directly breaks below 80,537 and closes two consecutive 1-hour candles below the EMA55, one can wait for a rebound confirmation before entering, avoiding chasing the first bearish candle.
Stop loss: After entering the short position, set the stop loss above 81,150, which is above the upper edge of the dense area of 1-hour moving averages. If this level is broken, it indicates the short position judgment was incorrect, necessitating exit.
Target levels: The first target is 80,537, the second target is the integer level of 80,000, and the third target is around the previous low region near 79,500. Upon reaching the first target, reduce half of the position and move the stop loss to protect profits on the remaining position.
If the price unexpectedly rises strongly above 81,150 and closes two consecutive 1-hour candles above the EMA55, then the conditions for bulls will begin to brew, at which point a reassessment is needed. Short-term bullish opportunities to 81,378 should not be ruled out, but that would be another plan to execute today under the bearish assumption.
Risk Warning
Close-line fluctuations could lead to false breakouts at any time; implement strict stop-loss and avoid holding positions.
Follow Qinglan's Crypto Class for more trading opportunities! Welcome to visit the official website www.qinglan.org
📊 Qinglan TPV Trading Strategy Backtest Reference
🕒 Last Backtest Time 10-29 07:00:02
Total Analysis: 4737 Backtest: 4728 Accuracy: 77% (3642/4728)
免责声明:本文章仅代表作者个人观点,不代表本平台的立场和观点。本文章仅供信息分享,不构成对任何人的任何投资建议。用户与作者之间的任何争议,与本平台无关。如网页中刊载的文章或图片涉及侵权,请提供相关的权利证明和身份证明发送邮件到[email protected],本平台相关工作人员将会进行核查。