Liying Chat Coin: 10.29 Bitcoin (BTC) and Ethereum (ETH) Latest Market Analysis
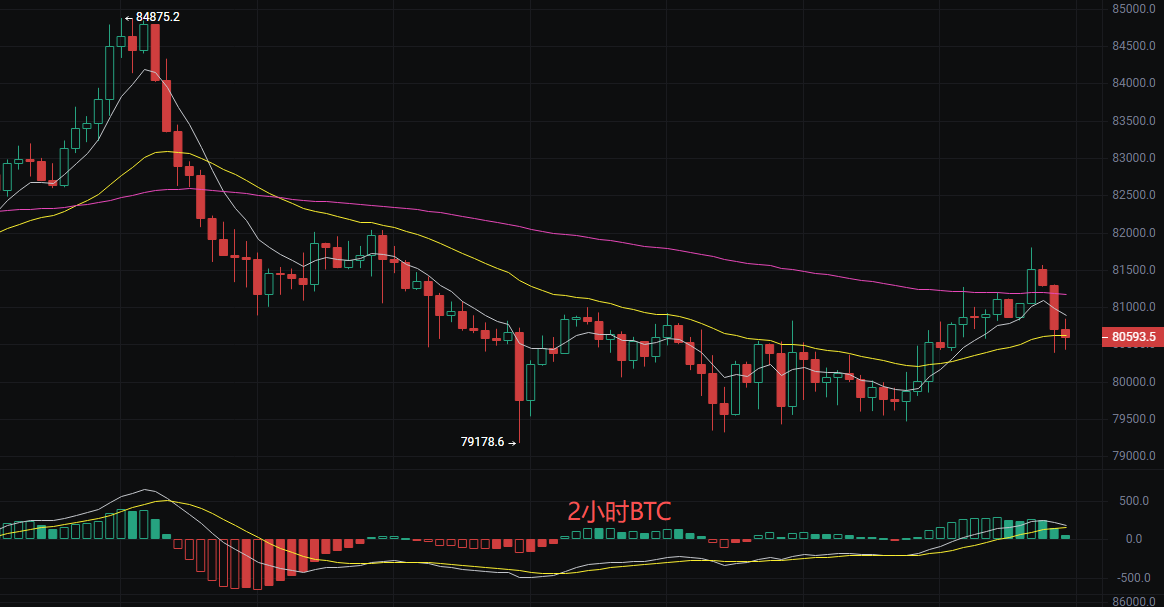
Family! The current price of Bitcoin is 80700, now fluctuating within the range of 80600-81000. To put it bluntly, it’s a tug-of-war between bulls and bears, with neither side getting a significant advantage. In the short term, the price is swaying near the moving averages, unable to rise or fall, as if stuck in the middle. During such times, do not rush in; it’s wise to wait for a clear direction before taking action, otherwise, you could easily end up being hit back and forth. In the EMA moving average system, EMA7 and EMA30 are almost glued together, indicating no trend in the short term; however, EMA120 is pressing from above, which is a mid-term resistance level. The MACD's DIF and DEA are both above the zero axis, with red momentum bars still present, indicating some strength for the bulls, but it’s not strong. The mid-band of the Bollinger Bands at 80542 is support, the upper band at 81618 is resistance, with the price currently situated between the mid and upper bands, falling into a neutral to bullish area, but with limited space.
Operational Suggestions:
Long Position: Place orders in the range of 80400-80500, stop loss at 79700, target at 81500-81600
Short Position: Enter in the resistance area of 81500-81600, stop loss at 82200, target for a pullback to 80500
Reminder: In a fluctuating market, keep positions light, aim for small profits, and do not be greedy.
Ethereum
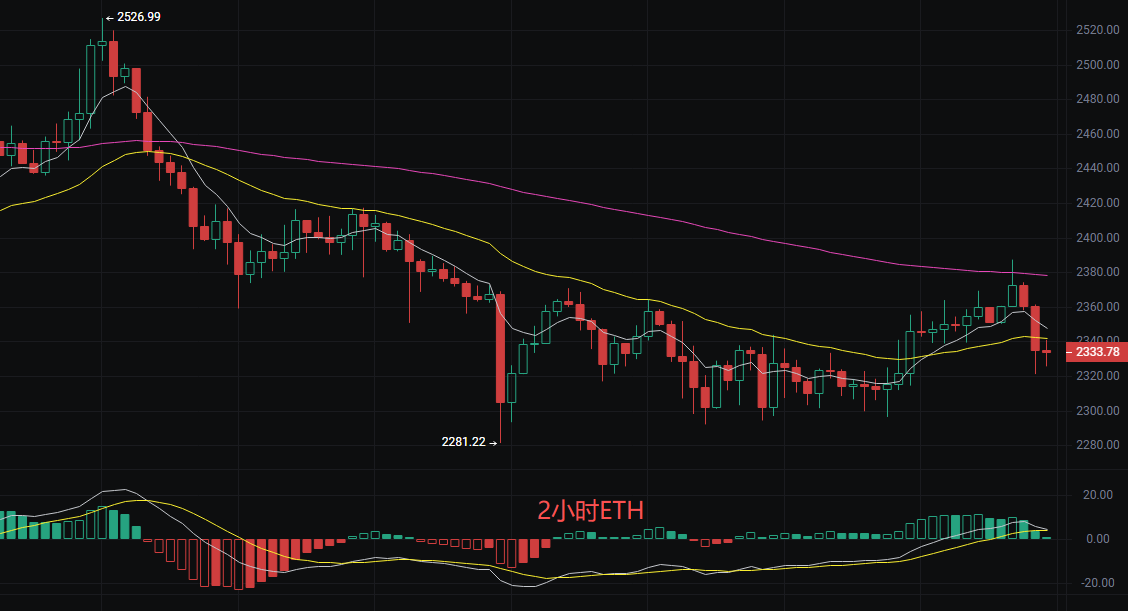
Family, the current price of Ethereum is 2333, just climbed out of the pit at 2281, but hit the ceiling at 2376. The previous drop from 2526 trapped many who chased after peaks, and now with this slight rebound, is it the beginning of a reversal, or a bait in the downtrend? The technical indicators, EMA moving averages EMA7 and EMA20 are still suppressing above the current price, indicating a continued bearish short-term trend, only stabilizing above 2380 can it be said that the bulls are back. The MACD indicators DIF and DEA are almost flat, which means a balance of forces between bulls and bears, about to face a directional choice. The Bollinger Bands are noticeably constricting, with the upper band at 2376 posing direct resistance, and the lower band at 2302 being strong support. The price is around the mid-band of 2339, with volatility compressing, indicating that a change in the trend is imminent. Overall, the technical aspect is in a state of buildup, and a breakthrough confirmation is needed.
It is advised to adopt a range fluctuation strategy, selling high and buying low.
Short Position: Enter at 2370-2380, stop loss at 2395, target at 2340-2320
Long Position: Enter when it pulls back to 2305-2315, stop loss at 2290, target at 2350-2365
Note: There is currently no clear trend, and do not take heavy positions. If it breaks above 2385, consider going long, if it falls below 2295, then reverse to go short, stay flexible.
The above content is exclusively original by Liying, please indicate the source if reprinted! There may be delays in the approval of article publication, the market changes rapidly, the above suggestions are for reference only, risks are borne by the reader.
Friendly Reminder: The above content is only from Liying's official account: Crypto Training Camp, created by the author Liying. The advertisements at the end of the article and in the comment section are unrelated to the author, please discern carefully, thank you for reading.
免责声明:本文章仅代表作者个人观点,不代表本平台的立场和观点。本文章仅供信息分享,不构成对任何人的任何投资建议。用户与作者之间的任何争议,与本平台无关。如网页中刊载的文章或图片涉及侵权,请提供相关的权利证明和身份证明发送邮件到[email protected],本平台相关工作人员将会进行核查。