Today there are two news items worth seeing together. The first is that the crypto industry has invested $176 million in the U.S. midterm elections, which is a substantive action to enhance the industry's political influence. If pro-crypto legislation and regulation advance clearly, this will be a positive for midterm valuations. The second piece of news is that the CFTC is investigating whether Polymarket has violated the 2022 settlement agreement, predicting tightening market regulation and short-term suppression of sentiment in the related sectors. On one side, the industry is using real money to buy political discourse power, while on the other side, regulation continues to tighten around compliance boundaries. This pull between the two makes it difficult for the current market to trend smoothly in one direction, and is more likely to lead to range-bound speculation driven by news. Additionally, the collective surge in U.S. tech and AI sectors has led to a rise in risk appetite, creating an environment for BTC today that favors short-term bullishness with long-term fluctuations.
Current Price and Time
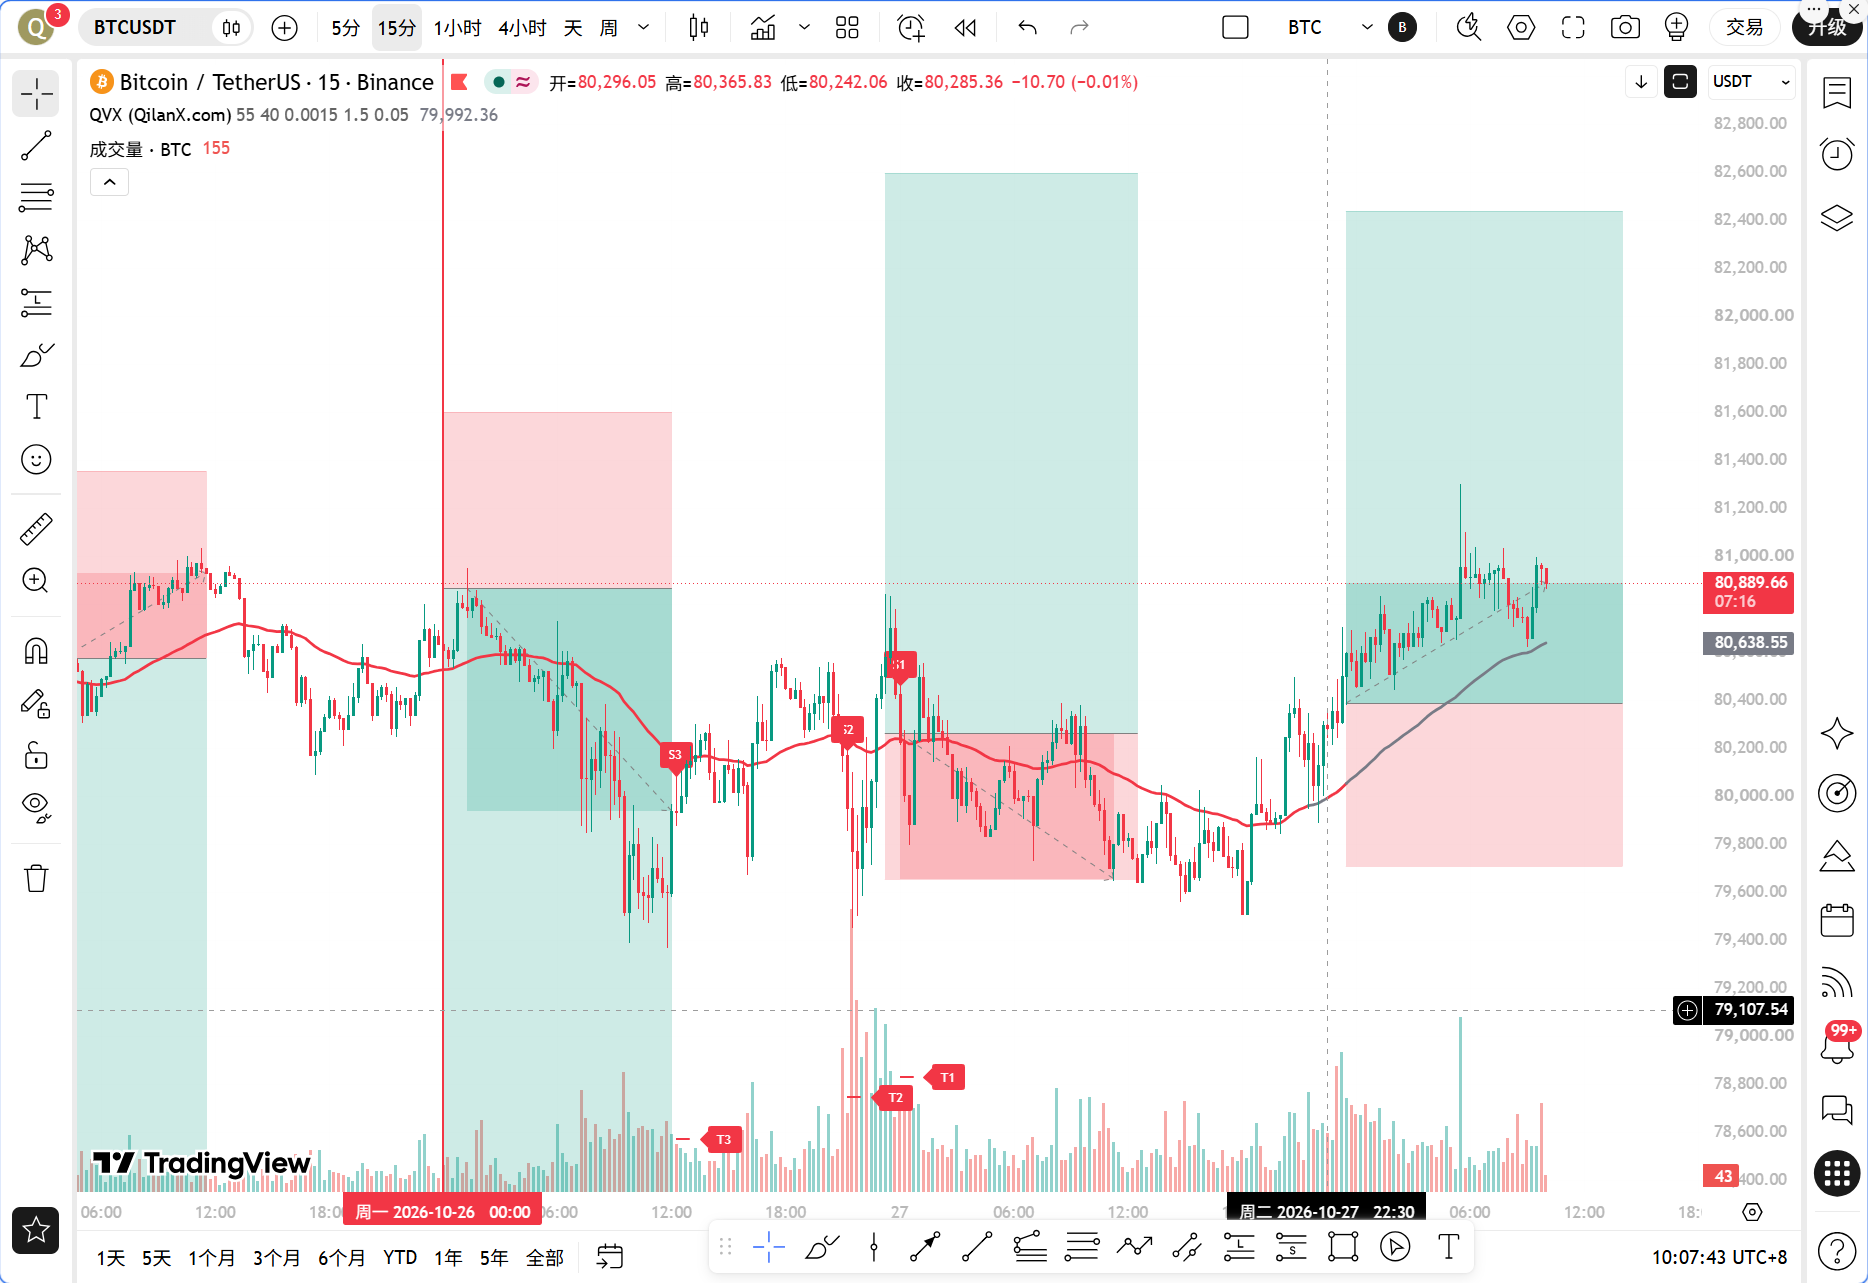
As of October 28 at 10:08, the BTC price is 80879 USDT, with a 24-hour increase of 0.84% and a market share of 59.44%. The fear and greed index is at 51, which is neutral. This position is critical as it is just above the 1-hour EMA55, with the bullish-bearish dividing line right beneath it.
Multi-Timeframe Status Overview
Daily: MA5=80596.30, MA10=81464.70, MA30=82752.52, the price is above MA5 but is being suppressed by MA10 and MA30, with moving averages in a bearish arrangement. MACD's DIF=-451.13, DEA=-193.09, Histogram=-258.04, negative histogram is still expanding, indicating weak daily level momentum, which is currently the biggest hidden danger. RSI=45.54, neutral to weak, not oversold.
4-hour: MA5=80615.74, MA10=80330.33, MA30=80593.27, the price is above all three moving averages, indicating a short-term strengthening structure. MACD's DIF=-168.82, DEA=-326.52, Histogram=157.70, positive histogram continuing, the 4-hour level is in a rebound repair phase. RSI=54.08, neutral slightly bullish.
1-hour: MA5=80878.72, MA10=80805.36, MA30=80299.14, moving averages are in a bullish arrangement. MACD's DIF=218.82, DEA=176.77, Histogram=42.05, positive histogram but with small amplitude. RSI=62.89, slightly strong but not overbought. EMA55=80383.38, the price is about 495 USDT above it, with an amplitude of 0.62%.
15-minute: MA5=80848.66, MA10=80823.42, MA30=80820.17, moving averages are converging. MACD's DIF=48.58, DEA=58.38, Histogram=-9.80, a small negative histogram appears, indicating a short-term need for a pullback. RSI=49.26, neutral.
Summary in One Sentence: The daily is pressing down, the 4-hour and 1-hour are supporting, and the 15-minute is hesitant. The directions of the large cycle and small cycle are inconsistent, determining that this wave of long positions can only be treated on a short-term basis and cannot be taken as a trend position.
TPV Signal Validation
First, let's look at the trend positioning. The current price of 80879 is greater than the 1-hour EMA55 of 80383.38, placing it in a bullish trend area. The oscillation auxiliary data is also very clean: in the past 8 1-hour candlesticks, the closing prices exceeded EMA55 8/8 times, and the number of times it crossed is 0, with a distance of 0.62% from EMA55, exceeding the 0.3% oscillation threshold. According to the TPV system rules, this does not meet the criteria for a oscillation market, but belongs to a one-sided trend environment, allowing for active searches for bullish opportunities.
Verify each condition for going long. The first condition is that the price stabilizes above the 1-hour EMA55, with two consecutive 1-hour closing prices above EMA55, satisfying the 8/8 data directly. The second condition is support stabilizing, with the 1-hour MA30 at 80299.14 and the EMA55 at 80383.38, forming a lower support area. If the price pulls back without breaking, it is viewed as effective support, and the current price is far from this area, indicating a strong stabilization. The third condition is that the downward momentum has diminished, with the 1-hour MACD histogram at a positive 42.05, DIF above DEA, and RSI rising from a low point to 62.89, fulfilling the momentum conditions.
All three conditions are met, and the TPV system gives a buy signal at the 1-hour level. However, it must be clarified that the level of this signal is 1 hour, not daily. The daily MACD negative histogram is still expanding, indicating limited upper space; therefore, going long must be quick in and out, without lingering too long.
On-chain/Funding Situation
The fear and greed index stands at 51, neutral, with the market showing no extreme emotions—there are neither panic sales to pick up nor greedy buys to catch. In the last 24 hours, a total of $134 million was liquidated throughout the network, with both long and short positions liquidated, indicating that leverage is being cleared. In such an environment, chasing highs or lows can easily result in being wiped out. The BTC market share is 59.44%, and funds are still seeking safety in Bitcoin, with no significant flows into altcoins. In terms of news, Strive bought 6182 BTC in one week, showing that publicly traded companies are continuously increasing their holdings, providing a price support base; however, Calacanis predicts BTC may revisit $57,000 within 12 months, and traders are shorting 9700 ETH with 25x leverage, suggesting that some funds are still betting on a downward trend. The funding situation thus shows sufficient support with insufficient upward drive.
Key Attack and Defense Levels
The first resistance above is 81464.70, which is the daily MA10 and also the previous support turned resistance level. The second resistance is around 82500, mentioned in the news about BTC breaking the $82,500 support, which is currently a bearish defense line. The first support below is at 80383.38, the 1-hour EMA55, which is the bullish-bearish dividing line in the TPV system. A closing below this level requires a downward shift. The second support is at 80299.14, the 1-hour MA30, where it forms a support range with the EMA55. Further down is the psychological defense line at the integer level of 80000.
Trading Thoughts
Direction: Short-term bullish, at the 1-hour level, and no overnight holding.
Entry Conditions: Do not chase highs. Wait for the price to pull back to the 80500 to 80600 range. If a 1-hour candlestick shows a long lower shadow or bullish engulfing, and the 15-minute MACD negative histogram shortens, only then enter when both conditions are met. If the price directly breaks above 81464.70 significantly and re-establishes, wait for a pullback confirmation to follow in with a light position, but reduce the position size by half.
Stop Loss: 80300 USDT, placed below the 1-hour EMA55 and MA30 support range. If the closing price drops below 80300, it indicates that the TPV bullish signal has failed, and you should exit without conditions.
Target Prices: The first target is 81464.70, the daily MA10; reduce the position by half upon reaching. The second target is 82500, which is the previous support turned resistance level; take all profits there. If a long upper shadow or top formation appears near 81464.70, do not wait for the second target; exit directly.
Risk Reminder
The daily MACD negative histogram is still expanding; any long position is against the larger cycle operation, with strict stop-loss measures—do not hold on to the position.
Follow Qinglan Crypto Classroom for more trading opportunities! Welcome to visit the official website www.qinglan.org
📊 Qinglan TPV Trading Strategy Backtest Reference
🕒 Last Backtest Time 10-28 07:00:01
Total Analysis: 4714 Backtests: 4706 Accuracy: 77.1% (3629/4706)
免责声明:本文章仅代表作者个人观点,不代表本平台的立场和观点。本文章仅供信息分享,不构成对任何人的任何投资建议。用户与作者之间的任何争议,与本平台无关。如网页中刊载的文章或图片涉及侵权,请提供相关的权利证明和身份证明发送邮件到[email protected],本平台相关工作人员将会进行核查。