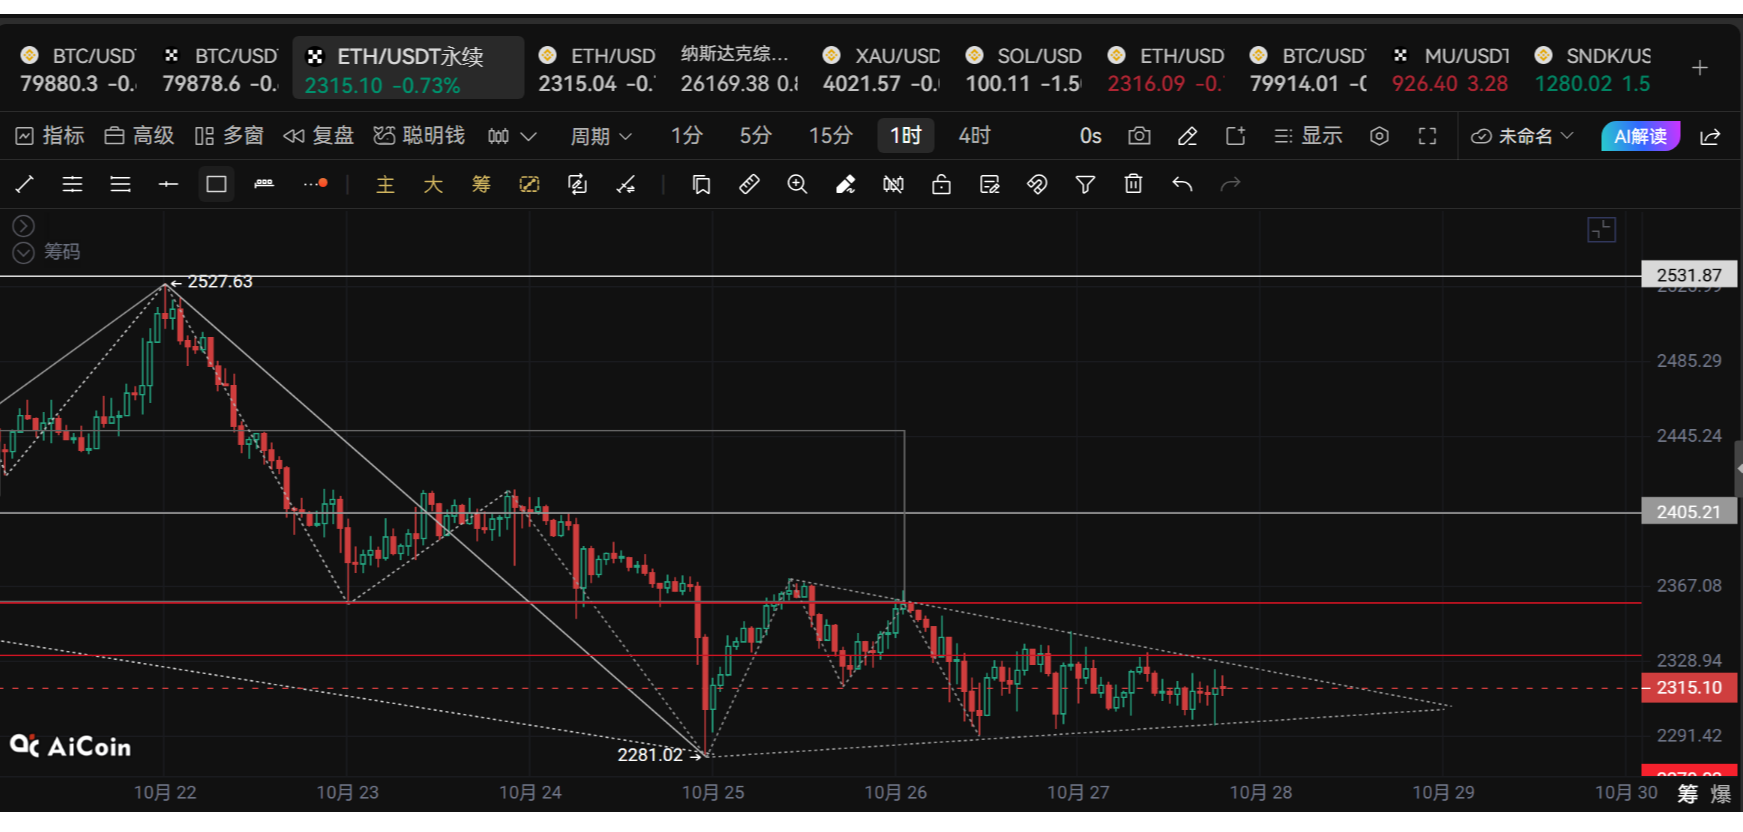
Cryptocurrency Scholar: On October 28, Ethereum (ETH) moving average system is under comprehensive pressure, will this position determine the subsequent direction?
Some say it will drop to 2000, others say it will return to 2800, but none of that is important. What matters is where the key position is and what to do when we get there. My analysis has never been ambiguous; the resistance level, support level, entry point, and stop-loss level are clearly written out, and the correctness is laid bare here. Trading is not about who predicts accurately; it's about who loses less when they're wrong and gains more when they're right. Follow me as we gradually accumulate in this highly volatile market with rationality and discipline.
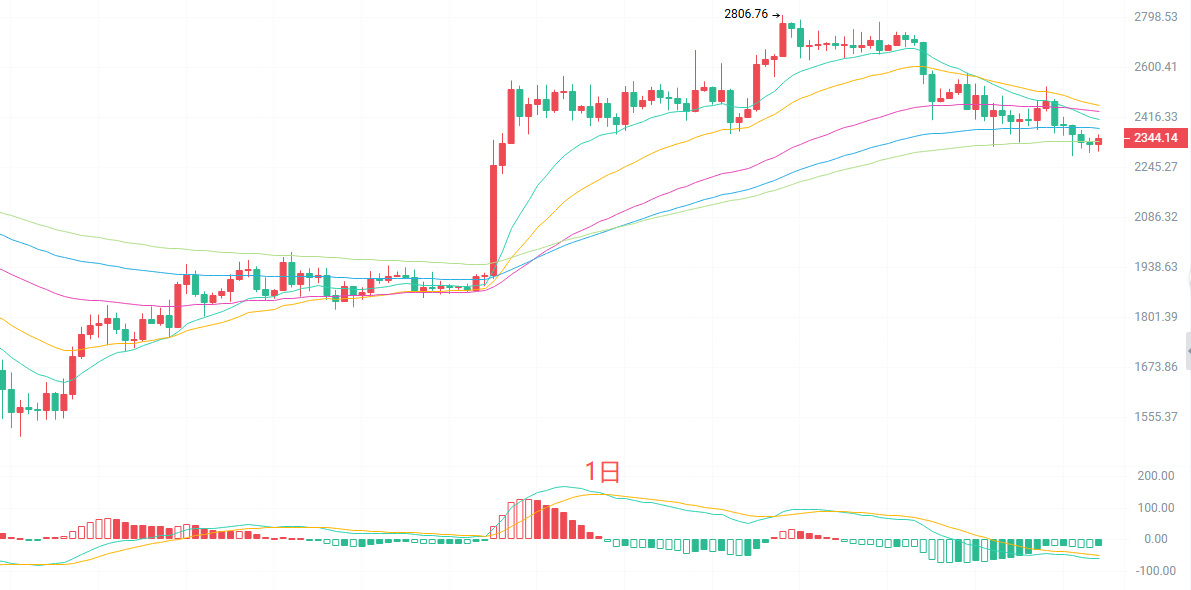
Looking at the daily chart, Ethereum closed around 2350 yesterday, with an intraday volatility of 2.54%. After the high point of 2806, it has been continuously adjusting for almost a month. The price is now just at the EMA120 moving average line at 2333, which is the dividing line for the medium-term bull and bear market. The TD nine-turn selling sequence has reached the sixth bar, indicating that the bearish momentum is still being released, but the MACD green bars are beginning to shrink, and both DIF and DEA are operating below the zero axis, which indicates a typical continuation of the downward trend or bottom building; the next few days are crucial. The lower Bollinger Band at 2309 is strong support, while the middle band at 2425 is the first resistance for a rebound. The overall trend at the daily level is still weak; until it stands back above 2400, we can only see it as a rebound and cannot blindly catch the falling knife.
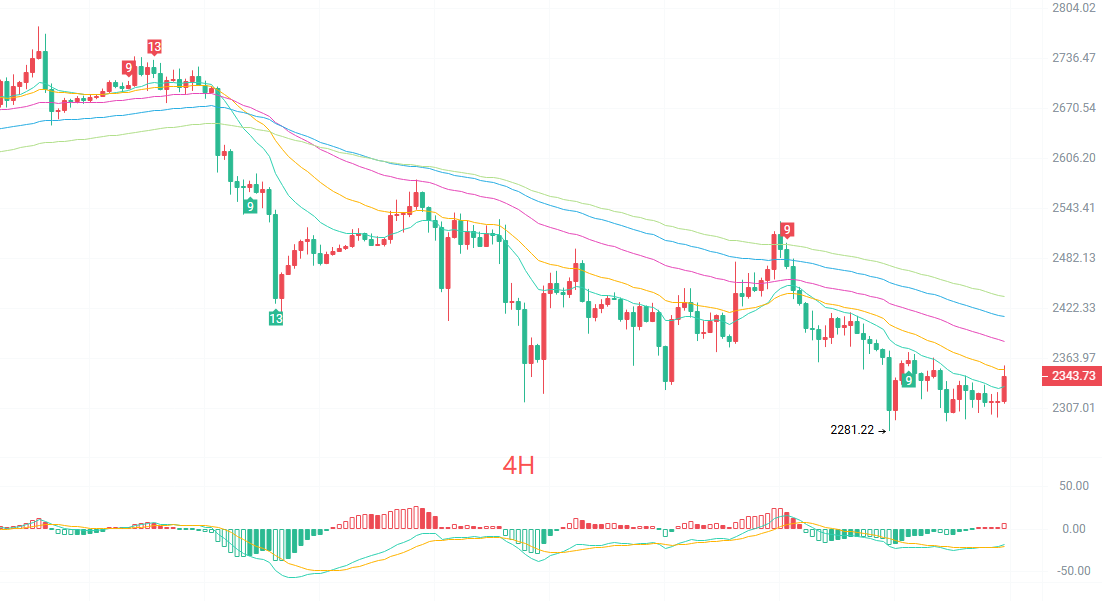
Switching to the four-hour level, the signals are much more positive. The price rebounded from a low of 2281, and just produced the first TD nine-turn buy signal, which is the first hint of a short-term bottoming out. The MACD has formed a golden cross below the zero axis, with the green bar turning red to 6.95, and bullish strength is gradually accumulating. However, be cautious, as the current price of 2350 is just under the EMA30 moving average at 2351.63, and EMA60 at 2384 poses heavy resistance. The Bollinger Band is opening downward, the middle band at 2332 has been breached, and the upper band at 2369 is the short-term target. The four-hour level belongs to the oversold rebound pattern; whether the rebound can continue depends on whether it can effectively break through the 2370 position — it must stand above it to see a higher line towards 2400.
Short-term reference:
Going north from 2330 to 2300, stop loss at 30 points, target at 2370 to 2420
Going south from 2380 to 2420, stop loss at 30 points, target at 2340 to 2300
Specific operations should be based on real-time data from the market. For more information, you can consult the author. There may be delays in article publication, so it is advised for reference only, and risks are borne by the individual.
Warm reminder: The above content is simultaneously updated by Cryptocurrency Scholar on major trading platforms such as Binance, OKEx, Huobi, etc. For more content, you can add me as a friend in Binance OKEx and join my fan group.
免责声明:本文章仅代表作者个人观点,不代表本平台的立场和观点。本文章仅供信息分享,不构成对任何人的任何投资建议。用户与作者之间的任何争议,与本平台无关。如网页中刊载的文章或图片涉及侵权,请提供相关的权利证明和身份证明发送邮件到[email protected],本平台相关工作人员将会进行核查。