Liying Chat Currency: 10.28 Bitcoin (BTC) and Ethereum (ETH) Latest Market Analysis
Families! Bitcoin is currently priced at 80250; this K-line chart shows that it has dropped sharply from a high of 84875. Although it has stabilized slightly now, there is clearly a lack of strength from the bulls. The current market is like a person who is recovering from a serious illness, wanting to run but unable to, wanting to lie down but unwilling. The technical indicators signal a bearish arrangement in the current market. First, looking at the moving average system, it shows a typical bearish arrangement. The MACD indicator is operating below the zero axis, and although the DIF and DEA values are close, it belongs to a weak fluctuation pattern. The price is moving between the middle track at 80020 and the lower track at 79500, with signs of contraction indicating that volatility is decreasing and the market is waiting for directional choices. The current low-volume sideways movement is likely brewing for the next wave of trend change.
Short Position: If it rebounds to 81000-81200, consider shorting, with a stop loss above 81600 and a target of 79500-79200; if it breaks below 79500, the downside opens up.
Long Position Strategy: If the support level of 79000-79200 is not broken during a pullback and a long lower shadow appears, enter a short long position with a stop loss at 78600, betting on a rebound. Note: The current trend has not reversed; long positions are limited to short-term quick entries and exits.
Ethereum
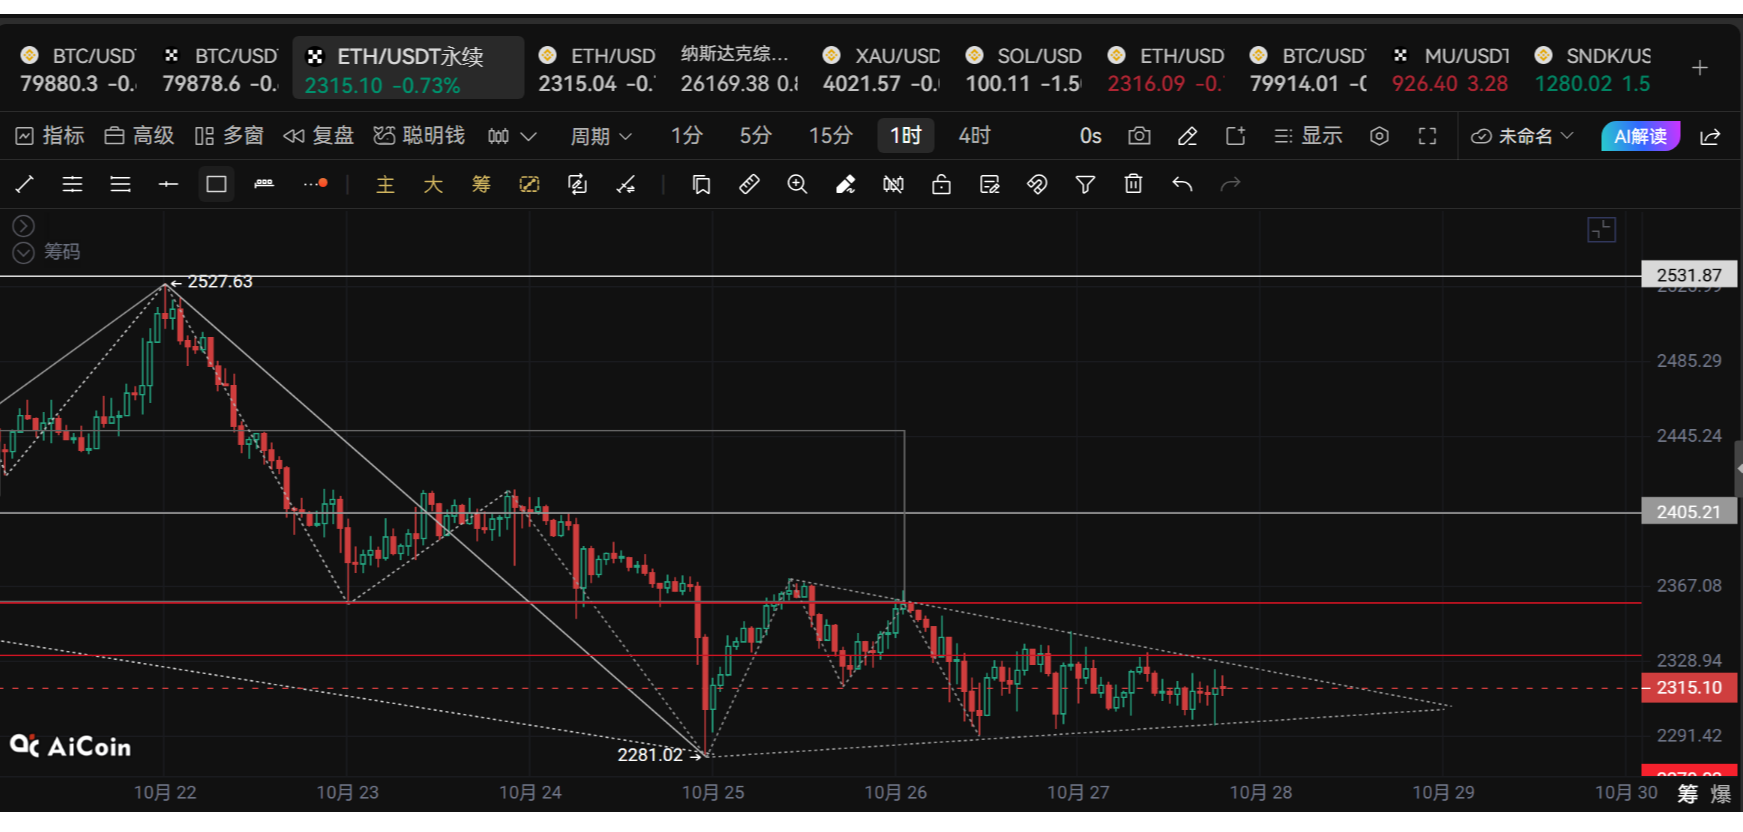
Families, Ethereum is currently priced at 2333, having dropped all the way down from over 2500, and is now hovering around 2333. It looks like it has stopped falling, but there is no strength to rise, a typical sideways market with pressure above and support below. This kind of market tests patience the most, and one cannot be hasty. Many people get scared when they see a drop and chase when they see a rise, resulting in getting hit on both sides. From the technical indicators, the current EMA moving average system shows a bearish arrangement, the MACD is operating below the zero axis, and although the DIF and DEA are close, they have not yet crossed, and the bulls have not yet exerted force. The price is running close to the middle track at 2319, with upper and lower tracks at 2347 and 2300 respectively. Volatility has compressed to a low level, indicating an impending trend change. The current price is near the Bollinger middle track, which is a key node for directional choices and requires waiting for a breakthrough confirmation.
It is recommended to adopt a "breakthrough follow" strategy:
Breakout above 2347 with increased volume, consider light long positions, with a stop loss below 2319.
Break below 2300, take a short position, with a stop loss above 2330.
Avoid frequent trading within the 2319-2347 range to prevent being washed out in a sideways market.
Control position sizes within 5%; add positions after the direction is clear.
In a sideways market, preserving capital is more important than capturing small fluctuations; not losing is making a profit.
The above content is exclusively created by Liying; please indicate the source when reprinting! Article publication review may be delayed, and the market changes rapidly; the above suggestions are for reference only, with risks borne by the user.
Warm reminder: The above content is solely from Liying's official account: Crypto Training Camp, created by the author. Advertisements at the end of the article and in the comment area are unrelated to the author; please be cautious in discernment. Thank you for reading.
免责声明:本文章仅代表作者个人观点,不代表本平台的立场和观点。本文章仅供信息分享,不构成对任何人的任何投资建议。用户与作者之间的任何争议,与本平台无关。如网页中刊载的文章或图片涉及侵权,请提供相关的权利证明和身份证明发送邮件到[email protected],本平台相关工作人员将会进行核查。