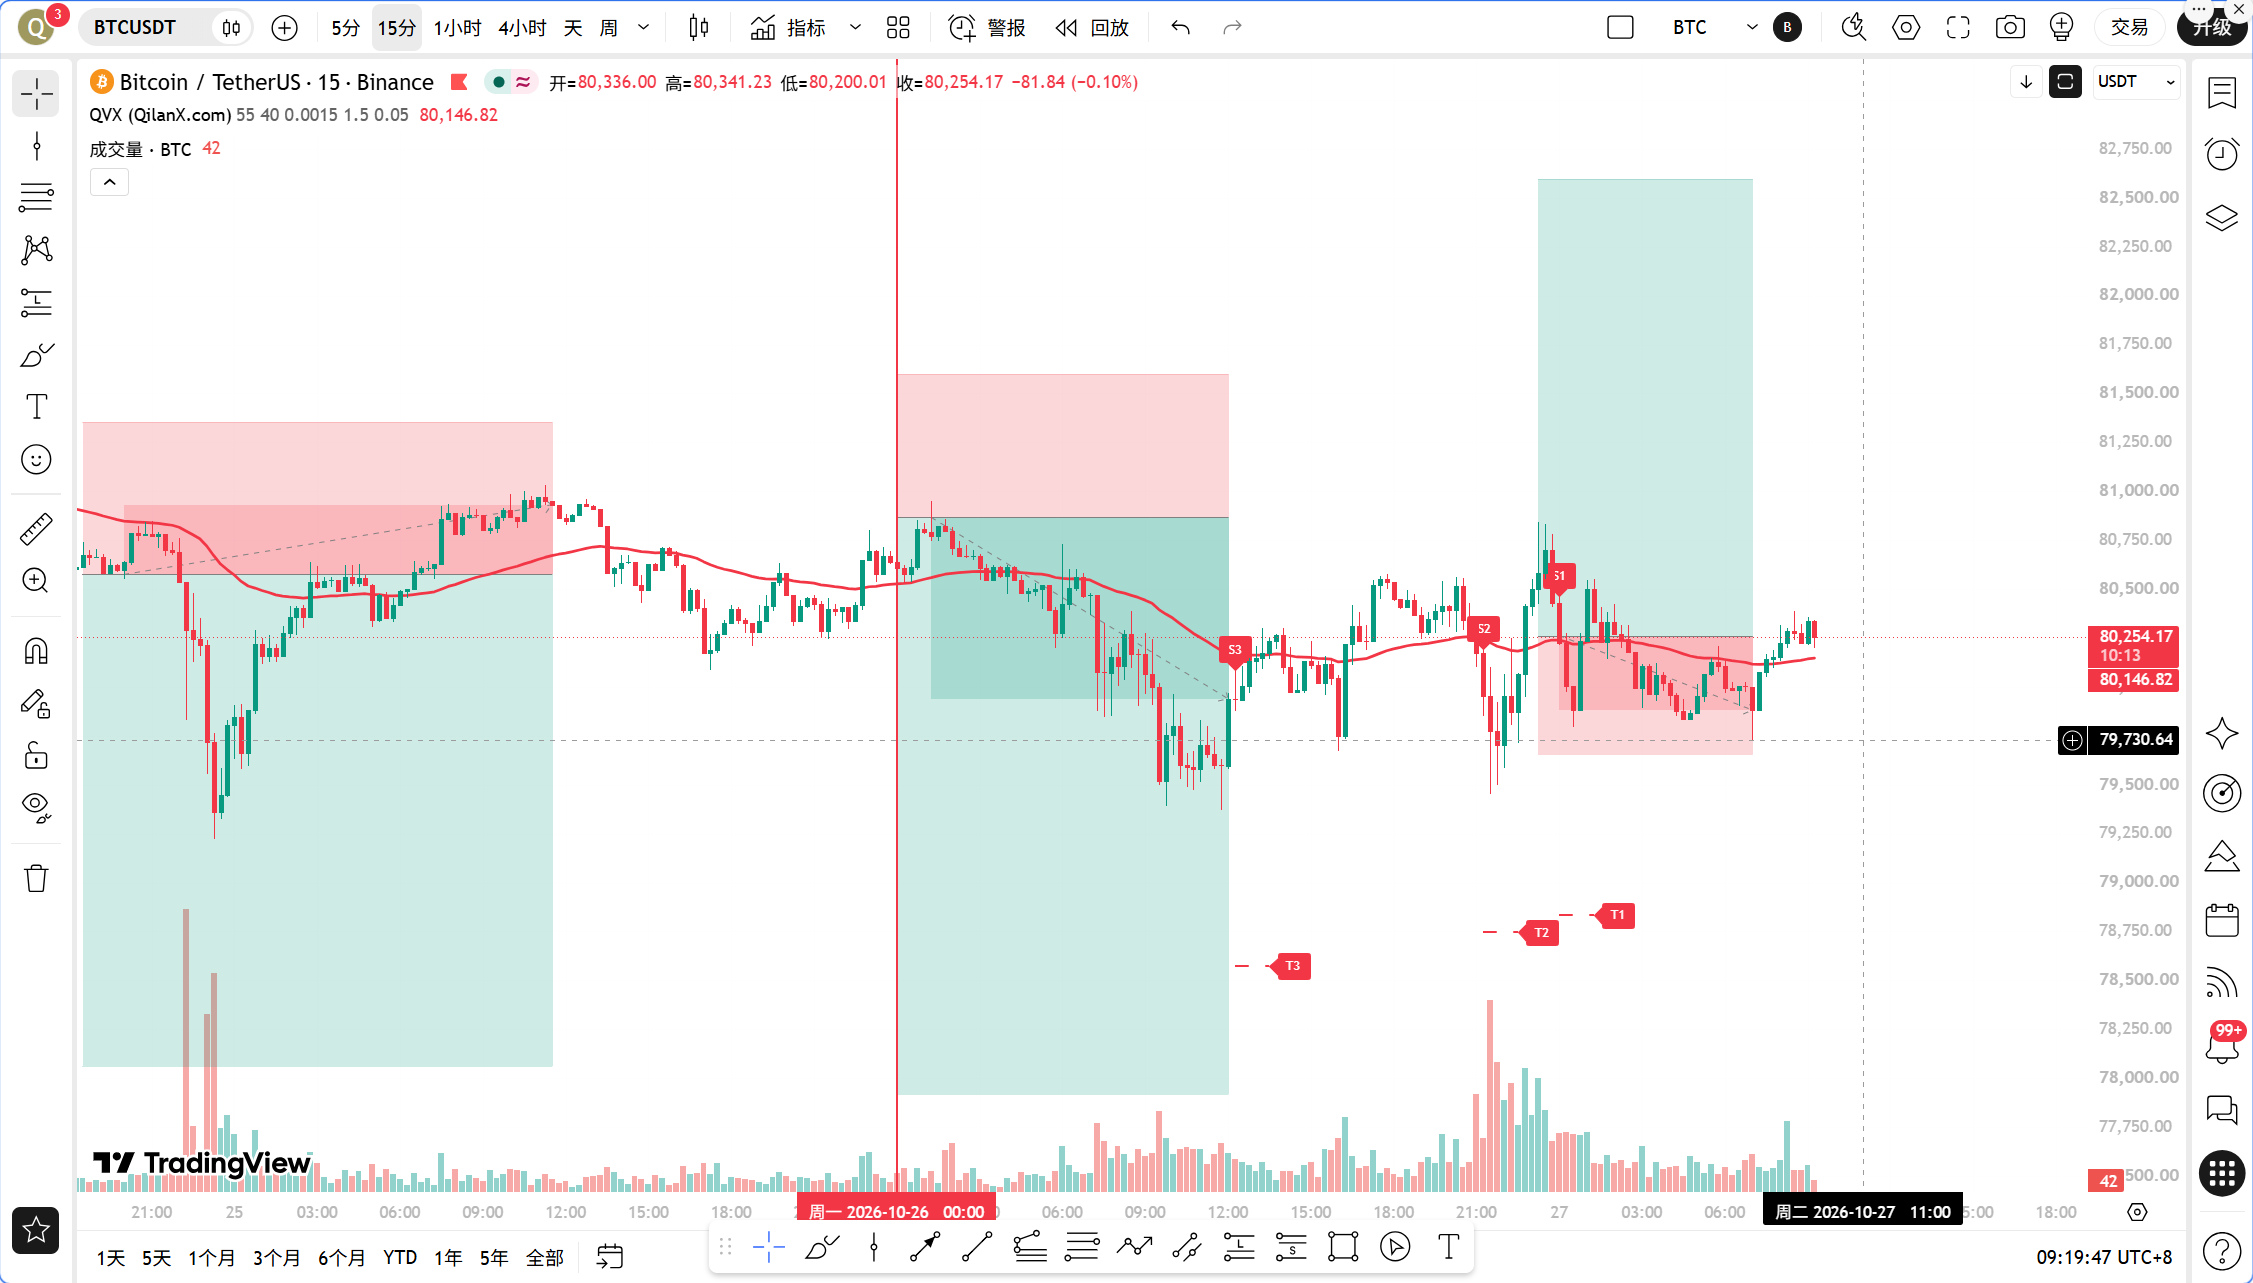
Let's first discuss two news items worth pondering today. The first, Franklin Templeton's Bitcoin dividend reinvestment ETF officially took effect on October 27. The traditional asset management giant has created a BTC exposure product that can return dividends for reinvestment, which signals both an influx of new funds and compliance; this is a substantial medium-term positive signal. The second item reveals that a Bitcoin whale holding $21.89 million has been reported to have shifted from a short position to a long position. Smart money is reversing at this level, which can indeed attract follow-up trading. However, don't be too quick to get excited. At the same time, Coinbase's Bitcoin premium index has been negative for 33 consecutive days, currently at -0.1259%. Institutional purchases in the U.S. continue to be weak, and ETH has again dropped below 2300 USDT, leading mainstream coins lower. Positive and negative signals are colliding at the 80,000 mark, and during such times, it is best to avoid impulsive decisions; we need to let data do the talking.
The current time is October 27, 09:20, and the latest price of BTC is 80232 USDT. The 24-hour price change is only 0.06%, nearly stagnant; the fear and greed index is at 48, indicating neutrality. Market share is at 59.42%, with no obvious signs of funds flowing from BTC to altcoins, suggesting that the market is still in a wait-and-see mode. The 80,000 mark has already been breached once yesterday, and now the price is hovering just below this level, with both bulls and bears testing the waters.
A look at the multi-timeframe status shows a clear framework. In the daily time frame, MA5=80522.85, MA10=81520.63, MA30=82817.30; the moving averages are in a bearish arrangement with prices below the three averages. MACD shows DIF=-493.56, DEA=-142.52, and the histogram at -351.04, with green histogram bars continuing to expand and no golden cross in sight; RSI is at 35.00, approaching oversold but not extreme. The overall daily structure is clearly bearish, but the RSI at 35 indicates that the downward momentum has been largely released, reducing the cost-effectiveness of chasing the short position. In the 4-hour timeframe, MA5=80249.25, MA10=80224.87, MA30=80859.87, with short-term moving averages starting to flatten and the price tangled near MA5 and MA10. MACD shows DIF=-411.09, DEA=-446.84, and a histogram at 35.75, indicating that momentum is recovering; RSI=46.04 is back to neutral. The 4-hour frame shows a sideways recovery at a low position, indicating a pause in the downtrend. In the 1-hour timeframe, MA5=80142.69, MA10=80116.07, MA30=80155.34, with all three moving averages squeezed between 80100 and 80160, and the price at 80232 is above the averages; MACD shows DIF=-49.84, DEA=-67.22, and a histogram at 17.38, continuing the red bars; RSI=46.74. The 1-hour frame is a typical tight oscillation structure. In the 15-minute timeframe, MA5=80270.36, MA10=80182.82, MA30=80081.38 aligns bullishly. MACD red histogram at 32.97, RSI=56.76 indicates short-term strength. Viewing all four cycles together: daily bearish, 4-hour recovery, 1-hour oscillation, and 15-minute bullish bias; this forms a rebound recovery structure within a downward trend, not a trend reversal.
Validation of the TPV signal is the core of today. First, let's look at the bull-bear boundary, where the 1-hour EMA55 is at 80361.62. The current price of 80232 is below EMA55, off by 129.62 USDT, an absolute deviation of 0.16%. According to the TPV system rules, with the current price less than 1-hour EMA55, we are in a bearish trend area; the first condition for going long is not met. Now let’s look at the three conditions for shorting: First, the price is under pressure below 1-hour EMA55, requiring two consecutive 1-hour candle close prices to be below EMA55; the last eight 1-hour closing prices above EMA55 count as 0/8, with zero crossings. This means the price has consistently pressed below EMA55 for the last eight candles, which completely satisfies this condition. The second condition regards resistance formation; the price has repeatedly retraced to the 80300 to 80400 zone but has not stabilized there, representing a drop after touching an effective high point, thus meeting the requirement. The third condition indicates feeble rebounds: while the 1-hour MACD red bars are still present, both DIF and DEA are well below the zero axis; RSI has risen from a low point to 46.74 but the upward slope is slowing, showing that rebound momentum is indeed weak. Out of the three conditions, two and a half are satisfied, but there is a crucial contradiction to highlight: the oscillation support data indicates that the current price is just 0.16% away from EMA55, which is beneath the 0.3% tight threshold, suggesting an increased probability of tight oscillation. Simultaneously, over the past eight closing prices, there were zero occasions above EMA55, failing to meet the oscillation definition of 3 to 5 occurrences. Thus, the system determines that it may be in a one-sided trend but also adds a warning of tight oscillation. To put it simply: the bias leans bearish, but the price is too close to the boundary line; it can be pulled back above EMA55 by a single bullish candle at any moment. Thus, chasing shorts now offers a poor risk-reward ratio. The Qinglan Cryptocurrency Classroom has always emphasized that the greatest value of the TPV system is not to tell you the direction but to tell you when not to take action. Today is a classic instance where the signals are murky and where patience is required.
Let's add some insights on the on-chain funding. The fear and greed index is at 48, neutral; there is neither panic selling nor greed, making this emotional environment conducive to grinding. Coinbase's premiums have been negative for 33 consecutive days, which is direct evidence of weak spot purchasing in the U.S., suppressing the rebound height. Binance's stablecoin reserves have risen to 75%, suggesting there is potential buying power, but the total amount of stablecoins and net inflow have not increased in sync; just having money in accounts doesn’t guarantee buying. ETH has dropped below 2300, falling 2.97% over 24 hours and leading the mainstream coins’ declines, as risk appetite decreases; BTC finds it hard to stand alone. Large holders transitioning from short to long positions is emotionally positive, but the movements of a single address cannot change the macro landscape of weak institutional buying. Overall, funding appears more neutral to bearish; the positives are more emotional while the negatives are based on actual buying data.
Key levels of attack and defense: the first resistance above is 80361.62, which is 1-hour EMA55, the boundary line of the TPV system; if the price cannot surpass it, the bearish structure remains intact. The second resistance is at 80859.87, which is the 4-hour MA30 and also the previous rebound high point region. Below, the first support is at the round number of 80000, which has already been tested once; the second support is in the region of 79700 to 79800, which is a dense area of previous lows in the 4-hour timeframe. The price of 80232 is effectively stuck between 80000 and 80361.62, with limited space above and below, creating a classic pre-turnaround structure. The news mentions that Bitcoin's seven-segment adjustments are nearing their end, and the day-line inflection point window is approaching. Technically, the 4-hour MACD has turned positive and the daily RSI is at 35, indicating a genuine need for repair, but confirming the inflection point requires the price to surpass 1-hour EMA55 and have two consecutive 1-hour close prices above it; until then, it can only be considered a rebound.
Trading thoughts are clear: the current TPV system indicates a bearish trend area, with the main approach being to short on rebounds. However, due to the tight oscillation warning, it is advised not to chase shorts or rush; wait for signals. Short entry conditions: price rebounds to the 80300 to 80400 area, which is near 1-hour EMA55; it requires a long upper shadow or top formation, and the 1-hour MACD red histogram starts to shorten. These three conditions must be fully satisfied before entering, with an entry reference at 80350 to 80400. The stop-loss should be placed above 80860, which is above the 4-hour MA30, allowing sufficient corrective space, with a stop-loss range of about 500 to 510 USDT. The first target is 79700, and the second target is 79200. For going long, the price must have two consecutive 1-hour close prices above 80361.62 and retrace without breaking EMA55 before it can be considered for a light long position; entry reference is at 80400 to 80500, with a stop-loss below 79900 and a target of 81000 to 81200. Choose one of the two directions, take the first signal when it arrives; if neither meets conditions, remain in cash. The Qinglan Cryptocurrency Classroom's discipline is: better to miss out than to make a mistake; tight line positions are easily subject to double-sided liquidations.
Risk warning in one sentence: close to EMA55 with oscillation warning active, any direction’s false breakout may trigger rapid liquidations; strictly follow signals and control position size.
Follow the Qinglan Cryptocurrency Classroom for more trading opportunities! Welcome to visit the official website www.qinglan.org
📊 Qinglan TPV trading strategy backtest reference
🕒 Last backtest time 10-27 07:00:02
Total analysis: 4691 Backtest: 4683 Accuracy: 77.2% (3616/4683)
免责声明:本文章仅代表作者个人观点,不代表本平台的立场和观点。本文章仅供信息分享,不构成对任何人的任何投资建议。用户与作者之间的任何争议,与本平台无关。如网页中刊载的文章或图片涉及侵权,请提供相关的权利证明和身份证明发送邮件到[email protected],本平台相关工作人员将会进行核查。