This week, the US stock market will迎来 a series of high-density earnings report catalysts.
Tuesday night features Coca-Cola and Boeing, Wednesday morning has Visa and Robinhood, Thursday morning brings Google and Microsoft, Friday morning showcases Amazon and Intel, and Friday night sees ExxonMobil and Chevron taking their turn.
This means that sectors such as consumption, aviation, payment, brokerage, search, cloud computing, e-commerce, chips, and energy will be continuously tested with earnings reports and management guidance over the next few days.
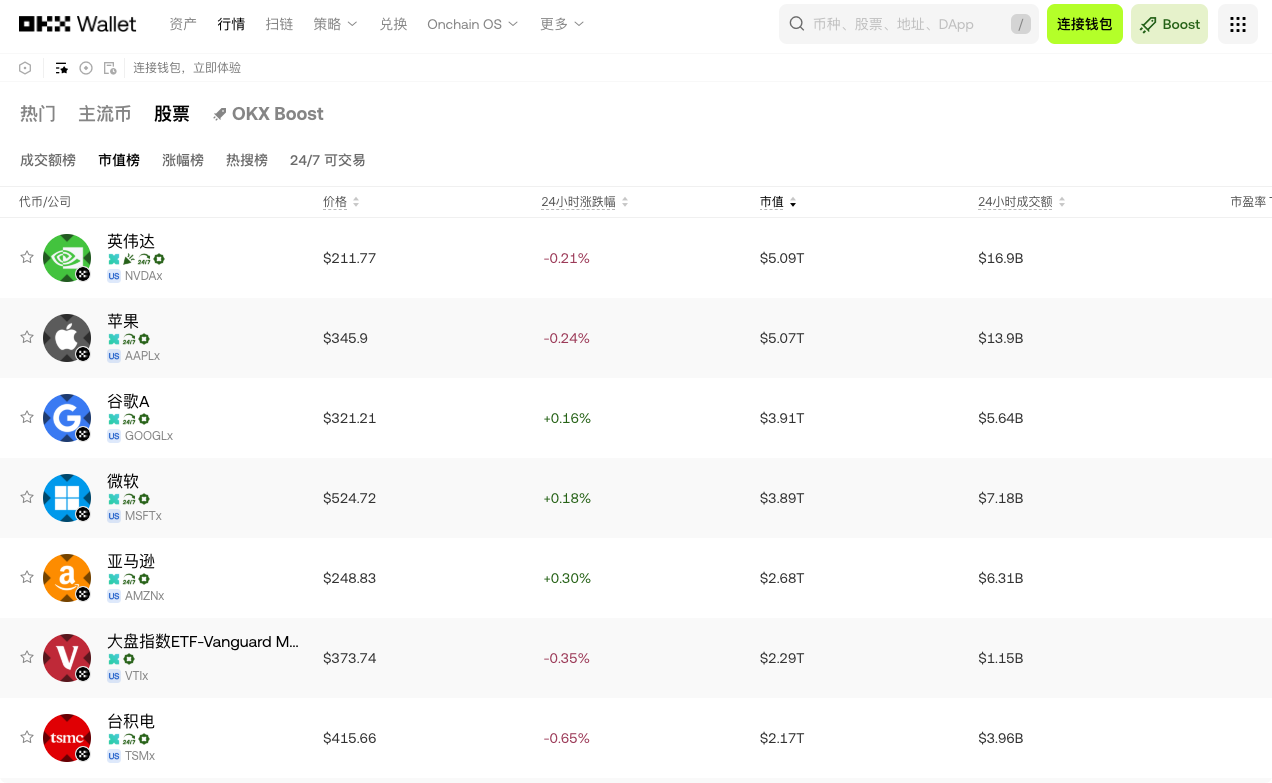
For investors, the focus this week is not on guessing which company will definitely rise, but rather on establishing an observation map of "earnings report—industry—asset prices" in advance. Through the US stock market page of the OKX Wallet, users can continuously check the prices, fluctuations, market capitalization, and 24-hour trading volume of relevant tokenized US stocks and pay attention to market changes outside regular US trading hours.
According to the user's provided watchlist, combined with the public earnings report calendar, the main time sequence is as follows:
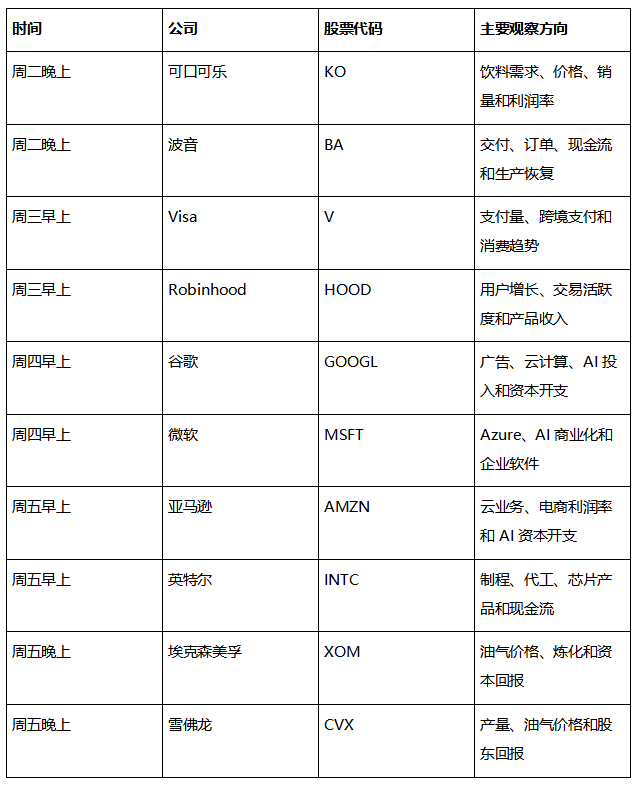
Coca-Cola's official announcement confirms that the company will release its third quarter 2026 earnings report before the opening of the New York Stock Exchange on October 27 and will hold a conference call at 8:30 AM Eastern Time. The public earnings report calendar shows that Boeing will also release its results on the same day; Visa and Robinhood are scheduled for after US market close, which typically corresponds to the next morning in Beijing time.
Alphabet and Microsoft will release after the Wednesday US market close, Amazon will report after Thursday's close, and ExxonMobil and Chevron will report before the US market opens on Friday.
Reporting times may be adjusted due to company arrangements, daylight saving time, and market calendar changes, and should be confirmed against the company’s investor relations page and announcements before formal trading.
Why does earnings report week often lead to significant volatility?
Earnings reports are not merely about disclosing how much money was earned in the past three months. What the market truly trades are typically three levels of information:
First level: Actual performance exceeding expectations
Revenue, profit, earnings per share, and cash flow are the basic data, but the stock price response depends on the gap between the results and market expectations. A company's profit growth does not necessarily mean that the stock price will rise; if the growth has already been factored in by the market, the performance may lead to "realization of good news" after the announcement.
Second level: How management describes the future
Guidance, orders, capital expenditure, customer demand, and cost pressures often have a greater impact on valuation than static data from the previous quarter. Especially for technology companies, AI investments and data center construction can influence future growth and also affect short-term free cash flow.
Third level: Whether the earnings report changes the industry narrative
Microsoft and Google's cloud computing and AI capital expenditures may impact the entire technology sector; Visa's payment data may reflect trends in consumption and cross-border transactions; ExxonMobil and Chevron's performance may be affected by oil prices and energy demand.
Therefore, during earnings report week, it is necessary to observe the company, industry, and index simultaneously, rather than just focusing on a single stock.
Consumption and Aviation: The Two Economic Signals from Coca-Cola and Boeing
Coca-Cola: Consumer Demand and Pricing Power
Coca-Cola's earnings report focuses on sales volume, pricing, regional revenue, currency impact, and profit margin. The company’s products reach over 200 countries and regions, and the earnings report can help the market observe global beverage consumption, brand pricing power, and cost changes.3
If sales growth primarily stems from price increases, the market may further concern whether consumers can continue to bear higher prices; if both sales and revenue grow simultaneously, it indicates that demand and brand management are more resilient.
Boeing: Deliveries, Orders, and Cash Flow
Boeing's earnings report focuses on entirely different aspects from Coca-Cola. The market will pay close attention to aircraft deliveries, order backlog, production recovery, quality management, supply chain, and free cash flow.
The performance of aerospace manufacturers may be affected by individual projects, regulatory requirements, and production rhythms, with single-quarter figures likely experiencing significant volatility. When monitoring the BA mapped assets, users should analyze the earnings data in conjunction with delivery targets, order structure, and cash flow.
Payments and Trading Platforms: Visa and Robinhood Reflect Market Activity
Visa: Payment Volume and Cross-Border Business
Visa's key metrics include payment transaction volume, payment amounts, cross-border transactions, data processing revenue, and consumer spending. The advantage of the payment network lies in its ability to observe consumption trends from a wide range of transactions.
If cross-border payments and consumer transactions continue to grow, it may support market expectations for Visa's revenue; if consumer spending slows or cross-border activity weakens, the market will reassess the growth rate.
Robinhood: Trading Activity and Product Expansion
Robinhood's revenue is related to user trading behavior, interest income, cryptocurrency trading, and new product developments. Its earnings report not only reflects the company's own operations but also indicates the risk appetite and trading activity levels of retail investors in the market.
Increased trading volume for Robinhood may bring higher revenue, but trading activity will also fluctuate with market volatility and hot topics. Users should focus on active accounts, asset sizes, revenue per user, and income structures, rather than just looking at quarterly trading volume.
Core Technology: Google, Microsoft, Amazon, and Intel
This week, the four technology companies are likely to attract significant market attention.
Google: Advertising Cash Cow and AI Search Competition
Key observation points for Alphabet include search advertising, YouTube, Google Cloud, and the commercialization of AI products. The market will focus on whether AI is changing search traffic, advertising conversion, and user habits, and will also pay attention to whether cloud business growth can cover AI infrastructure investment.
Microsoft: Azure and AI Commercialization
Microsoft's core focuses on Azure growth, Copilot paid users, enterprise software demand, and data center capital expenditures. The larger the AI investment, the more the market needs to see orders, subscription income, and profit conversion.
Amazon: E-commerce Profit Margin and AWS
Amazon's earnings report needs to be viewed in segments: the e-commerce business focuses on revenue and profit margins, while AWS focuses on cloud computing growth rates, AI demand, and capital expenditures. Amazon's competitive advantages come not only from online retail but also from a combination of logistics, cloud, and advertising businesses.
Intel: Manufacturing Transformation and Cash Flow Pressure
Intel's emphasis includes process advancement, foundry business, data center products, PC market, and capital expenditures. The manufacturing transformation requires long-term investment, and the market will pay attention to both technological progress and cash flow sustainability.
Energy Sector: ExxonMobil and Chevron
ExxonMobil and Chevron's earnings reports will be released before the US market opens on Friday. The profits of energy companies are sensitive to oil, natural gas, refining profits, and production levels.
Users can observe:
- The impact of oil and gas prices on profits;
- Changes in production and reserves;
- Differentiation between upstream and refining businesses;
- Capital expenditures and project returns;
- Share buybacks and dividend policies.
Energy stocks and technology stocks are driven by different factors. If oil prices rise, it may support upstream performance but could also increase costs for businesses and consumers. A single earnings report outcome cannot directly represent the direction of the entire energy sector.
How to interpret US stock data on the OKX Wallet page?
The US stock market page provides multiple data fields:
- Price: Observe real-time market price changes;
- 24-hour fluctuation: Determine short-term market reactions;
- Market Cap: Understand the size of the company or asset;
- 24-hour trading volume: Assess current trading interest;
- 24/7 tradable identifier: Indicates that the page provides 24/7 on-chain trading access, but does not equate to traditional US stock exchanges being open all day.
Why is earnings report week suitable for using OKX Wallet for all-day observation?
Earnings reports are often released before the US stock market opens or after it closes. Traditional markets have fixed trading hours, and many investors can only wait for the next opening time to execute their trading plans.
The OKX Wallet provides on-chain price quotes and trading access for tokenized stocks and ETFs, allowing users to continuously check relevant asset prices, trading volumes, and market changes before and after earnings announcements. For investors across time zones, this all-day observation capability can reduce waiting times and facilitate users in setting limit orders, taking profits, and managing risks in advance.
However, users must understand:
- Tokenized stocks are not the same as native stocks in traditional brokerage accounts;
- Token prices may be influenced by underlying assets, on-chain liquidity, trading depth, and mapping mechanisms;
- 24/7 tradable does not mean that earnings information will automatically lead to better prices;
- Low liquidity periods may result in greater slippage;
- The moment earnings are announced is not suitable for impulsive trading without a plan.
A more suitable observation method for earnings report week
Before earnings: List expected differences
First, record the indicators that the market is focusing on, such as cloud revenue, advertising revenue, delivery volume, payment transaction volumes, capital expenditures, oil and gas production, and profit margins. Only by clarifying what the market anticipates can one assess the reactions post-earnings announcement.
After earnings release: Look at actual results and guidance
Do not just look at "profits" or "revenue growth" in the headline; also observe guidance, cash flow, management's statements, and risk factors.
After earnings: Observe whether prices and volumes confirm
If the earnings report is excellent but prices do not rise, it may indicate that the positive news has already been priced in; if results are mediocre but prices increase, it may suggest the market values future guidance more. At this point, it is necessary to analyze trading volume and volatility to determine the market's true reaction.
Trade execution: Set a plan first, then decide whether to participate
Users can first set price ranges and maximum losses, using limit orders or stop-loss tools to avoid making emotional trades at the moment of the earnings release. For tokenized assets, it is also essential to verify network stability, liquidity, slippage, and exit mechanisms.
Conclusion: Earnings report week is not about guessing up or down, but about studying expected differences
This week, from Coca-Cola and Boeing to Visa and Robinhood, and then to Google, Microsoft, Amazon, Intel, and then ExxonMobil and Chevron, it covers various market segments including consumption, aviation, payments, technology, retail, chips, and energy.
A dense release of earnings reports often indicates increased volatility, but volatility does not guarantee returns. The truly valuable approach is to observe the company's fundamentals, market expectations, earnings guidance, and price reactions together.
Exclusive Benefits for AiCoin Users
Use OKX Web3 Wallet to 'Invest in Global Assets'!
Bind the invitation code 【AICOIN88】, and enjoy a 20% transaction cost saving (Gas optimization and other benefits)!
Download/upgrade the OKX Web3 Wallet now to catch the wave:
https://jump.do/xlink?checkProxy=true&proxyId=24
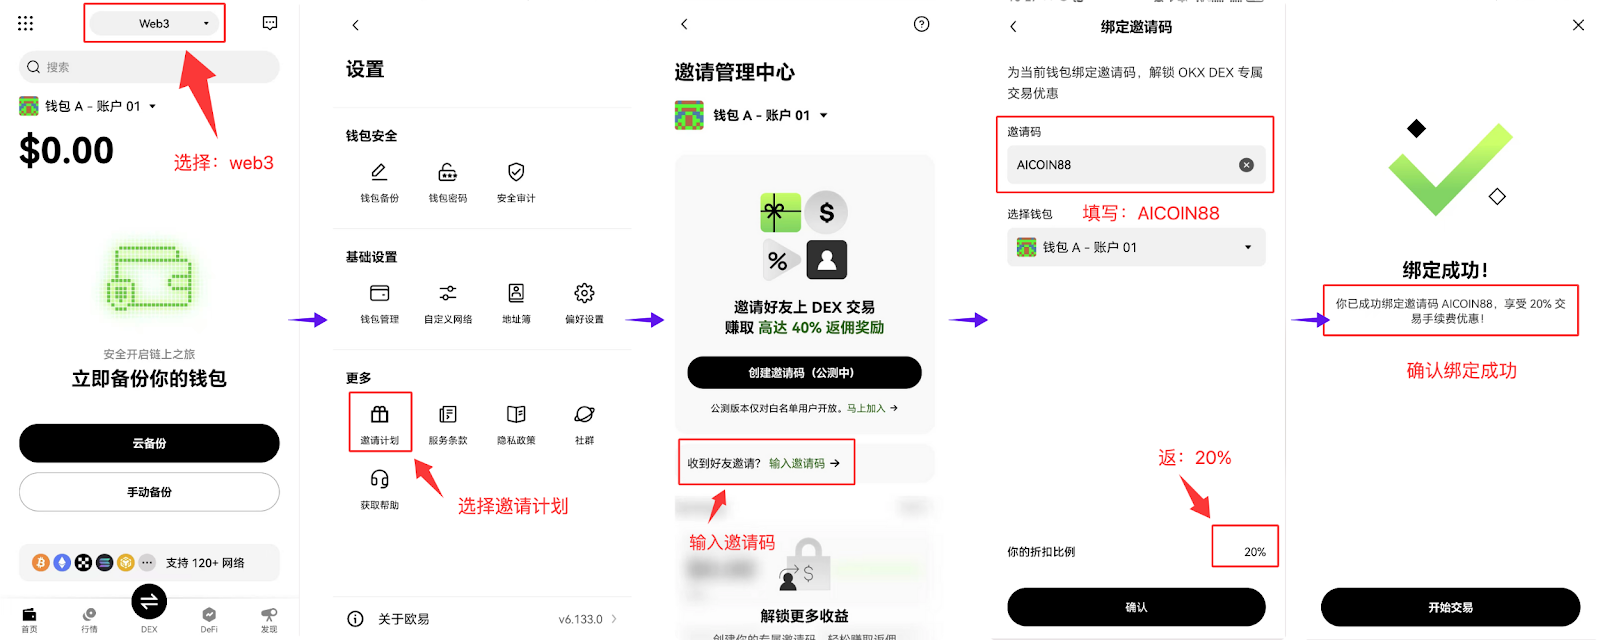
Use the exclusive invitation code 【AICOIN88】 to bind your OKX Wallet, the website can also be operated easily!
https://web3.okx.com/ul/joindex?ref=AICOIN88
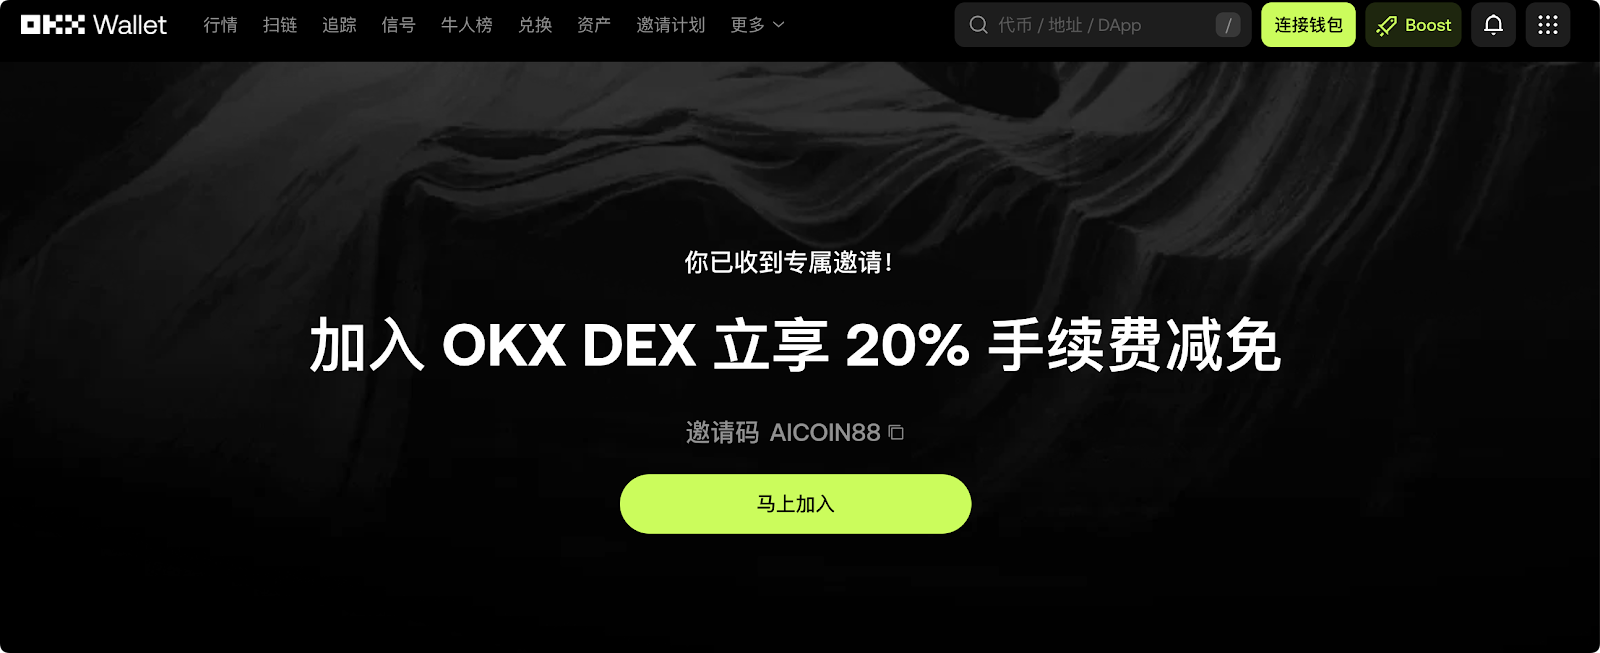
Don’t wait any longer, install the OKX Wallet, bind the discount and reap new wealth!
免责声明:本文章仅代表作者个人观点,不代表本平台的立场和观点。本文章仅供信息分享,不构成对任何人的任何投资建议。用户与作者之间的任何争议,与本平台无关。如网页中刊载的文章或图片涉及侵权,请提供相关的权利证明和身份证明发送邮件到[email protected],本平台相关工作人员将会进行核查。